Ramandeep Singh / 프로필
- 정보
|
no
경험
|
9
제품
|
1
데모 버전
|
|
0
작업
|
0
거래 신호
|
0
구독자
|
At Traders Mantra, I research systematic trading ideas and develop practical MT5 indicators and Expert Advisors. My work focuses on clear trading logic, controlled risk, realistic backtesting and tools that simplify complex price behaviour without making exaggerated promises.
I am the developer of Smart Trendline Detector for MetaTrader 5. I also share product guidance, trading research and educational market insights through my MQL5 blog and channel.
I test an indicator by changing the symbol, timeframe and market condition, then watching what changes when new candles arrive. For risk tools, I manually verify at least one calculation. For analytical tools, I check whether historical objects move, disappear or appear late.
A demo is not merely a preview. Used properly, it is a small controlled experiment.
This is also the right way to evaluate tools such as Trendline Machinegun or Smart Trendline Detector: test the behaviour first, then decide whether it fits your own trading process.
When I test a trendline indicator, I watch three things:
• When did the line first appear?
• Did its anchor points change as new candles formed?
• Was the breakout visible in real time, or only on the historical chart?
A clean screenshot can’t answer those questions. Forward testing can.
What do you check first when testing a trendline indicator?
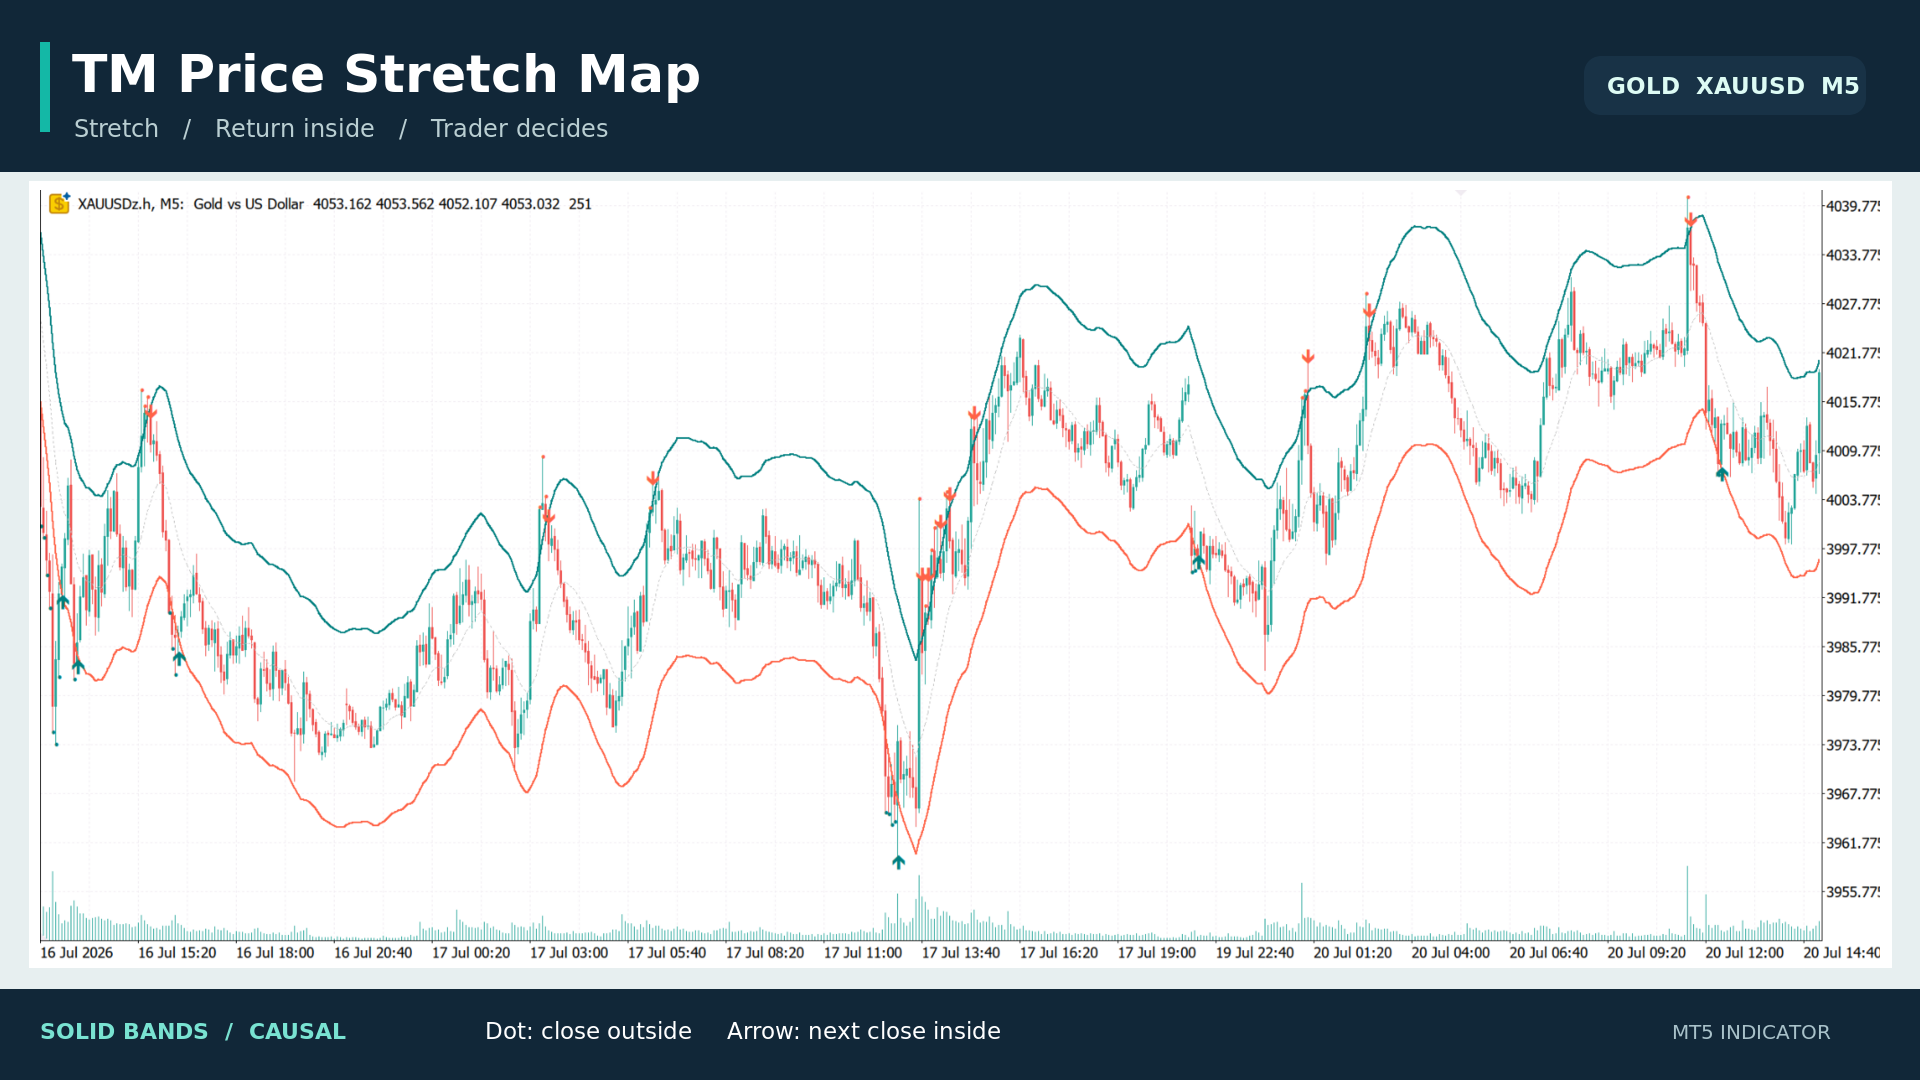
The idea is simple: first spot a candle that closes beyond the price envelope. Then watch whether the next completed candle closes back inside. Small dots mark the stretch; arrows mark the return.
The solid bands and markers use prices available at the time of each candle. There is also an optional dashed smoothing overlay for visual analysis, which can repaint. It does not generate the markers.
A return inside the bands is a setup to examine, not an automatic trade. I use it alongside market structure, trend and risk management.
https://www.mql5.com/en/market/product/197922
Search for “TM Price Stretch Map” in my MQL5 Market products to download it free. I’d be interested to hear which symbol and timeframe you try it on.
TM Price Stretch Map은 캔들이 밴드 밖에서 마감한 뒤 다음 확정 캔들이 밴드 안으로 돌아왔는지 차트에 표시합니다. 실선 밴드는 해당 시점까지 확인된 가격만 사용하는 인과적 가우시안 커널 계산을 기반으로 합니다. 상단 밴드 위에서 마감하면 빨간 점, 하단 밴드 아래에서 마감하면 청록색 점이 표시됩니다. 그 다음 확정 캔들이 두 밴드 안에서 마감하면 상단 이탈 뒤에는 아래쪽 화살표, 하단 이탈 뒤에는 위쪽 화살표가 표시됩니다. 점과 화살표는 실선 밴드만 기준으로 계산됩니다. 선택 가능한 점선 밴드는 과거 데이터를 소급하여 평활화하므로 새 캔들이 생기면 과거 곡선이 다시 그려질 수 있습니다. 점선은 시각적 분석용이며 점이나 화살표를 생성하지 않습니다. 커널 대역폭, 밴드 폭, 가격 소스, 표시 기간, 색상, 중심선과 마커를 설정할 수 있습니다. 자동 매매를 하지 않으며 가격 반전을 보장하지 않습니다
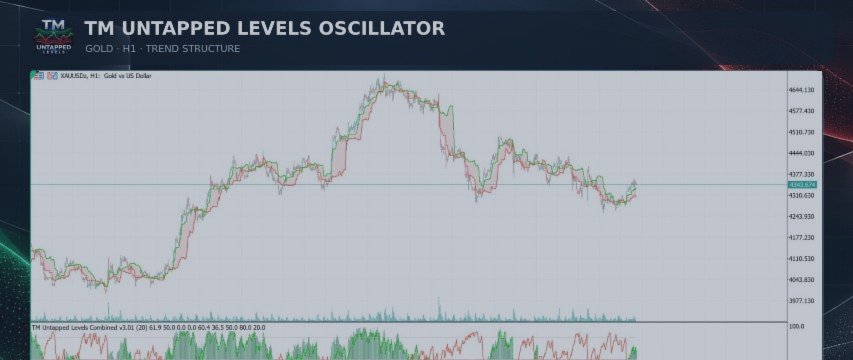
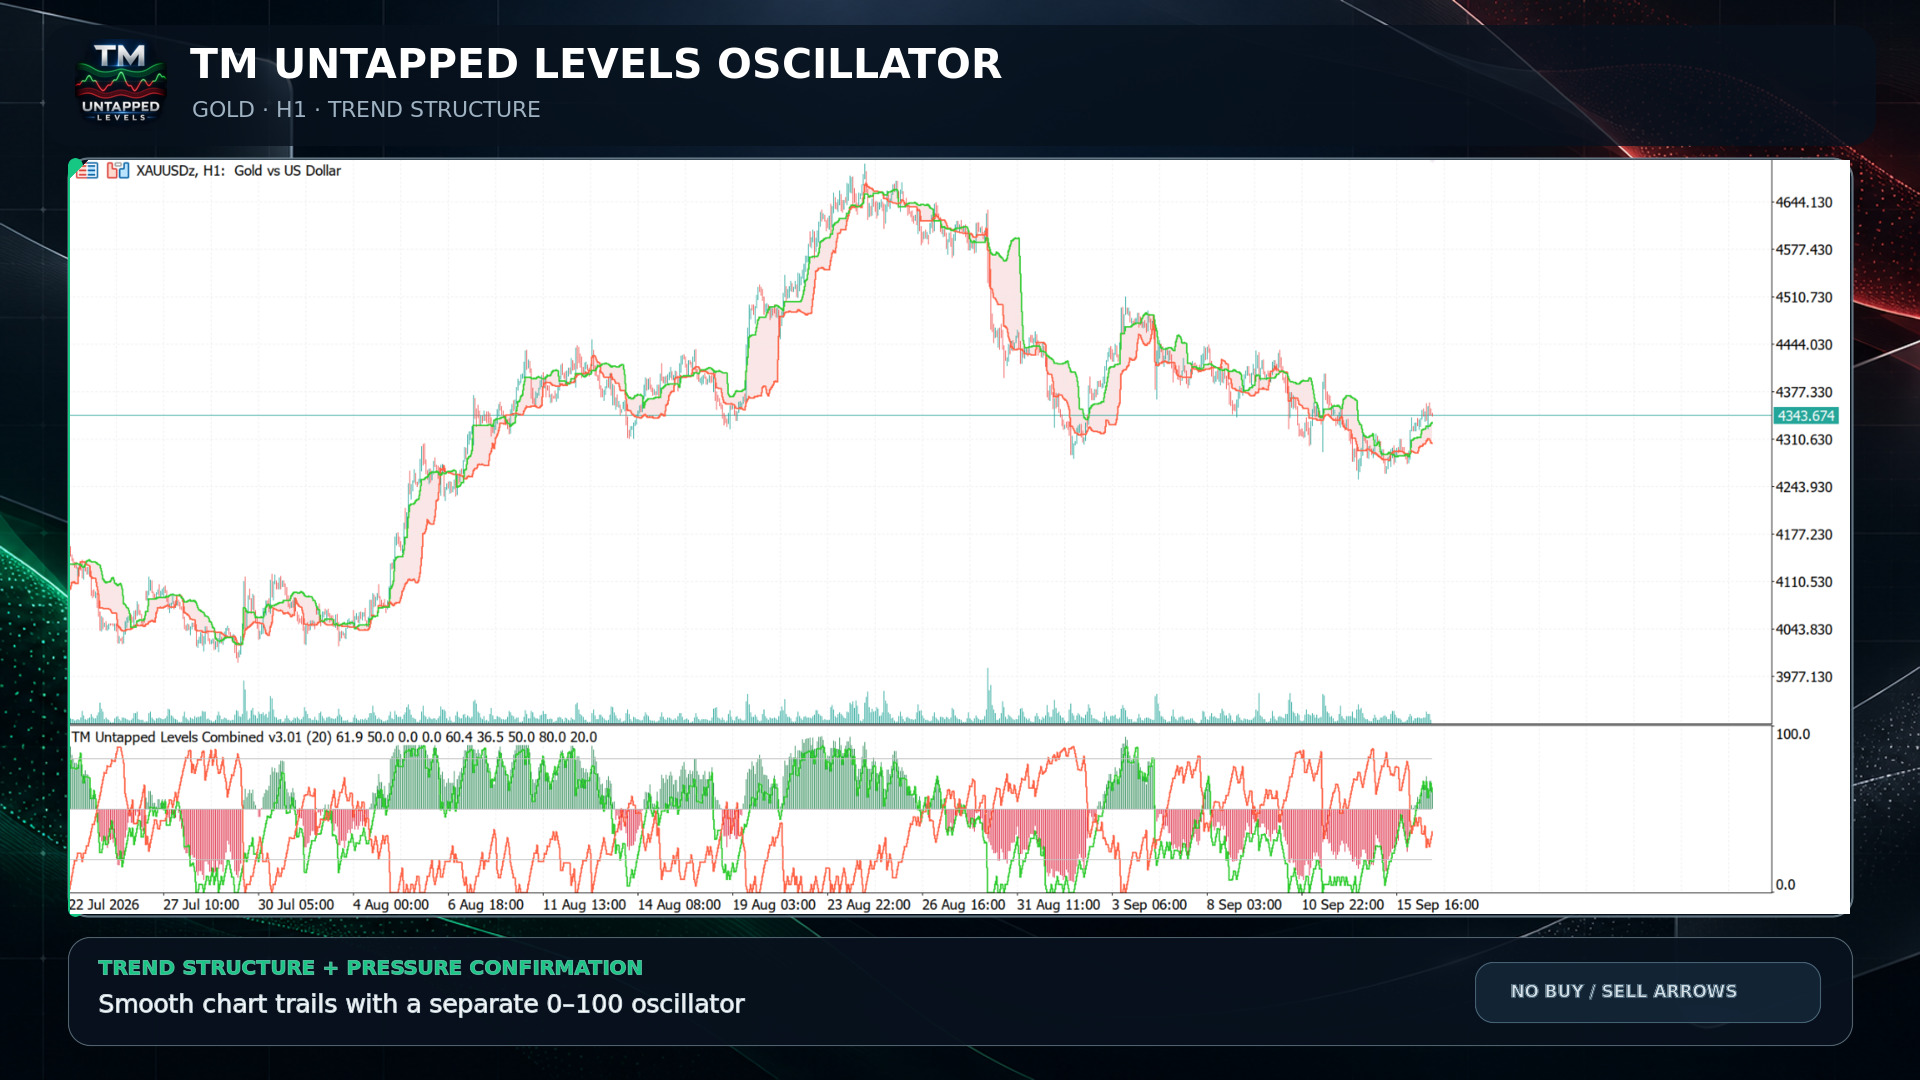
The indicator tracks prior highs and lows that remain untapped by later price action. Their persistence is converted into bullish and bearish pressure scores from 0 to 100. This helps traders see which side of the market is retaining more unresolved structure without covering the chart with buy and sell arrows.
KEY FEATURES
• Bullish and bearish pressure lines
• Centered two-color histogram around the 50 balance level
• Adjustable upper and lower reference thresholds
• Smooth upper and lower trailing levels on the main chart
• Optional shaded chart zone between the trails
• Up to 1,500 overlay bars displayed by default
• Quality-weighted scoring using level age and ATR-normalized distance
• Optional popup, push, email and sound alerts
• No buy or sell arrows on the chart
• Works on all symbols and timeframes
Download it for FREE
https://www.mql5.com/en/market/product/196347
TM Untapped Levels Oscillator는 MetaTrader 5용 이중 표시 시장 압력 지표입니다. 별도의 창에 표시되는 명확한 오실레이터와 메인 가격 차트의 부드러운 동적 트레일을 결합합니다. 이 지표는 이후 가격 움직임에 의해 아직 도달되지 않은 이전 고점과 저점을 추적합니다. 이러한 레벨의 지속성을 0에서 100까지의 상승 및 하락 압력 점수로 변환하여, 매수·매도 화살표로 차트를 복잡하게 만들지 않고 어느 쪽에 미해결 가격 구조가 더 많이 남아 있는지 확인할 수 있습니다. 주요 기능 • 상승 및 하락 압력 라인 • 50 균형선을 중심으로 한 2색 히스토그램 • 조절 가능한 상단 및 하단 기준 레벨 • 메인 차트의 부드러운 상단 및 하단 트레일 • 트레일 사이의 선택적 음영 영역 • 기본값으로 최대 1500개의 과거 오버레이 바 표시 • 레벨의 나이와 ATR 정규화 거리를 사용한 품질 가중 점수 • 팝업, 푸시, 이메일 및 사운드 알림 • 차트에 매수 또는 매도
TM Volatility Scalping Edge는 지속적으로 많은 신호를 표시하기보다 선별되고 이해하기 쉬운 스캘핑 기회를 원하는 트레이더를 위해 설계된 MetaTrader 5용 적응형 변동성 지표입니다. 이 지표는 ATR 기반 변동성, 가격과 동적 변동성 경계의 상호작용, 방향성 압력 및 반복되는 시장 움직임을 분석합니다. 필요한 조건이 일치하면 녹색 또는 주황색 화살표가 잠재적인 상승 또는 하락 기회를 표시합니다. 상단과 하단의 적응형 밴드는 시장 변동성 변화에 따라 자동으로 확장되거나 축소됩니다. 이를 통해 조용한 시장, 일반적인 시장 및 더욱 활발한 시장 환경에 적응할 수 있습니다. 차트 대시보드 표시 항목: • 현재 변동성 상태 • ATR 값 • 상승 및 하락 돌파 비율 • 어느 방향이든 돌파할 확률 • 반복 움직임 확률 • 반복 움직임의 상대적 우위 • 현재 시장 활동 • 중립, 상승 또는 하락 시장 판단 주요 기능: • 선별된 상승 및 하락 화살표 • 적응형 변동성
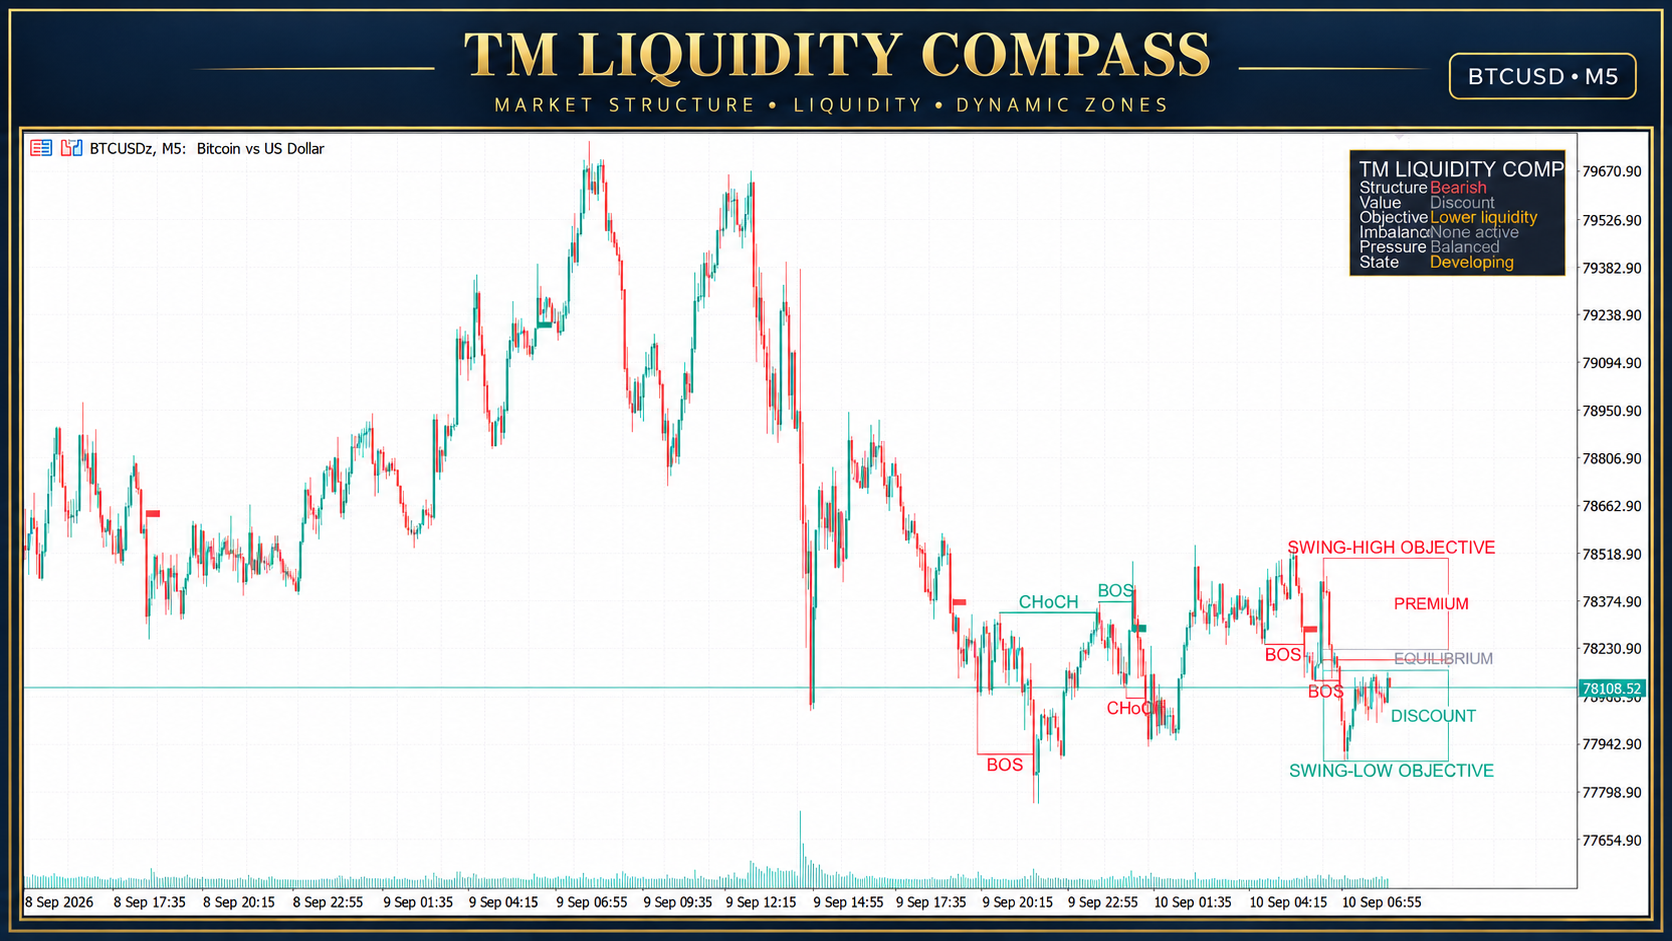
The indicator brings market structure and liquidity information together in one clear chart view:
• BOS and CHoCH
• Active bullish or bearish market bias
• Premium, equilibrium and discount areas
• Nearest upper and lower liquidity objectives
• Qualified imbalance and FVG areas
• One dynamic dominant support or resistance zone
• Compact Buyers, Sellers or Balanced pressure dashboard
TM Liquidity Compass is an analytical indicator for MetaTrader 5. It does not open, manage or close trades automatically.
Download it FREE:
https://www.mql5.com/en/market/product/195174
You can also open the MetaTrader 5 Market and search for “TM Liquidity Compass.”
TM Liquidity Compass brings market structure, liquidity context and value mapping together in one clean chart-based indicator.
Main features:
• Confirmed BOS and CHoCH structure markings
• Green and red trade-confirmation bands
• Premium, equilibrium and discount areas
• Upper and lower liquidity objectives
• One dynamic dominant support or resistance zone
• Qualified imbalance detection
• Compact market-context dashboard
• Adjustable visual and calculation settings
The dominant zone automatically adapts as market conditions change. Strong support is displayed in green and strong resistance in red. When a zone is breached or weakened, it is removed and replaced by a new qualifying area.
The indicator is designed to provide organized market context without overcrowding the chart.
TM Liquidity Compass is currently being prepared for release on the MQL5 Market.
This is an analytical tool and does not guarantee trading results. Always apply your own analysis and risk-management rules.
#MetaTrader5 #MQL5 #MarketStructure #Liquidity #BOS #CHoCH #TradingIndicator
TM Liquidity Compass는 MetaTrader 5 차트에서 시장 구조와 유동성을 분석하는 지표입니다. 확정된 BOS 및 CHoCH 표시, 프리미엄·균형·디스카운트 영역, 인접 유동성 목표, 조건을 충족한 불균형 감지, 그리고 하나의 동적 주요 지지 또는 저항 구역을 한 화면에 결합합니다. 간결한 패널은 현재 구조, 가치 영역, 목표, 불균형, 시장 압력 및 시장 상태를 요약합니다. 주요 기능: 확정된 BOS 및 CHoCH 구조 표시 녹색 및 적색 거래 확인 밴드 프리미엄·균형·디스카운트 가치 맵 상단 및 하단 유동성 목표 하나의 동적 주요 지지 또는 저항 구역 선택적 구조 정렬 기능이 포함된 조건부 불균형 감지 과거 데이터 계산 및 조정 가능한 표시 설정 상승 CHoCH는 가능한 롱 시나리오를 준비합니다. 이후 상승 BOS가 나타나면 롱 표시를 확정하고 짧은 녹색 밴드를 그립니다. 하락 CHoCH는 가능한 숏 시나리오를 준비합니다. 이후 하락 BOS가 나타나면 숏 표시를
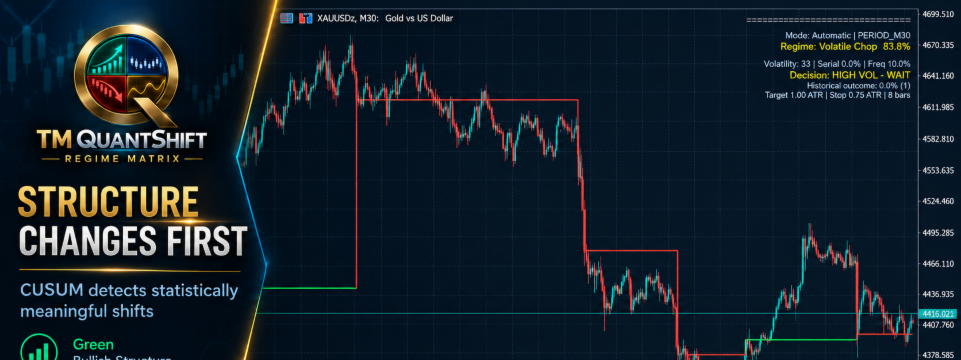
Markets do not behave the same way all the time. They transition between bullish trends, bearish trends, ranges and volatile conditions. QuantShift is designed to identify these structural changes and display each detected regime through clean, colour-coded levels directly on the chart.
Key features:
• Adaptive change-point detection
• Bullish, bearish, ranging and volatile-regime classification
• Clear regime-level visualization
• Automatic symbol and timeframe adaptation
• Suitable for Forex, Gold, Silver, Oil, indices and cryptocurrencies
• Particularly useful on M30 and H1
• No distracting BUY or SELL arrows
TM QuantShift Regime Matrix is a market-analysis tool—not an automated trading system. It helps traders understand when the character of the market may be changing before applying their own entry strategy and risk management.
**See the shift. Understand the regime. Trade with context.**
https://www.mql5.com/en/market/product/194664
#MQL5 #MetaTrader5 #TradingIndicator #MarketRegime #TechnicalAnalysis #ForexTrading #GoldTrading #AlgorithmicTrading #TradingMantra
TM QuantShift Regime Matrix는 MetaTrader 5용 적응형 시장 상태 분석 지표입니다. 일반적인 가격 노이즈에 가려지기 쉬운 중요한 시장 행동의 변화를 차트에서 명확하게 확인하도록 설계되었습니다. 이 지표는 세 가지 정량 분석 엔진을 결합합니다. 1. 변화점 탐지 CUSUM 엔진은 표준화된 가격 수익률과 누적 방향 압력을 분석하여 의미 있는 시장 구조 변화를 탐지합니다. 2. 확률 기반 시장 국면 가격 방향, 움직임 효율성 및 변동성 특성을 평가하여 상승, 하락, 횡보 및 고변동성 시장 상태를 추정합니다. 3. ATR 변동성 지속성 변동성 엔진은 비정상적으로 큰 움직임이 일회성 사건인지, 지속적인 변동성 확대의 일부인지 측정합니다. 지표 해석 방법 녹색 라인 구간은 상승 구조 압력을 나타냅니다. 빨간색 구간은 하락 구조 압력을 나타냅니다. 중립 구간은 아직 명확한 방향성이 형성되지 않았음을 의미합니다. 중앙의 계단형 라인은 최근 구조 변화가 탐지된 가격
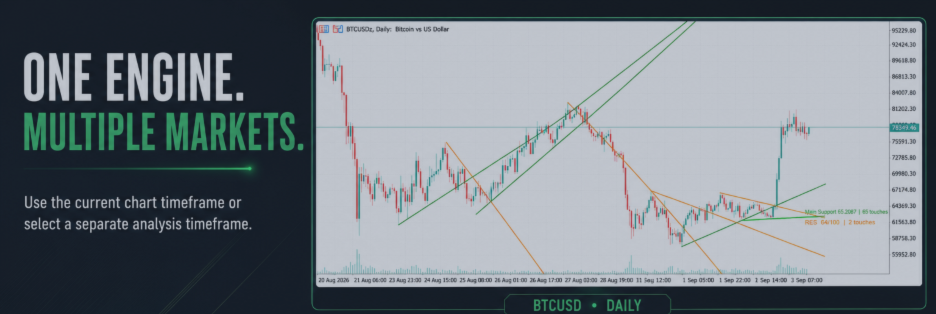
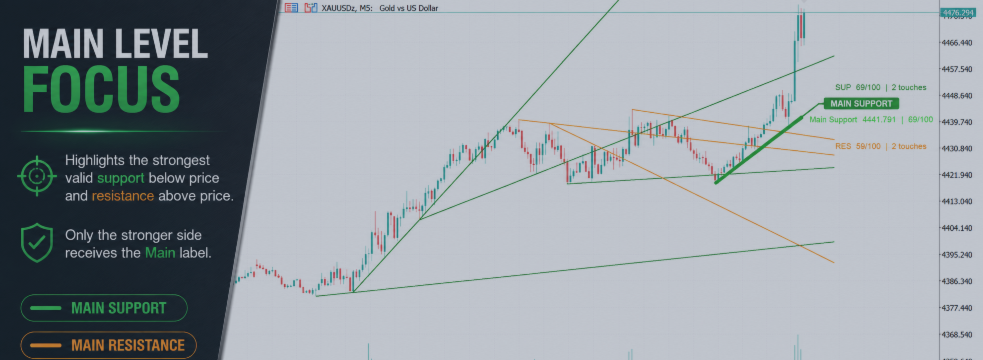
A professional MT5 indicator designed to automatically detect, rank and display meaningful support and resistance trendlines.
Key features:
• Automatic support and resistance trendlines
• Strength scores from 0 to 100
• Historical touch analysis
• Similar-line filtering
• Main Support or Main Resistance identification
• Pressure Zone detection
• Multi-timeframe analysis
• Clean display with only three principal labels
Instead of treating every trendline equally, Trendline MachineGun helps bring the strongest current structures into focus.
Explore it on MQL5 Market:
https://www.mql5.com/en/market/product/194003?source=Site+Profile
Trendline MachineGun MT5 is an analytical indicator and does not execute trades.
#MetaTrader5 #MQL5 #Trendlines #TechnicalAnalysis #ForexTrading #TradingIndicator