Ramandeep Singh / Perfil
- Información
|
no
experiencia
|
9
productos
|
1
versiones demo
|
|
0
trabajos
|
0
señales
|
0
suscriptores
|
At Traders Mantra, I research systematic trading ideas and develop practical MT5 indicators and Expert Advisors. My work focuses on clear trading logic, controlled risk, realistic backtesting and tools that simplify complex price behaviour without making exaggerated promises.
I am the developer of Smart Trendline Detector for MetaTrader 5. I also share product guidance, trading research and educational market insights through my MQL5 blog and channel.
I test an indicator by changing the symbol, timeframe and market condition, then watching what changes when new candles arrive. For risk tools, I manually verify at least one calculation. For analytical tools, I check whether historical objects move, disappear or appear late.
A demo is not merely a preview. Used properly, it is a small controlled experiment.
This is also the right way to evaluate tools such as Trendline Machinegun or Smart Trendline Detector: test the behaviour first, then decide whether it fits your own trading process.
When I test a trendline indicator, I watch three things:
• When did the line first appear?
• Did its anchor points change as new candles formed?
• Was the breakout visible in real time, or only on the historical chart?
A clean screenshot can’t answer those questions. Forward testing can.
What do you check first when testing a trendline indicator?
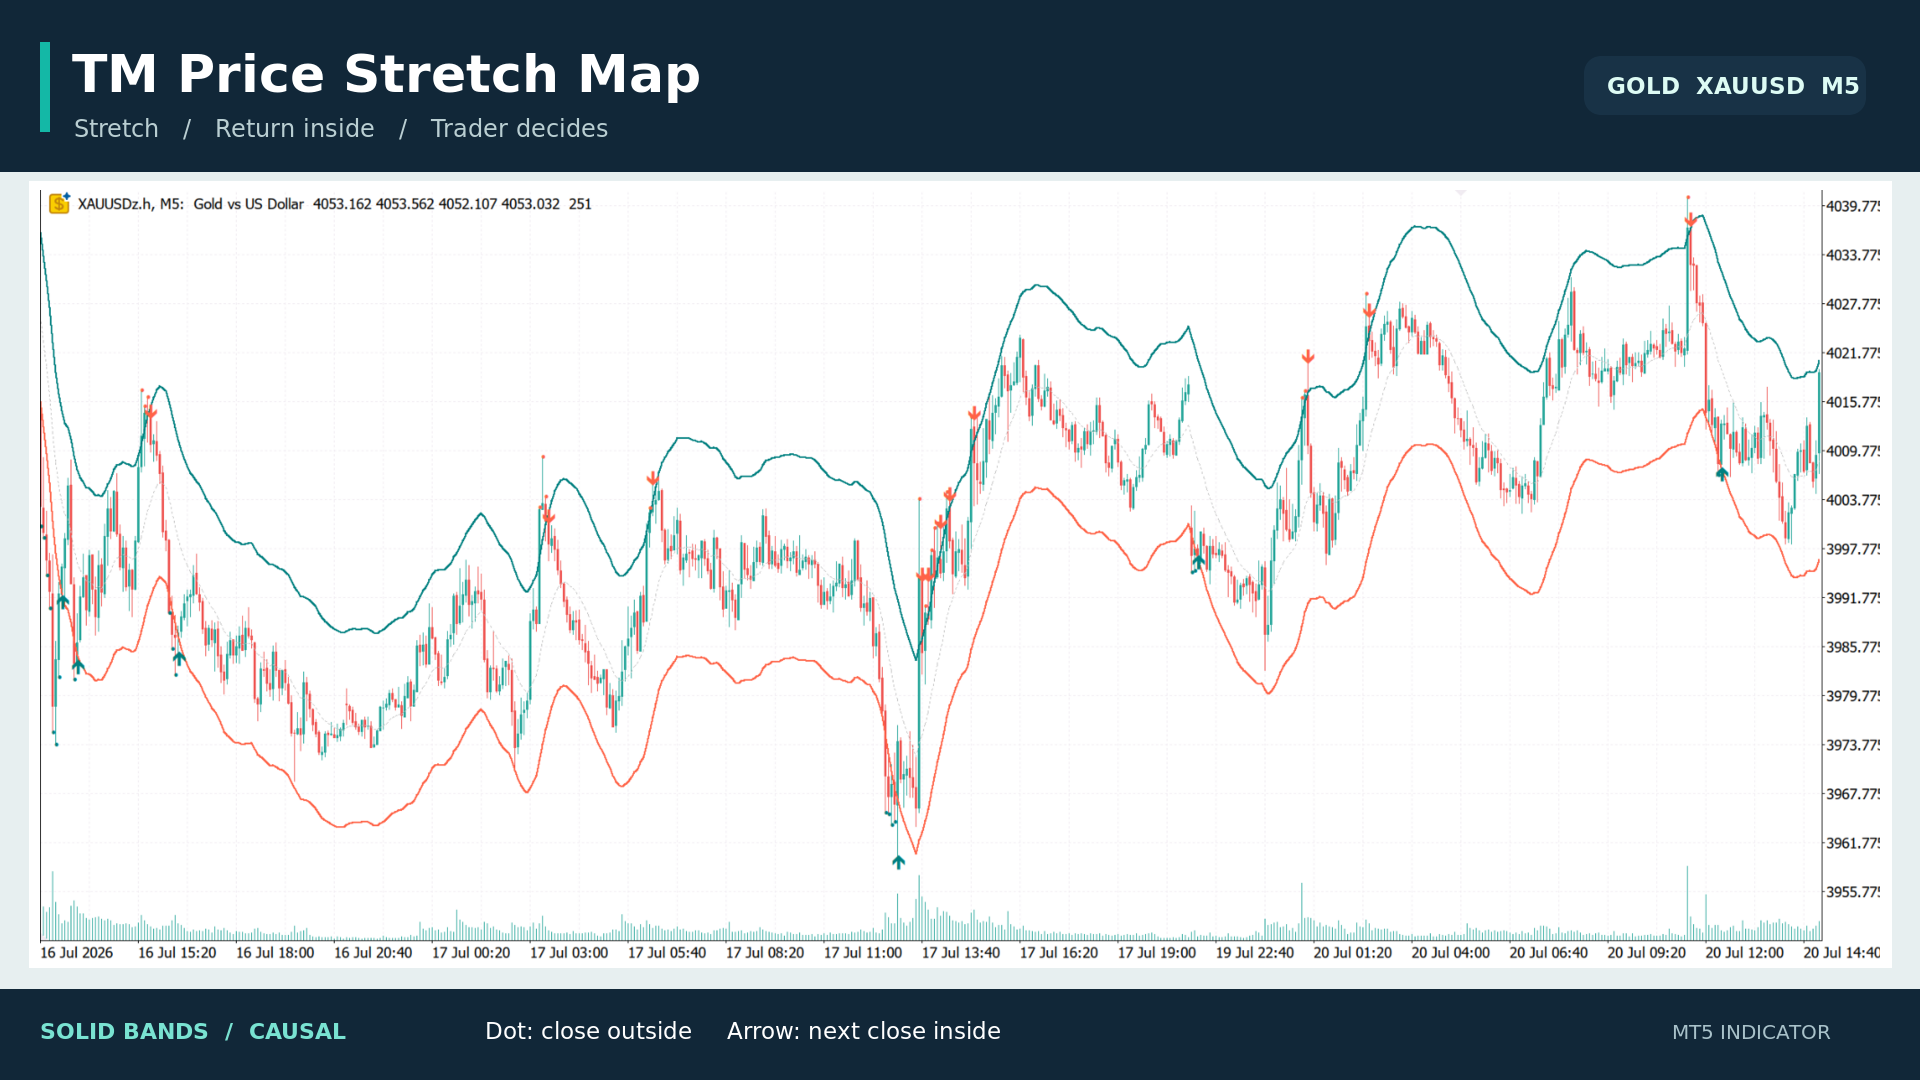
TM Price Stretch Map: From a Price Extreme to a Return Inside the Bands
The idea is simple: first spot a candle that closes beyond the price envelope. Then watch whether the next completed candle closes back inside. Small dots mark the stretch; arrows mark the return.
The solid bands and markers use prices available at the time of each candle. There is also an optional dashed smoothing overlay for visual analysis, which can repaint. It does not generate the markers.
A return inside the bands is a setup to examine, not an automatic trade. I use it alongside market structure, trend and risk management.
https://www.mql5.com/en/market/product/197922
Search for “TM Price Stretch Map” in my MQL5 Market products to download it free. I’d be interested to hear which symbol and timeframe you try it on.
TM Price Stretch Map muestra una envolvente de precios para identificar cuándo una vela cierra fuera de una banda y la siguiente vela cerrada vuelve al interior. Las bandas continuas se calculan con un núcleo gaussiano causal, usando únicamente los precios disponibles en cada momento. Un punto rojo marca un cierre por encima de la banda superior; un punto turquesa marca un cierre por debajo de la inferior. Una flecha bajista aparece cuando la siguiente vela cerrada vuelve a cerrar entre ambas
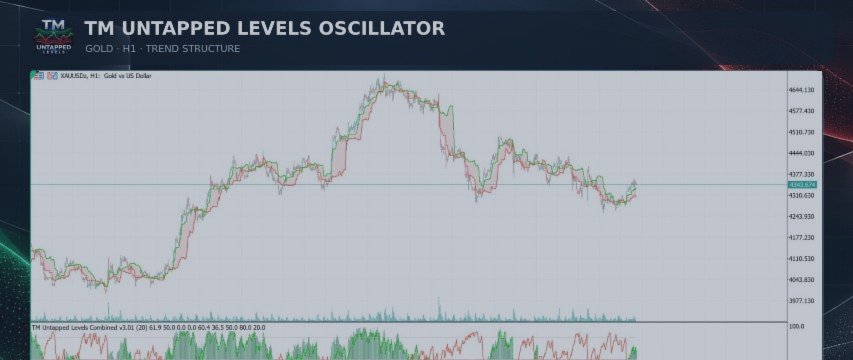
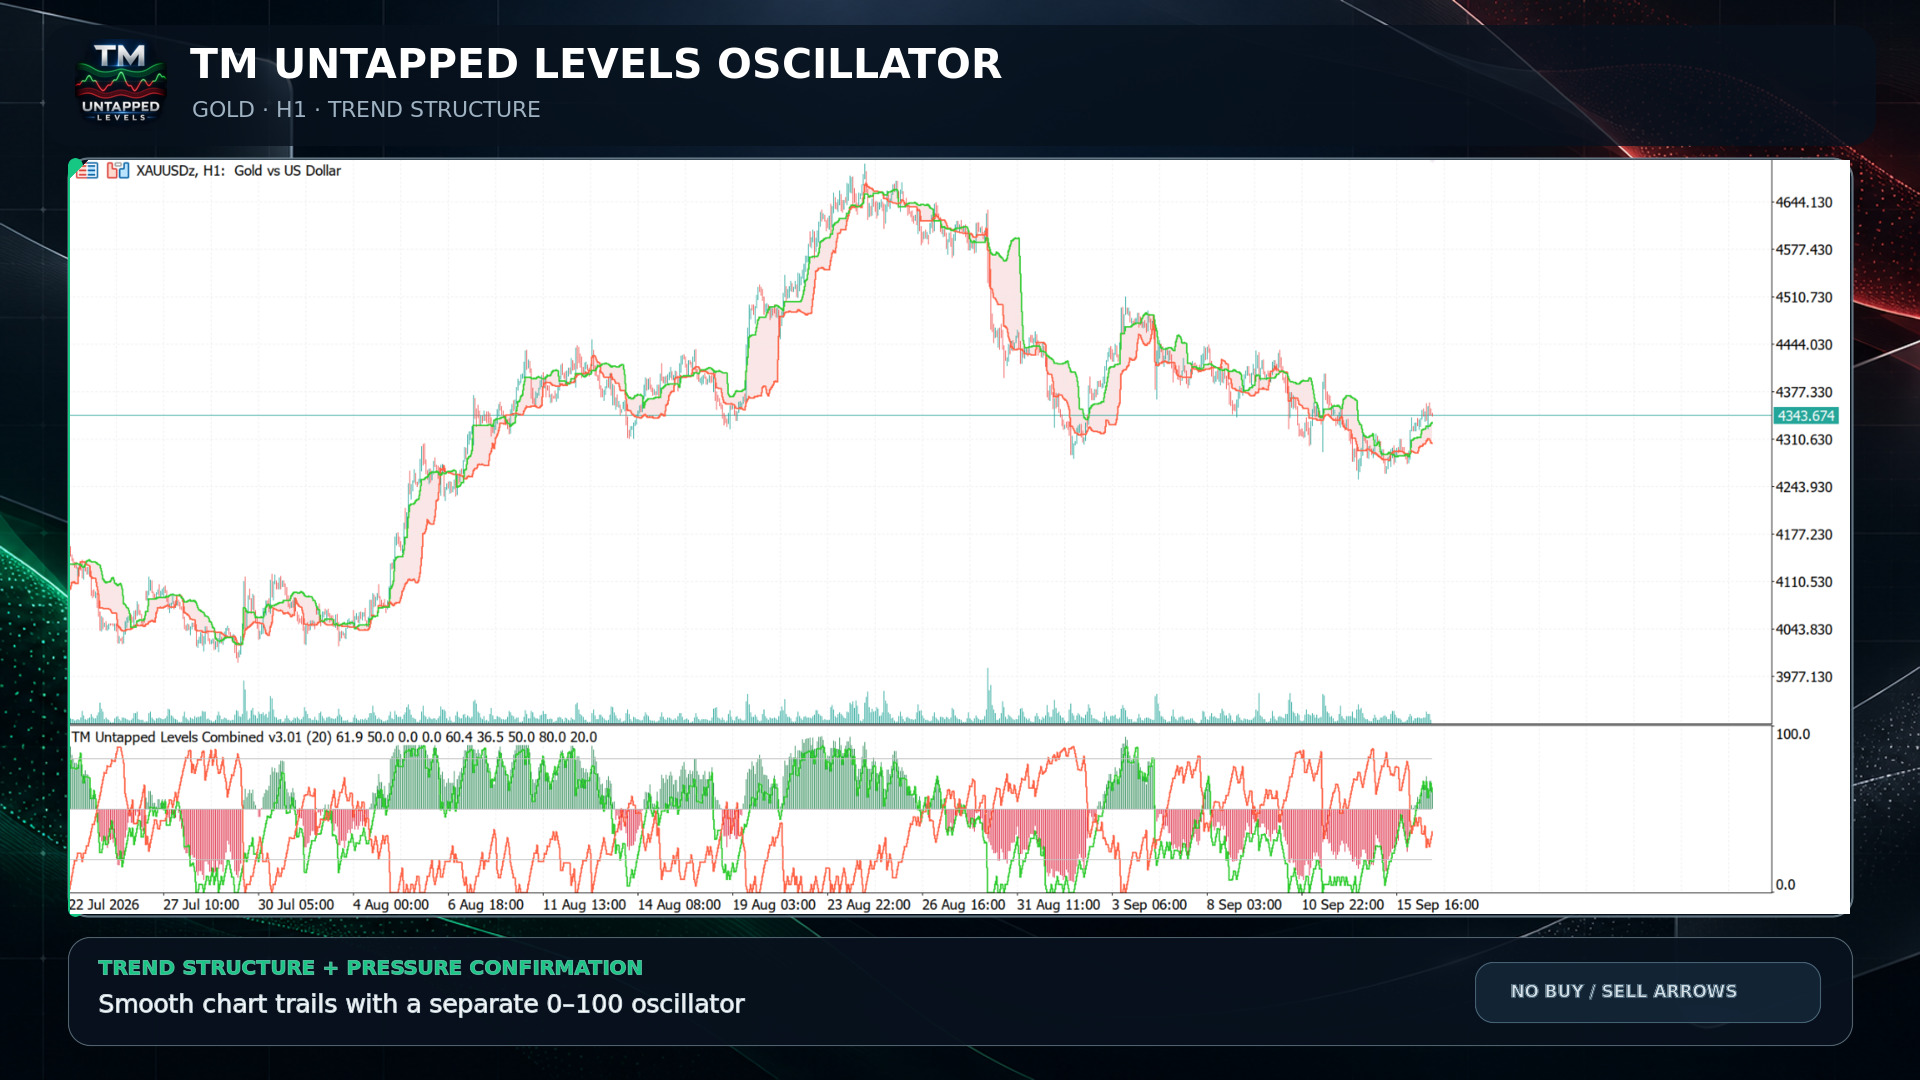
TM Untapped Levels Oscillator for MT5 – See Market Pressure Beyond Price
The indicator tracks prior highs and lows that remain untapped by later price action. Their persistence is converted into bullish and bearish pressure scores from 0 to 100. This helps traders see which side of the market is retaining more unresolved structure without covering the chart with buy and sell arrows.
KEY FEATURES
• Bullish and bearish pressure lines
• Centered two-color histogram around the 50 balance level
• Adjustable upper and lower reference thresholds
• Smooth upper and lower trailing levels on the main chart
• Optional shaded chart zone between the trails
• Up to 1,500 overlay bars displayed by default
• Quality-weighted scoring using level age and ATR-normalized distance
• Optional popup, push, email and sound alerts
• No buy or sell arrows on the chart
• Works on all symbols and timeframes
Download it for FREE
https://www.mql5.com/en/market/product/196347
TM Untapped Levels Oscillator es un indicador de presión de mercado con doble visualización para MetaTrader 5. Combina un oscilador claro en una ventana separada con niveles dinámicos y suaves directamente sobre el gráfico principal. El indicador rastrea máximos y mínimos anteriores que aún no han sido alcanzados por la acción posterior del precio. Su persistencia se convierte en puntuaciones de presión alcista y bajista de 0 a 100, lo que ayuda a identificar qué lado del mercado conserva más
TM Volatility Scalping Edge es un indicador de volatilidad adaptativo para MetaTrader 5, diseñado para traders que prefieren oportunidades de scalping selectivas y fáciles de interpretar en lugar de recibir señales constantemente. El indicador analiza la volatilidad basada en ATR, la interacción del precio con límites dinámicos de volatilidad, la presión direccional y los movimientos repetidos del mercado. Cuando coinciden las condiciones necesarias, una flecha verde o naranja señala una posible
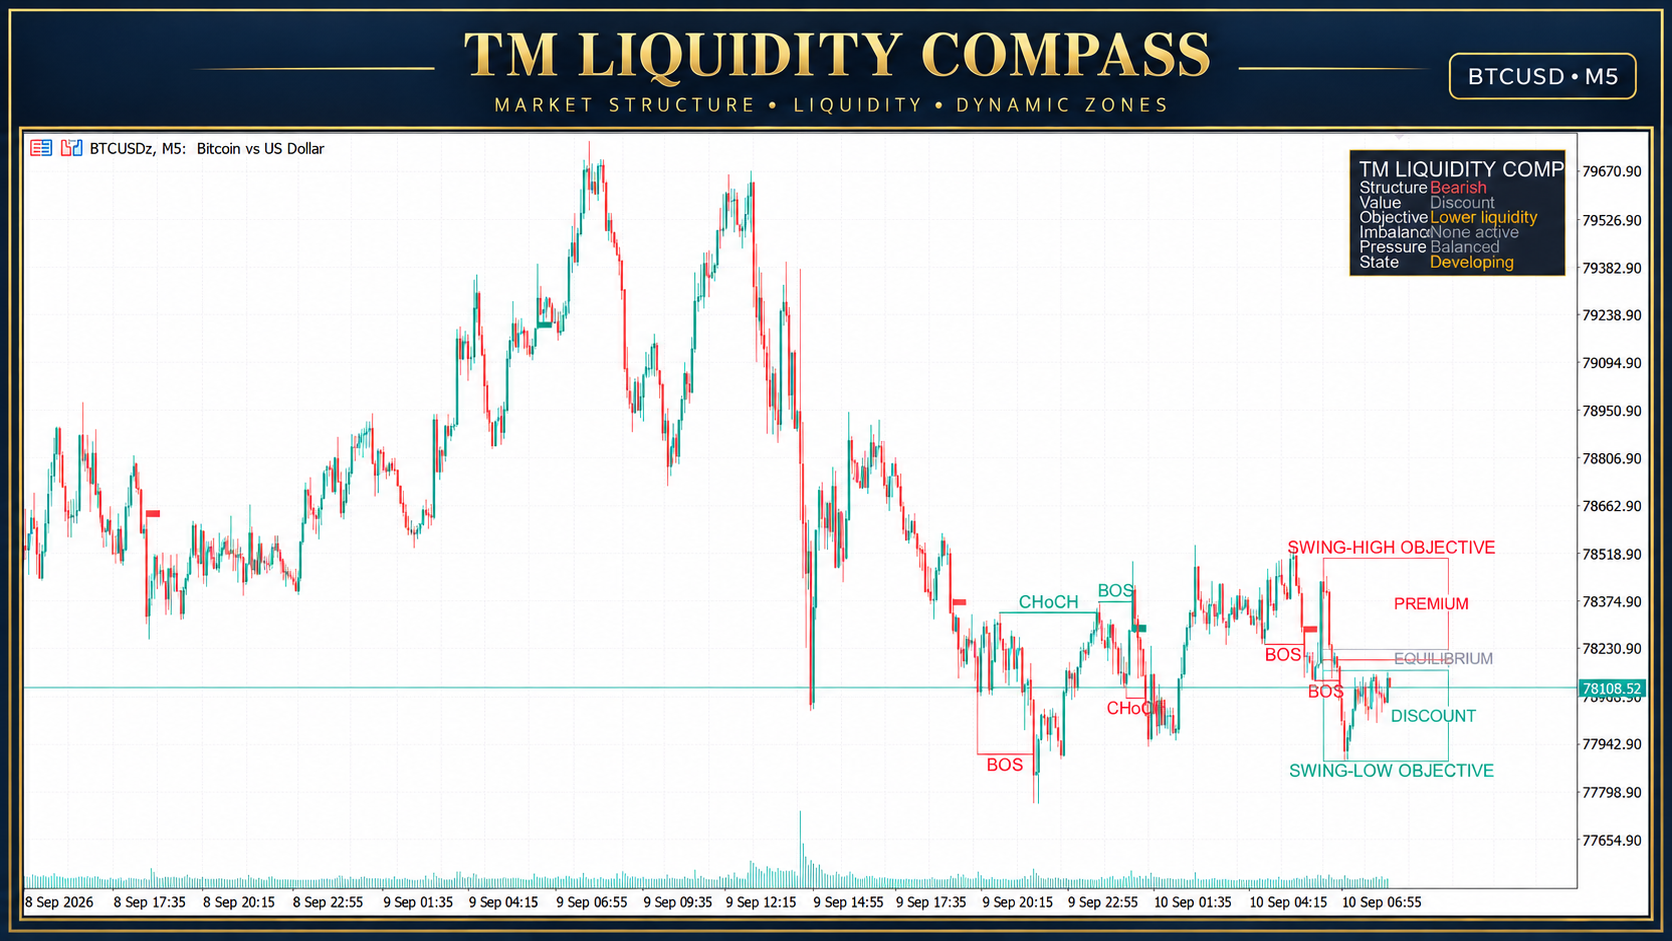
How TM Liquidity Compass Organizes Market Structure and Liquidity in MT5
The indicator brings market structure and liquidity information together in one clear chart view:
• BOS and CHoCH
• Active bullish or bearish market bias
• Premium, equilibrium and discount areas
• Nearest upper and lower liquidity objectives
• Qualified imbalance and FVG areas
• One dynamic dominant support or resistance zone
• Compact Buyers, Sellers or Balanced pressure dashboard
TM Liquidity Compass is an analytical indicator for MetaTrader 5. It does not open, manage or close trades automatically.
Download it FREE:
https://www.mql5.com/en/market/product/195174
You can also open the MetaTrader 5 Market and search for “TM Liquidity Compass.”
How to Read Market Structure and Liquidity with TM Liquidity Compass
TM Liquidity Compass brings market structure, liquidity context and value mapping together in one clean chart-based indicator.
Main features:
• Confirmed BOS and CHoCH structure markings
• Green and red trade-confirmation bands
• Premium, equilibrium and discount areas
• Upper and lower liquidity objectives
• One dynamic dominant support or resistance zone
• Qualified imbalance detection
• Compact market-context dashboard
• Adjustable visual and calculation settings
The dominant zone automatically adapts as market conditions change. Strong support is displayed in green and strong resistance in red. When a zone is breached or weakened, it is removed and replaced by a new qualifying area.
The indicator is designed to provide organized market context without overcrowding the chart.
TM Liquidity Compass is currently being prepared for release on the MQL5 Market.
This is an analytical tool and does not guarantee trading results. Always apply your own analysis and risk-management rules.
#MetaTrader5 #MQL5 #MarketStructure #Liquidity #BOS #CHoCH #TradingIndicator
TM Liquidity Compass es un indicador de estructura de mercado y liquidez para gráficos de MetaTrader 5. Combina marcas confirmadas de BOS y CHoCH, zonas de prima, equilibrio y descuento, objetivos de liquidez cercanos, detección de desequilibrios cualificados y una zona dominante dinámica de soporte o resistencia. Un panel compacto resume la estructura actual, el área de valor, el objetivo, el desequilibrio, la presión y el estado del mercado. Funciones principales: Marcas confirmadas de
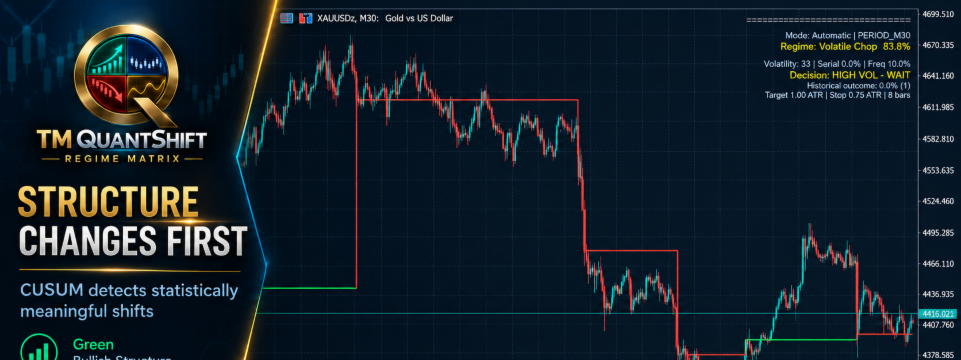
Markets do not behave the same way all the time. They transition between bullish trends, bearish trends, ranges and volatile conditions. QuantShift is designed to identify these structural changes and display each detected regime through clean, colour-coded levels directly on the chart.
Key features:
• Adaptive change-point detection
• Bullish, bearish, ranging and volatile-regime classification
• Clear regime-level visualization
• Automatic symbol and timeframe adaptation
• Suitable for Forex, Gold, Silver, Oil, indices and cryptocurrencies
• Particularly useful on M30 and H1
• No distracting BUY or SELL arrows
TM QuantShift Regime Matrix is a market-analysis tool—not an automated trading system. It helps traders understand when the character of the market may be changing before applying their own entry strategy and risk management.
**See the shift. Understand the regime. Trade with context.**
https://www.mql5.com/en/market/product/194664
#MQL5 #MetaTrader5 #TradingIndicator #MarketRegime #TechnicalAnalysis #ForexTrading #GoldTrading #AlgorithmicTrading #TradingMantra
TM QuantShift Regime Matrix es un indicador adaptativo del estado del mercado para MetaTrader 5. Está diseñado para hacer visibles los cambios importantes en el comportamiento del mercado antes de que queden ocultos dentro del ruido normal del precio. El indicador combina tres motores de análisis cuantitativo: 1. Detección de puntos de cambio El motor CUSUM analiza los rendimientos estandarizados del precio y la presión direccional acumulada para identificar cambios estructurales relevantes. 2
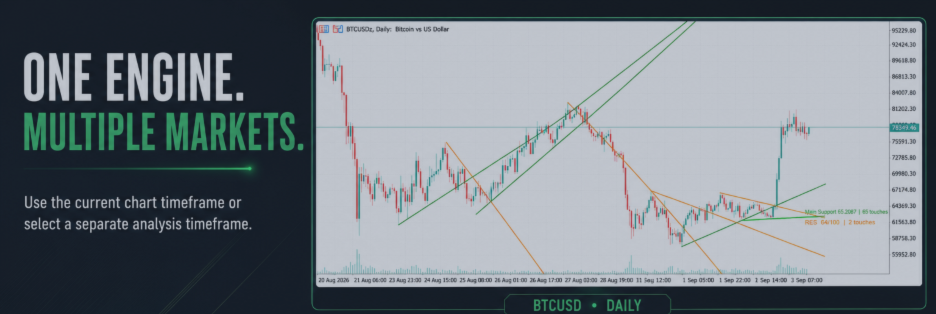
Automatic Trendline Analysis for MT5: Introducing Trendline MachineGun
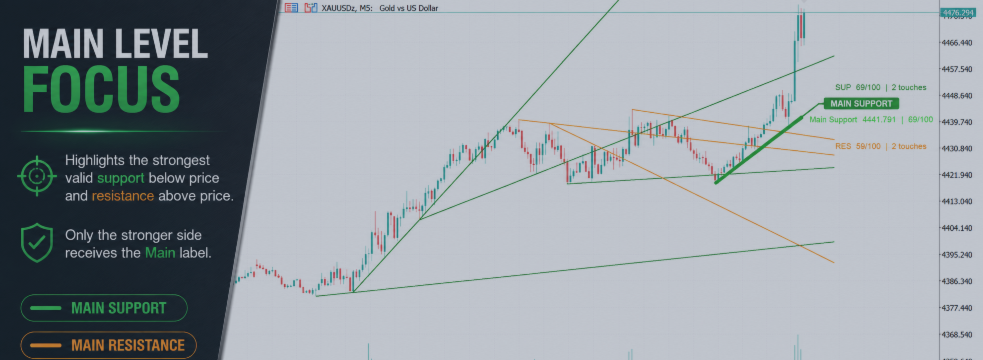
A professional MT5 indicator designed to automatically detect, rank and display meaningful support and resistance trendlines.
Key features:
• Automatic support and resistance trendlines
• Strength scores from 0 to 100
• Historical touch analysis
• Similar-line filtering
• Main Support or Main Resistance identification
• Pressure Zone detection
• Multi-timeframe analysis
• Clean display with only three principal labels
Instead of treating every trendline equally, Trendline MachineGun helps bring the strongest current structures into focus.
Explore it on MQL5 Market:
https://www.mql5.com/en/market/product/194003?source=Site+Profile
Trendline MachineGun MT5 is an analytical indicator and does not execute trades.
#MetaTrader5 #MQL5 #Trendlines #TechnicalAnalysis #ForexTrading #TradingIndicator