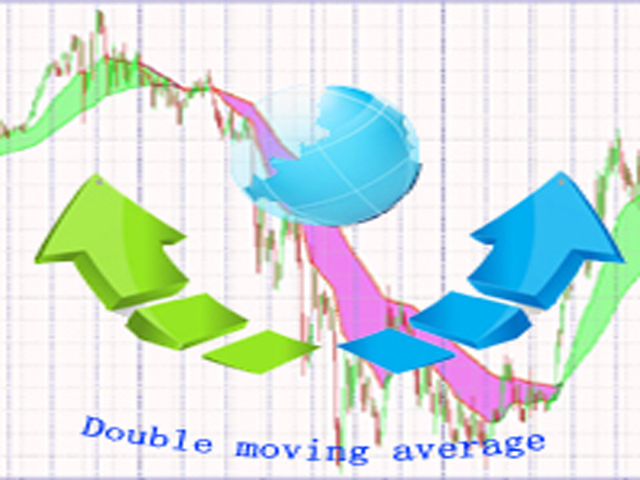
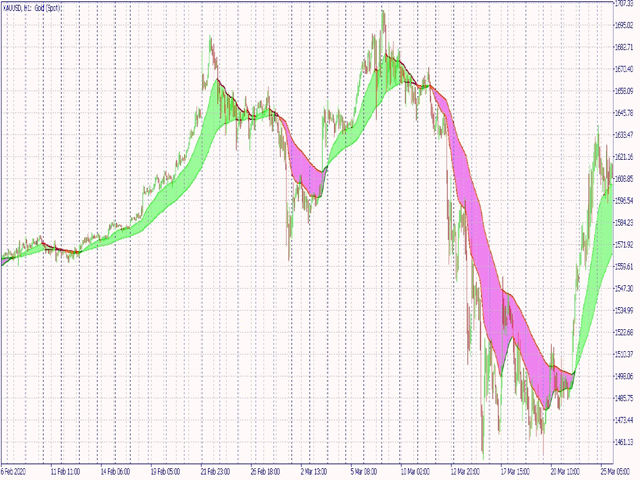
A double moving average indicator
- インディケータ
- Xiao Dong Feng
- バージョン: 1.0
https://www.mql5.com
A double moving average indicator
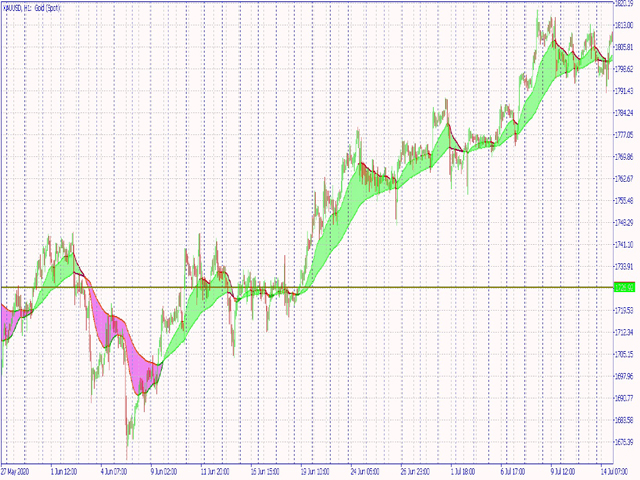
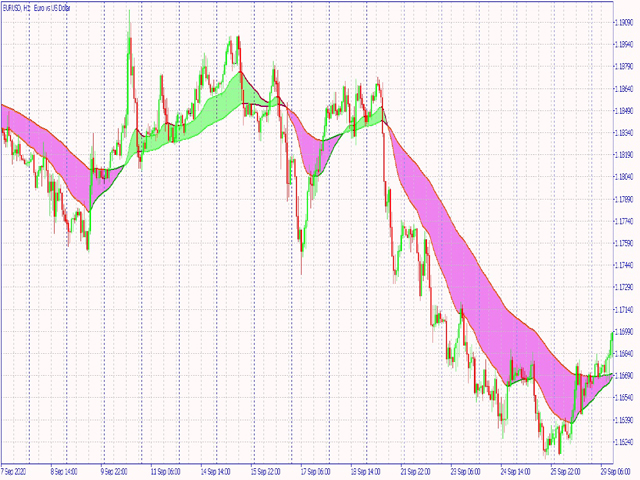
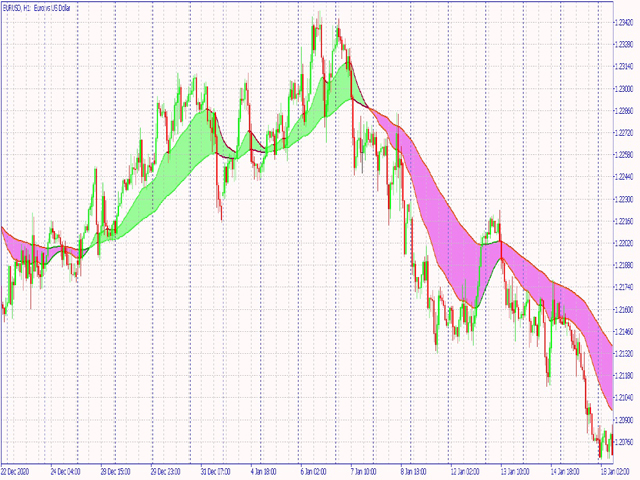
This indicator uses the system's own two different time period of moving average indicators to reflect the movement of market prices.
It is recommended that you use the default parameter Settings, which you can set according to your own experience to get the best predictive power.
I hope it can provide some help for your trading.


easy to use end helps me filter out signals good and bad, thank you