ADX Dashboard pro MT5
- インディケータ
- バージョン: 2.0
- アップデート済み: 21 11月 2024
- アクティベーション: 20

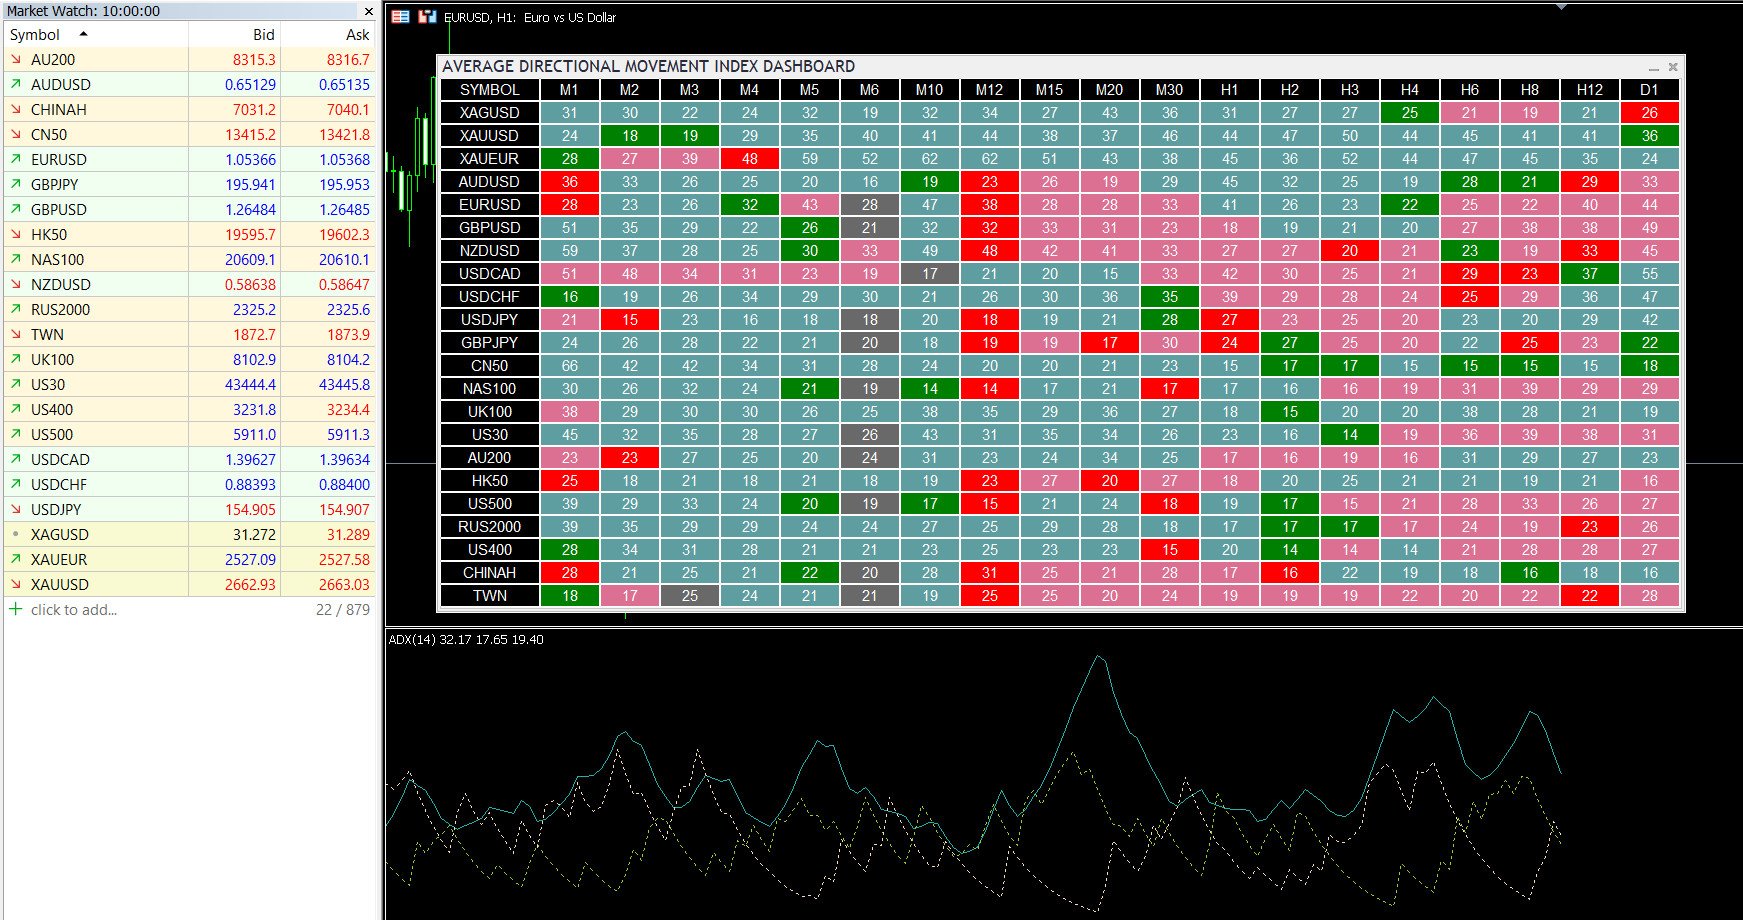
This is the ADX Dashboard MT5.
This dashboard will scan multiple timeframes in MT5 platform, from M1 chart to D1 chart.
It will send the buy/sell signals by alert on the platform or sending notification to your phone or message you via a email.
The buy signal is the cross over of DI+ and DI-
The sell signal is the cross under of DI+ and DI-.
The up trend color will be displayed when DI+ is greater than DI-
The down trend color will be displayed when DI+ is less than DI-
The value of ADX value will be displayed in each cell.