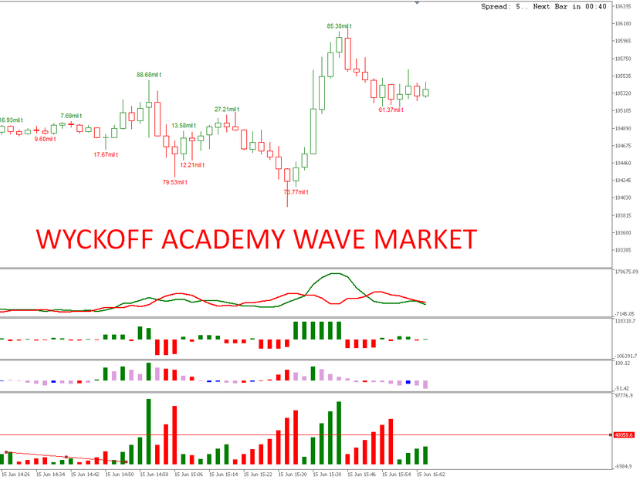
WAPV adh Supply and Demand Forex

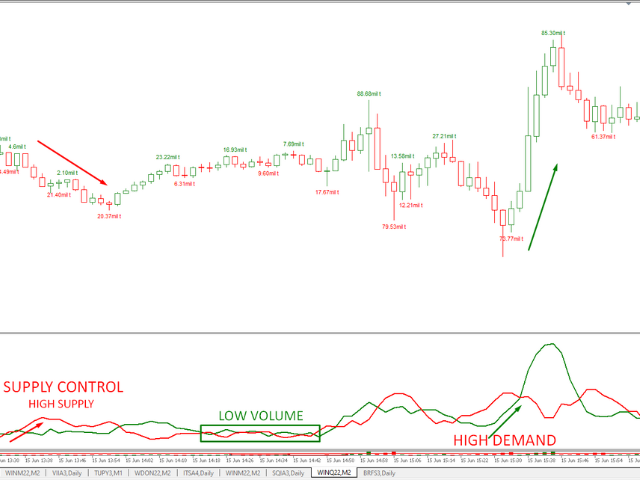
The WAPV ADH Supply and Demand Forex Indicator is part of a set of Indicators called (Wyckoff Academy Wave Market) The WAPV ADH Forex Supply and Demand Indicator for MT5 is intended to identify the winning side between buyers and sellers. Its reading is very simple, when the green line is above the red line demand is in command, when the red line is above the green line supply is in command. The more positive the green and red lines, the higher the volume input, the closer to zero or negative, the lower the volume input. Setting low demand and supply interest. * The indicator does not repaint and does not lag, it does everything in real time.


おすすめのプロダクト
インジケーター技術仕様 – Delta Profile for MetaTrader 5 Delta Profile は MetaTrader 5 用に開発されたインジケーターで、指定されたローソク足範囲内の出来高フローを詳細に分析するためのものです。異なる価格レベルにおける正の出来高(上昇に関連)と負の出来高(下降に関連)の不均衡を構造化し、可視化します。その結果、ユーザーは最も多くの取引が集中する価格帯や実際の市場不均衡が形成される領域を明確に把握できます。 以下に、本インジケーターの主要な技術特性と設定パラメータを示します。 基本コンセプト インジケーターは 価格レベル を識別し、それらを正の出来高、負の出来高、および純 Delta(正負の出来高差)に分類します。 各価格レベルは 水平バー としてチャートに表示され、市場の活動ゾーンや不均衡領域を視覚的に確認できます。 ユーザーは 分析対象ローソク足数 、 価格の丸め精度 、 最大表示レベル数 、および 表示スタイル を自由に設定できます。 主要機能 価格レベルのマッピング :設定された精度に基づき価格を丸め、対応するローソク足の
Overview The Market Perspective Structure Indicator is a comprehensive MetaTrader indicator designed to provide traders with a detailed analysis of market structure across multiple timeframes. It identifies and visualizes key price action elements, including swing highs and lows, Break of Structure (BOS), Change of Character (CHOCH), internal structures, equal highs/lows, premium/discount levels, previous levels from higher timeframes, and trading session zones. With extensive customization opt
WAPV Weis Wave Chart Forex
Eduardo Da Costa Custodio Santos
The Weis Wave Chart Forex for MT5 is a Price and Volume indicator. The Price and Volume reading was widely disseminated through Richard Demille Wyckoff based on the three laws created by him: Supply and Demand, Cause and Effect and Effort vs. Result. In 1900 R.Wyckoff already used the wave chart in his analyses. Many years later, around 1990, David Weis Automated R. Wyckoff's wave chart and today we bring you the evolution of David Weis' wave chart. It shows the amount of Volume and the amount o
Trend Zone Force
Joas Da Silva Veiga
5 (1)
トレンド, プルバック, トレンドインジケーター, ボラティリティ, atr, 移動平均, ema, モメンタム, オシレーター, オーダーフロー, デルタ, トレンドトレード, スキャルピング   機能 移動平均線を使用して主要なトレンドを識別します。 ボラティリティに基づいた動的なプルバックゾーンを描画します。 価格の方向性フロー(買い圧力・売り圧力)を表示します。 より正確な取引のために市場環境の把握を助けます。 私がこのインジケーターを実際に使う方法は次のとおりです。 価格が赤い点線(売りゾーン)の下で推移している場合、市場は下降トレンドで売りの勢いが強い状態です。売りゾーン付近、または売りゾーン内での売りエントリーを優先して探します。 価格が緑の点線(買いゾーン)の上で推移している場合、強い上昇トレンドを示しています。買いゾーン付近、または買いゾーン内での買いエントリーを探します。 トレンドの転換は通常、ゾーンがブレイクされたときに起こります。ただし、単なるブレイクでは不十分で、強いブレイクである必要があります。一般的に、5分足で明確にブレイクし、ゾー
ProEngulfingの無料バージョンは、1日あたり1つのシグナル制限と少ない機能を備えたQualifiedEngulfingです。 mql5コミュニティのKoala Trading Solutionチャンネルに参加して、Koala製品に関する最新情報を確認してください。参加リンクはこちら: https ://www .mql5 .com /en /channels /koalatradingsolution この製品のMT4バージョンは、以下のリンクからダウンロード可能です: https ://www .mql5 .com /en /market /product /52023 ProEngulfing – MT4向けのプロフェッショナルなエンガルフパターンインジケーターの紹介 ProEngulfingは、精密なエンガルフパターンを識別し、強調表示するために設計された最先端のインジケーターで、信頼性の高いシグナルを提供します。MetaTrader 4向けに開発され、取引の意思決定に役立ちます。 ProEngulfingの仕組み: ProEngulfingは、高度なアルゴリズムを使
KT Renko Patterns は、レンコチャートの各レンガをスキャンしながら、さまざまな金融市場でトレーダーによく使用されている有名なチャートパターンを検出します。 時間ベースのチャートと比較して、レンコチャートは視認性が高くシンプルなため、パターンベースのトレードがより簡単かつ明確になります。 KT Renko Patterns は複数のレンコパターンを搭載しており、その多くは Prashant Shah 氏の著書『Profitable Trading with Renko Charts』でも詳しく解説されています。 KT Renko Patterns インジケーターに基づいた 100% 自動化された EA は、こちらからご利用いただけます - KT Renko Patterns EA 。 機能一覧 最大8種類の明確なレンコパターンを表示し、あいまいさなく取引をサポートします。 完全な客観性を保つため、すべてのパターンにストップロスとフィボナッチターゲットが設定されています。 KT Renko Patterns は各パターンの精度を継続的に測定し、重要な統計情報をチャート
サポート線と抵抗線のプロットにうんざりしていませんか? サポートレジスタンス は、非常に興味深いひねりを加えてチャート内のサポートとレジスタンスラインを自動検出およびプロットするマルチタイムフレームインジケーターです。価格レベルは時間とともにテストされ、その重要性が高まるにつれて、ラインは太くなり、暗くなります。 [ インストールガイド | 更新ガイド | トラブルシューティング | よくある質問 | すべての製品 ] 一晩でテクニカル分析を強化 チャートを閲覧せずに重要な価格レベルを検出 一目ですべての価格レベルの相対的な強さを認識する すべての取引で最大30時間のプロットラインを節約 インジケーターは、すべての価格レベルの年齢を表示します インジケーターは再描画されていません 過去および現在の価格レベルは近接によって崩壊し、現在の市場行動に合わせて調整されます。動作は、必ずしもピークではない場所に線が引かれます。 価格レベルは、時間とともに拒否されるにつれて、より暗く、より広くなります ノイズを避けるために、重要でない価格レベルは定期的にクリアされます カスタマイズ可能な時間枠の
Are you tired of drawing Support & Resistance levels for all charts of the same Symbol while doing Multi-Timeframe analysis? Well, if you are Price Action trader then this indicator will solve your problem.  Draw on 1 Timeframe and it will auto-sync with other charts of the same Symbol. You can draw rectangles, lines, arrows, and eclipse. It will give an alert when touched/break on line and arrow. It work's on all Timeframe. Major Update Added:: 1}Triangle 2}Fibonacci Retracement 3}Text Lab
Supply and Demand Zones Indicator for MT5 Professional institutional-grade Supply and Demand zone detection with intelligent alerts WHAT IS IT? Supply and Demand Zones is a powerful MT5 indicator that automatically identifies high-probability institutional supply and demand zones on any chart. this professional indicator brings advanced zone detection to MetaTrader 5 with enhanced features. Unlike traditional support and resistance levels, this indicator detects actual institutional footprint
KT Pin Bar MT5
KEENBASE SOFTWARE SOLUTIONS
KT Pin Bar identifies the pin bar formation which is a type of price action pattern which depicts a sign of reversal or rejection of the trend. When combined with support and resistance, BRN and other significant levels, Pin Bar pattern proved to be a very strong sign of reversal. Basically, a pin bar is characterized by a small body relative to the bar length which is closed either in upper or lower 50% part of its length. They have very large wicks and small candle body. A pin bar candlestic
We at Minions Labs consider ATR ( Average True Range ) one of the most fantastic and most underrated indicators of Technical Analysis. Most of the traders really don't give a sh* about the True Range of the market and this probably can be because they could not apply the data right away in a practical way over their charts or over their own strategy, leaving this indicator in the land of obscurity and doubt. Well, this indicator, Bigger Than ATR , is a step forward to show you what is possible t
Support & Resistance indicator is a modification of the standard Bill Williams' Fractals indicator. The indicator works on any timeframes. It displays support and resistance levels on the chart and allows setting stop loss and take profit levels (you can check the exact value by putting the mouse cursor over the level). Blue dashed lines are support level. Red dashed lines are resistance levels. If you want, you can change the style and color of these lines. If the price approaches a support lev
After working during many months, with the help of Neural Networks, we have perfected the ultimate tool you are going to need for identifying key price levels (Supports and Resistances) and Supply and Demand zones. Perfectly suitable to trigger your trades, set up your future actions, decide your Take Profit and Stop Loss levels, and confirm the market direction. Price will always move between those levels, bouncing or breaking; from one zone to another, all the remaining movements are just mark
Smart Wave Trend Analyzer スマート波動トレンドアナライザー 波動分析とフラクタルパターンに基づいて、高品質のトレンドラインを自動的に識別して描画する高度なトレンド検出システムです。 MT4-version:  https://www.mql5.com/en/market/product/164395 主要コンポーネント: 1. メジャーライン(青/赤、太線) SMA(70)とLWMA(10)のクロスオーバーに基づく長期トレンド 価格変動における主要なピークとボトムを識別 青線 = レジスタンス(高値を結ぶ) 赤線 = サポート(安値を結ぶ) スイングトレードとポジショントレードに適している 2. マイナーライン(シアン/オレンジ、細線) SMA(21)とLWMA(4)のクロスオーバーに基づく短期トレンド 素早い市場の動きを捉える シアン線 = レジスタンス(高値を結ぶ) オレンジ線 = サポート(安値を結ぶ) デイトレードとスキャルピングに最適 3. フラクタルライン(緑/紫、中太線) 複数のフラクタルポイントを通るトレンドラインの自動検出 アルゴリズムが4
Harmonic patterns are characteristic series of price movements with respect to Fibonacci levels, which statistically precede price reversals. This indicator searches for harmonic patterns. It is capable of recognising 26 classical and non-classical harmonic patterns : Classical Gartley Butterfly Alternate Butterfly Bat Alternate Bat Crab Deep Crab Three Drives Non-classical Shark Alternate Shark Cypher 5-0 Anti Gartley Anti Butterfly Anti Alternate Butterfly Anti Bat Anti Alternate Bat Anti Crab
The Accumulation / Distribution is an indicator which was essentially designed to measure underlying supply and demand. It accomplishes this by trying to determine whether traders are actually accumulating (buying) or distributing (selling). This indicator should be more accurate than other default MT5 AD indicator for measuring buy/sell pressure by volume, identifying trend change through divergence and calculating Accumulation/Distribution (A/D) level. Application: - Buy/sell pressure: above
Indicator Name: Fibaction – price action candle Detector Description: Fibo Signal Boxes is a powerful Smart Money Concept (SMC)-inspired indicator that auto-detects price action candles. bullish hammers and shooting stars, then draws precise Fibonacci entry zones and multiple take-profit levels directly on the chart. as for the SL personally i use 40 pips rules  Key Features: Detects bullish hammer and shooting star reversal candles. Automatically draws Fibonacci entry and TP boxes. as
Supreme index
Wanderlei Alessandro Azevedo
Title:   Institutional Breakout PRO: Multi-Currency Engine Description: Unlock the power of volatility with the   Institutional Breakout PRO . Originally designed for US Indices, this algorithm has proven to be a   Universal Trading Engine , capable of extracting profits from major Forex pairs (EURUSD, GBPUSD), Commodities (Gold/XAUUSD), and Indices. The Strategy: The EA does not use lagging indicators. Instead, it utilizes a   Dynamic Box Logic . It identifies periods of market consolidat
Delta + CVD & CVD Candles Order-flow indicator combining Delta (Ask–Bid), Cumulative Volume Delta (CVD), and a unique CVD-based synthetic candle system. Shows buy/sell pressure, volume aggressiveness, and momentum shifts with optional Delta histogram, CVD line, and CVD+Delta combined candles. Useful for scalping, intraday trading, divergence detection, and understanding buyer/seller dominance. Overview The Delta + CVD & CVD Candles Indicator combines multiple order-flow tools into one clean
Support Resistance Catcher Indicator Features and Explanation Overview: The Support Resistance Catcher is a custom MT5 indicator designed to identify and visualize supply (resistance) and demand (support) zones based on candlestick price action. It detects zones where price has reversed after rallies or drops, using wick rejections and clustering. The indicator draws horizontal rectangles for active and historical zones, with customizable colors, labels, and alerts. Key Features: 1. Zone Det
The indicator helps the trader in identifying potential liquidity levels. The algorithm used in this indicator checks the behavior of the asset taking into account the price levels, momentum and volume analysis. Features:- Parameters for signal optimization and alerts. Usage:- The levels formed by the indicator can be helpful to traders in identifying potential entries, breakouts or reversals. it can assist traders of technical trading background or even pure price action trading.
Cumulative delta indicator As most traders believe, the price moves under the pressure of market buying or selling. When someone redeems an offer standing in the cup, the deal is a "buy". If someone pours into the bid standing in the cup - the deal goes with the direction of "sale". The delta is the difference between purchases and sales. A cumulative delta - the difference between the cumulative sum of purchases and sales for a certain period of time. It allows you to see who is currently contr
ドンチャン時間同期アナライザーは、 従来のドンチャンチャネル分析に強力な マルチタイムフレーム 分析機能を追加し、トレーダーは5つの異なるチャート期間にわたって トレンドの強さ と潜在的な 反転シグナル を同時に監視できます。この高度なインジケーターは、選択したタイムフレームにおける最高値と最低値を算出し、複数のタイムホライズンにおけるトレンドの方向の収束を特定するのに役立つ 明確な視覚的シグナル を生成します。分単位から時間単位までの統合分析を提供することで、単一タイムフレームツールよりも深い市場洞察を提供し、トレーダーが 重要なブレイクアウトを確認し 、タイムフレーム確認を通じて 偽シグナルを回避するのに 役立ちます。 コア機能 この洗練されたツールは、実績のある ドンチャンチャネル戦略を 複数の時間枠に同時に適用し、同期したシグナルをプロットすることで、短期的な価格変動が長期的なトレンドと一致しているかどうかを明らかにします。システムは、選択した時間枠において、価格が重要なサポートレベルまたはレジスタンスレベルを突破すると、別のインジケーターウィンドウに色分けされた矢印を生成し
これは、価格ラベル付きのAdvanced ZigZagDynamic および/または ExtendedFractals インジケーターの極値に基づくサポートおよびレジスタンスレベルのMTFインジケーターです(無効にすることができます)。 MTFモードでは、より高いTFを選択できます。デフォルトでは、レベルはZigZagインジケータードットに基づいて生成されます。フラクタルインジケータードットは、ZigZagと一緒に、またはその代わりに使用することもできます。使用を簡素化し、CPU時間を節約するために、計算はバーの開口部ごとに1回実行されます。 パラメーター: ForcedTF-レベル計算のチャート時間枠(現在の時間枠と等しいか、それを超える場合があります) MinPipsLevelWidth-ポイント単位の最小レベル幅(非常にタイトなレベルに使用) Use ZigZag Extremums points -ZigZagピークを使用してサポート/抵抗レベルを計算することを有効/無効にします Fixed pips range -ジグザグインジケーターを計算するための最小値と最大値の間の距離
これはほぼ間違いなく、MetaTraderプラットフォームで見つけることができる最も完全な調和価格形成自動認識インジケーターです。 19種類のパターンを検出し、フィボナッチプロジェクションをあなたと同じように真剣に受け止め、潜在的逆転ゾーン(PRZ)を表示し、適切なストップロスとテイクプロフィットレベルを見つけます。 [ インストールガイド | 更新ガイド | トラブルシューティング | よくある質問 | すべての製品 ] 19の異なる調和価格形成を検出します プライマリ、派生および補完フィボナッチ投影(PRZ)をプロットします 過去の価格行動を評価し、過去のすべてのパターンを表示します この指標は、独自の品質とパフォーマンスを分析します 適切なストップロスとテイクプロフィットのレベルを表示します ブレイクアウトを使用して適切な取引を通知します すべてのパターン比をグラフにプロットします 電子メール/音声/視覚アラートを実装します スコット・M・カーニーの本に着想を得て、この指標は最も純粋で急を要するトレーダーのニーズを満たすように設計されています。ただし、トレードを容易にする
Forex traders often observe increased market activity near Supply and Demand zones, which are levels formed based on zones where strong price movements have previously occurred. The Supply Demand Strong Weak Confirm Indicator utilizes fractals and the ATR indicator to identify and plot support and resistance zones on the price chart. These zones are categorized as follows: - Weak: significant high and low points in the trend. - Untested: crucial turning points in the price chart that the pric
"Impulses and Corrections 5" is created to help traders navigate the market situation. The indicator shows multi-time frame upward and downward "Impulses" of price movements. These impulses are the basis for determining the "Base" , which is composed of zones of corrections of price movements, as well as "Potential" zones for possible scenarios of price movement. Up and down impulses are determined based on a modified formula of Bill Williams' "Fractals" indicator. The last impulse is always "U
There are no limits! Golden Limit is the ultimate indicator to get clear and easy readings of price movements on charts. It projects support and resistance ranges, calculated by statistical models involving Price Action and the Fibonacci sequence, revealing in advance the behavior of prices and the best places to trade and not to trade. It also has two moving averages to help choose the best entries. The Golden Limit method was created from a proven model. In summary: We use the names of precio
The Hydra Multi Trend Dashboard is a powerful market scanning tool designed for MetaTrader 4 and MetaTrader 5. It monitors up to 25 currency pairs or assets simultaneously across all 9 standard timeframes (M1 to Monthly). Using a proprietary Special Trend Formula , the dashboard filters out market noise and provides clear, visual Bullish or Bearish signals, allowing traders to identify trend alignments at a glance without switching charts. Setup & Guide:  Download  MT4 Version here. Follow our
KT Double Top Bottom MT5
KEENBASE SOFTWARE SOLUTIONS
1 (1)
The double top bottom pattern is arguably one of the technical analysis's most popular chart patterns. These patterns are used to capitalize on recurring patterns and identify trend reversal patterns, thereby creating well-placed entry and exit levels. The KT Double Top Bottom is based on these patterns and fine-tunes the trade signal development process for traders. Features It's based on one of the most reliable trading patterns and brings some fine-tuning and automation to the process. Also
このプロダクトを購入した人は以下も購入しています
このインジケーターを購入すると、プロ仕様のトレードマネージャーを無料で差し上げます。 まず第一に、このトレーディングシステムがノンリペイント、ノンリドロー、ノンラグのインジケーターであることを強調する価値がある。これにより、手動取引とロボット取引の両方に理想的なものになっています。 オンラインコース、マニュアル、プリセットのダウンロード。 「スマートトレンドトレーディングシステム MT5」は、新規および経験豊富なトレーダー向けにカスタマイズされた包括的なトレーディングソリューションです。10以上のプレミアムインジケーターを組み合わせ、7つ以上の堅実なトレーディング戦略を備えており、多様な市場状況に対応する多目的な選択肢となっています。 トレンドフォロー戦略:トレンドを効果的に乗り越えるための正確なエントリーとストップロス管理を提供します。 リバーサル戦略:潜在的なトレンドの反転を特定し、トレーダーがレンジ相場を活用できるようにします。 スキャルピング戦略:高速で正確なデイトレードおよび短期取引のために設計されています。 安定性:すべてのインジケーターはノンリペイント、ノンリドロー、ノ
SuperScalp Pro — 高度なマルチフィルター対応スキャルピングインジケーターシステム SuperScalp Pro は、クラシックな Supertrend と複数のインテリジェントな確認フィルターを組み合わせた高度なスキャルピング用インジケーターシステムです。M1〜H4 のすべての時間足で効率的に機能し、特に XAUUSD、BTCUSD、および主要なFX通貨ペアに適しています。単体のシステムとして、また既存の取引戦略へ柔軟に統合して使用できます。 本インジケーターは 11 以上のフィルターを統合しており、短期・長期の EMA、トレンド判定に用いる 3 本の EMA、EMA スロープ(EMA slope)、RSI、ADX、出来高、VWAP、ボリンジャーバンドのブレイクアウト、MACD ダイバージェンスフィルターなどを含みます。スマートキャンドルフィルターはローソク足の終値を確認して弱いシグナルを排除し、3 本の EMA と MACD ダイバージェンスを組み合わせたトレンド認識メカニズムにより勝率の高いシグナルの選別を支援します。 SuperScalp Pro は ATR に基
このインジケーターを購入された方には、以下の特典を 無料 で提供しています: 各トレードを自動で管理し、ストップロスとテイクプロフィットを設定し、戦略ルールに基づいてポジションを決済する補助ツール 「Bomber Utility」 様々な銘柄に合わせたインジケーターの設定ファイル(セットファイル) 「最小リスク」、「バランスリスク」、「待機戦略」 の3つのモードで使用できる Bomber Utility 用の設定ファイル このトレーディング戦略をすぐに導入・設定・開始できる ステップバイステップのビデオマニュアル ご注意: 上記の特典を受け取るには、MQL5のプライベートメッセージシステムを通じて販売者にご連絡ください。 オリジナルのカスタムインジケーター 「Divergence Bomber(ダイバージェンス・ボンバー)」 をご紹介します。これは、MACDのダイバージェンス(乖離)戦略に基づいた 「オールインワン」型のトレーディングシステム です。 このテクニカルインジケーターの主な目的は、価格とMACDインジケーターの間に発生するダイバージェンスを検出 し、将来の価格の動きを示す
ARIPoint is a powerful trading companion designed to generate high-probability entry signals with dynamic TP/SL/DP levels based on volatility. Built-in performance tracking shows win/loss stats, PP1/PP2 hits, and success rates all updated live. Key Features: Buy/Sell signals with adaptive volatility bands Real-time TP/SL/DP levels based on ATR Built-in MA Filter with optional ATR/StdDev volatility Performance stats panel (Success, Profit/Loss, PP1/PP2) Alerts via popup, sound, push, or email Cu
FX Trend NG:次世代マルチマーケット・トレンドインテリジェンス 概要 FX Trend NG は、複数の時間足に対応したプロフェッショナル向けトレンド分析およびマーケット監視ツールです。 市場全体の構造を数秒で把握することができます。 複数のチャートを切り替える必要はありません。どの銘柄がトレンド中なのか、どこでモメンタムが弱まっているのか、そしてどの時間足で強い整合性があるのかを瞬時に確認できます。 ローンチ特別オファー – FX Trend NG を $30(6ヶ月) または $80 永久ライセンス でご利用いただけます。 すでに Stein Investments のユーザーですか? -> メッセージを送信 して、プライベートグループへアクセスしてください。 セットアップや詳細情報が必要ですか? -> Stein Investments 公式ページ をご覧ください。 1. FX Trend NG が他と異なる理由 3ステート・トレンドロジック ― Buy と Sell だけではない • 多くのインジケーターは Buy または Sell の2状態のみを表示します。
Entry In The Zone and SMC Multi Timeframe is a real-time market analysis tool developed based on Smart Money Concepts (SMC). It is designed to analyze market structure, price direction, reversal points, and key zones across multiple timeframes in a systematic way. The system displays Points of Interest (POI) and real-time No Repaint signals, with instant alerts when price reaches key zones or when signals occur within those zones. It functions as both an Indicator and a Signal System (2-in-1), c
Game Changerは、あらゆる金融商品で使用できる革新的なトレンドインジケーターです。MetaTraderを強力なトレンドアナライザーへと変貌させます。あらゆる時間枠で動作し、トレンドの特定、反転の可能性のシグナル、トレーリングストップ機能、そして迅速な市場反応のためのリアルタイムアラートを提供します。経験豊富なプロでも、優位性を求める初心者でも、このツールは自信と規律、そして根本的なトレンドダイナミクスを明確に理解した上で取引を行うための力となります。このインジケーターはリドロー機能も備えています。 購入後すぐにご連絡いただければ、個人ボーナスを進呈いたします。Strong SupportとTrend Scannerインジケーターの無料コピーを入手できます。[email protected]までプライベートメッセージを送ってください。 私のEAや特別なセットはTelegramでは販売しておりません。MQL5でのみ販売しており、セットファイルは私のブログでのみ公開しています。詐欺師にはご注意ください。他の方からセットを購入しないでください。 設定 トレンド変化時のアラート
Power Candles – あらゆる市場に対応した強度ベースのエントリーシグナル Power Candles は、Stein Investments が長年培ってきた強度分析を価格チャート上に直接反映します。価格だけに反応するのではなく、各ローソク足は実際の市場の強さに基づいて色分けされ、モメンタムの蓄積、強度の加速、明確なトレンド転換を瞬時に把握できます。 すべての市場に共通する単一ロジック Power Candles は すべての取引シンボル で自動的に動作します。現在のシンボルが Forex か非 Forex 市場かを自動判別し、内部で適切な強度モデルを適用します。 Forex および Gold :FX Power のデルタ値を使用(絶対値レンジ最大 100) 指数、暗号資産、CFD :IX Power の強度値を使用(絶対値レンジ最大 50) 必要な強度計算は Power Candles に直接組み込まれています。ローソク足のカラーリングやシグナルロジックに、追加のインジケーターは不要です。 価格ノイズではなく「強度状態」 各ローソク足は、以下の 9 つの明確に定義された強
Azimuth Pro
Ottaviano De Cicco
5 (4)
発売プロモーション Azimuth Proは先着100名様限定で 299ドル でご提供します。最終価格は 499ドル となります。 リテールとインスティテューショナルのエントリーの違いはインジケーターではなく、ロケーションにあります。 多くのトレーダーは、モメンタムを追いかけたり、遅行シグナルに反応して、任意の価格レベルでエントリーします。機関投資家は、需給が実際にシフトする構造的なレベルに価格が到達するのを待ちます。 Azimuth Proはこれらのレベルを自動的にマッピングします:スイングアンカーVWAP、マルチタイムフレーム構造ライン、高確率ロケーションにのみ出現するABCパターン。 Azimuth Proは、構造分析とインテリジェントな自動化の両方を求めるプロフェッショナルトレーダー向けに構築されています。 Azimuthが外科的精度で市場構造をマッピングする一方、Azimuth Proはインテリジェンスレイヤーを追加します:トレーディングスタイルの自動検出、スマート設定された移動平均線、20年のデータでバックテストされた最適化パラメータ。その結果、お使いの銘柄と
Smart Stop Indicator – チャート上で実現するインテリジェントなストップロス精度 概要 Smart Stop Indicator は、ストップロスを勘や感情ではなく、明確で体系的に設定したいトレーダーのために設計されています。本ツールは、クラシックなプライスアクション(高値更新・安値切り下げ)と最新のブレイクアウト認識ロジックを組み合わせ、次に来るべき論理的なストップレベルを正確に特定します。トレンド相場、レンジ、急速なブレイクアウト局面のいずれであっても、最適な SL ゾーンとその状態(“new”、“broken”、“valid”)をチャート上に直接表示します。さらに今回、SL 距離の %ADR 表示も新たに追加されています。 主な特徴 マーケット構造に基づく自動ストップ配置 • 市場構造とリアルタイムの値動きに基づき、意味のあるストップロスレベルを自動検出します。 スマートなブレイクアウト感知 • 急激な方向転換やブレイクアウトにも柔軟に対応し、早すぎるストップ調整を避けます。 SL %ADR の表示 • ストップロスまでの距離を ADR(Averag
FX Power: 通貨の強弱を分析して、より賢い取引を実現 概要 FX Power は主要通貨と金の実際の強弱をあらゆる市場状況で理解するための必須ツールです。強い通貨を買い、弱い通貨を売ることで、 FX Power は取引の意思決定を簡素化し、高い確率の取引機会を見出します。トレンドを追従する場合でも、極端なデルタ値を使用して反転を予測する場合でも、このツールはあなたの取引スタイルに完全に適応します。ただ取引するだけではなく、 FX Power で賢く取引をしましょう。 1. なぜ FX Power がトレーダーにとって非常に有益なのか 通貨と金のリアルタイム強弱分析 • FX Power は主要通貨と金の相対的な強弱を計算し、マーケットダイナミクスに関する明確な洞察を提供します。 • どの資産がリードしているか、または後れを取っているかを監視して、取引するペアを賢く選びましょう。 マルチタイムフレームの包括的なビュー • 短期、中期、長期のタイムフレームで通貨と金の強弱を追跡し、マーケットトレンドに基づいて取引戦略を調整できます。 • スキャルピングからスイングトレード
まず第一に、この取引インジケーターは再描画されず、再描画されず、遅延しないことを強調する価値があります。これにより、手動取引とロボット取引の両方に理想的なものになります。 ユーザーマニュアル:設定、入力、戦略。 アトミックアナリストは、価格の強さとモメンタムを利用して市場でより良いエッジを見つけるためのPA価格アクションインジケーターです。ノイズや誤ったシグナルを除去し、取引ポテンシャルを高めるための高度なフィルターを備えています。複雑なインジケーターの複数のレイヤーを使用して、アトミックアナリストはチャートをスキャンし、複雑な数学的計算をシンプルなシグナルと色に変換します。これにより、どのような初心者トレーダーでも理解して使用し、一貫した取引の決定を行うことができます。 「アトミックアナリスト」は、新規および経験豊富なトレーダー向けにカスタマイズされた包括的な取引ソリューションです。プレミアムインジケーターとトップノッチの機能を1つの取引戦略に組み合わせ、すべてのタイプのトレーダーにとって汎用性のある選択肢にします。 デイリートレーディングとスキャルピング戦略:高速で正確なデイ
トレンド スクリーナー インジケーターでトレンド取引の力を解き放ちます。ファジー ロジックと複数通貨システムを活用した究極のトレンド取引ソリューションです。 ファジー ロジックを活用した革新的なトレンド インジケーターである Trend Screener を使用して、トレンド取引を向上させます。 これは、13 を超えるプレミアム ツールと機能、および 3 つの取引戦略を組み合わせた強力なトレンド追跡インジケーターであり、Metatrader をトレンド アナライザーにする多用途の選択肢となります。 期間限定オファー : トレンド スクリーナー インジケーターは、わずか 100 ドルで生涯ご利用いただけます。 (元の価格 50$ ) (オファー延長) Trend Screener の 100% 非再描画精度の揺るぎない精度を体験して、取引の決定が過去の価格変動の影響を受けないようにしてください。 マルチタイムフレームおよびマルチ通貨機能の多用途性を解放し、比類のない自信を持って外国為替、商品、暗号通貨、インデックスの世界を取引できるようにします。 Trend Screener の包括的な
これはMT5のインジケーターで、再描画なしで取引に参入するための正確なシグナルを提供します。 外国為替、暗号通貨、金属、株式、インデックスなど、あらゆる金融資産に適用できます。かなり正確な見積もりを提供し、取引を開始して終了するのに最適な時期を教えてくれます。1つのシグナルを処理しただけでインジケーターの元が取れた例の 動画 (6:22)をご覧ください。Entry PointsPro インジケーターの助けを借りたほとんどのトレーダーの最初の1週間の結果が改善しています。 Telegramグループ に登録してください。Entry Points Proインジケーターのメリットは次の通りです。 再描画のないエントリーシグナル 再描画されるインジケーターでは一度表示されたシグナルが削除されて大きな金銭的損失につながることがありますが、これと異なり、表示されて確認されたシグナルは消えることがありません。 エラーなしの取引開始 インジケーターアルゴリズムによって取引を開始する(資産を売買する)理想的な瞬間を見つけることができます。それを使用するすべてのトレーダーの成功率が向上します。 あら
優れたテクニカルインジケーター「Grabber」をご紹介します。これは、すぐに使える「オールインワン」トレーディング戦略として機能します。 ひとつのコードに、市場のテクニカル分析ツール、取引シグナル(矢印)、アラート機能、プッシュ通知が強力に統合されています。 このインジケーターを購入された方には、以下の特典を無料で提供します: Grabberユーティリティ:オープンポジションを自動で管理するツール ステップバイステップのビデオマニュアル:インジケーターのインストール、設定、取引方法を解説 カスタムセットファイル:インジケーターをすばやく自動設定し、最大限の成果を出すための設定ファイル 他の戦略はもう忘れてください!Grabberだけが、あなたを新たなトレードの高みへと導いてくれるのです。 Grabber戦略の主な特徴: 推奨タイムフレーム:M5〜H4 対応通貨ペア・資産:どれでも使用可能ですが、私が実際に検証した以下を推奨します(GBPUSD、GBPCAD、GBPCHF、AUDCAD、AUDUSD、AUDSGD、AUDCHF、NZDUSD、NZDCAD、EURCAD、EURUSD、E
まず第一に、この取引ツールはノンリペイント、ノンリドロー、ノンラグの指標であり、プロの取引に理想的ですことを強調する価値があります。 オンラインコース、ユーザーマニュアル、デモ。 スマートプライスアクションコンセプトインジケーターは、新米から経験豊富なトレーダーまで、非常 に強力なツールです。Inner Circle Trader AnalysisやSmart Money Concepts Trading Strategiesなど、20以上の有用な指標を1つに組み合わせています。このインジケーターはスマートマネーコンセプトに焦点を当て、大手機関の取引方法を提供し、彼らの動きを予測するのに役立ちます。 特に、流動性分析に優れており、機関がどのように取引しているかを理解しやすくしています。市場のトレンドを予測し、価格の動きを慎重に分析するのに優れています。機関の戦略とトレードを合わせることで、市場の動向についてより正確な予測ができます。このインジケーターは多目的であり、市場構造を分析し、重要な注文ブロックを特定し、さまざまなパターンを認識するのに優れています。 このインジケーター
Quantum TrendPulse を ご紹介します。これは、   SuperTrend   、   RSI   、および Stochastic のパワーを 1 つの包括的なインジケーターに組み合わせて、取引の可能性を最大限に引き出す究極の取引ツールです。精度と効率を求めるトレーダー向けに設計されたこのインジケーターは、市場のトレンド、勢いの変化、最適なエントリー ポイントとエグジット ポイントを自信を持って特定するのに役立ちます。 主な特徴: SuperTrend 統合: 現在の市場動向に簡単に追従し、収益性の波に乗ることができます。 RSI精度: 買われすぎと売られすぎのレベルを検出し、市場の反転のタイミングに最適で、SuperTrendのフィルターとして使用されます。 確率的精度: 確率的振動を活用して、変動の激しい市場で隠れたチャンスを見つけます。SuperTrend のフィルターとして使用されます。 マルチタイムフレーム分析:   M5 から H1 または H4 まで、さまざまなタイムフレームで市場を常に把握します。 カスタマイズ可能なアラート: カスタム取引条件が満たされ
毎日、多くのトレーダーが共通の課題に直面しています。価格が重要なレベルを突破したように見えてトレードに参入すると、市場が反転してストップロスが発動されるという状況です。これはダマシ(フォールスブレイクアウト)と呼ばれ、価格がサポートまたはレジスタンスレベルを一時的に超えた後、方向を反転させる動きです。これらの動きにより、実際の価格方向が明確になる前にストップロスが発動される可能性があります。 テクニカル分析では、この現象は一般的に「流動性スイープ」(liquidity sweep)または「ストップ狩り」(stop hunt)と呼ばれています。 Mirage Trading Systemは、ダマシパターンを検出するために設計されたインジケーターです。「Mirage」(蜃気楼)という名前は、市場で頻繁に発生する欺瞞的な価格変動という幻想を指しています。 ダマシは多くのトレーダーを不意打ちにする可能性がありますが、Mirage Trading Systemはこれらのパターンがいつ形成されるかを識別し、その後の価格変動の潜在的な方向を示すように設計されています。 ローンチ期間パッケージ ローン
Pointer Trend Switch — precision trend reversal indicator Pointer Trend Switch is a high-precision arrow indicator designed to detect key moments of trend reversal based on asymmetric price behavior within a selected range of bars. It identifies localized price impulses by analyzing how far price deviates from the opening level, helping traders find accurate entry points before a trend visibly shifts. This indicator is ideal for scalping, intraday strategies, and swing trading, and performs equa
Trend Ai indicatorは、トレンドの識別と実用的なエントリポイントと反転アラートを組み合わせることで、トレーダーの市場分析を強化する優れたツールです。 この指標は、ユーザーが自信と正確さで外国為替市場の複雑さをナビゲートすることを可能にします トレンドAiインジケーターは、主要なシグナル以外にも、プルバックやリトレースメント中に発生するセカンダリエントリポイントを識別し、トレーダーが確立されたトレンド内の価格修正を活用できるようにします。 重要な利点: *MT4およびMT5の仕事 *明確な買いまたは売りシグナル *再描画しません ·すべての資産で動作します 私はeaやセットをtelegram it詐欺で販売しないように注意してください。 すべての設定はここでブログで無料です。  重要! 指示とボーナスを得るために購入後すぐに私に連絡してください! 私の他のプロダクトと同様、実質操作の監視はここに見つけることができます: https://www.mql5.com/en/users/mechanic/seller&nbsp ; 設定および入力: すべての
Crystal Heikin Ashi Signals - Professional Trend & Signal Detection Indicator Advanced Heikin Ashi Visualization with Intelligent Signal System for Manual & Automated Trading Final Price: $149 ---------> Price goes up $10 after every 10 sales . Limited slots available — act fast . Overview Crystal Heikin Ashi Signals is a professional-grade MetaTrader 5 indicator that combines pure Heikin Ashi candle visualization with an advanced momentum-shift detection system. Designed for both manual traders
ATrend
Zaha Feiz
4.82 (17)
ATrend: その仕組みと使い方 仕組み MT5プラットフォーム向けの「ATREND」インジケーターは、テクニカル分析手法の組み合わせを利用して、トレーダーに堅牢な買いと売りのシグナルを提供するように設計されています。このインジケーターは主に、ボラティリティ測定のために平均真の範囲(ATR)を活用し、潜在的な市場動向を特定するためのトレンド検出アルゴリズムを併用しています。 購入後にメッセージを残すと、特別なボーナスギフトが贈呈されます。 主な特徴: - ダイナミックなトレンド検出: インジケーターは市場トレンドを評価し、シグナルを適宜調整することで、トレーダーが優位な市場環境に合わせて戦略を立てるのを支援します。     - ボラティリティ測定: ATRを使用することで、インジケーターは最適なストップロス(SL)とテイクプロフィット(TP)レベルを決定するために不可欠な市場ボラティリティを測定します。 - シグナルの視覚化: インジケーターは、チャート上に買いと売りのシグナルを視覚的に表示することで、トレーダーの意思決定を強化します。 操作手順 入力とセッティング - TimeF
ご紹介     Quantum Breakout PRO は 、ブレイクアウト ゾーンの取引方法を変革する画期的な MQL5 インジケーターです。 13年以上の取引経験を持つ経験豊富なトレーダーのチームによって開発されました。     クォンタム ブレイクアウト プロ   は、革新的でダイナミックなブレイクアウト ゾーン戦略により、あなたのトレーディングの旅を新たな高みに押し上げるように設計されています。 クォンタム ブレイクアウト インジケーターは、5 つの利益ターゲット ゾーンを備えたブレイクアウト ゾーン上のシグナル矢印と、ブレイクアウト ボックスに基づいたストップロスの提案を提供します。 初心者トレーダーにもプロのトレーダーにも適しています。 量子EAチャネル:       ここをクリック 重要!購入後、インストールマニュアルを受け取るためにプライベートメッセージを送ってください。 推奨事項: 時間枠: M15 通貨ペア: GBPJPY、EURJPY、USDJPY、NZDUSD、XAUUSD アカウントの種類: ECN、Raw、またはスプレッドが非常に低い R
このインジケーターは、市場で 関心が示されたゾーン をハイライトし、その後に 注文の蓄積ゾーン を表示します。 これは、大規模な**板情報(オーダーブック)**のように機能します。 これは、 巨大な資金 のためのインジケーターです。その性能は卓越しています。 市場にどんな関心が存在していても、 必ず目に見えるようになります 。 (これは 完全に再設計され、自動化されたバージョン です。もはや手動分析は必要ありません。) トランザクションスピード(取引速度) は新しい概念のインジケーターで、市場で大口注文が どこに・いつ 集中しているかを示し、それに基づいたチャンスを提供します。 トレンドの変化を 非常に早い段階 で察知することができます。 FXでは「出来高」と呼ばれているものは誤解されています。実際には、これは 時間あたりの価格変動量 です。したがって、正しい名称は トランザクションスピード です。 考え方・行動・分析の仕方すべてが問われます。 分析パラダイムの転換は非常に重要です。 このインジケーターは、FXにおける出来高の考え方を 根本から再定義 し、論理的な形で正確に活用する、
note: this indicator is for METATRADER4, if you want the version for METATRADER5 this is the link:  https://www.mql5.com/it/market/product/108106 TRENDMAESTRO ver 2.5 TRENDMAESTRO recognizes a new TREND from the start, he never makes mistakes. The certainty of identifying a new TREND is priceless. DESCRIPTION TRENDMAESTRO identifies a new TREND in the bud, this indicator examines the volatility, volumes and momentum to identify the moment in which there is an explosion of one or more of these da
トレンドラインプロ   市場の真の方向転換点を理解するのに役立ちます。この指標は、真のトレンド反転と主要プレーヤーが再び参入するポイントを示します。 分かりますか     BOSライン   複雑な設定や不要なノイズなしに、より長い時間足でのトレンドの変化と重要なレベルを把握できます。シグナルは再描画されず、バーが閉じた後もチャート上に残ります。 MT4バージョン   -   RFI LEVELS PRO インジケーター と組み合わせることで、その最大限の能力を発揮します インジケーターが示す内容: 本当の変化   トレンド(BOSライン) 一度シグナルが現れたら、それは有効です!これは、リペイント機能を持つインジケーターとの重要な違いです。リペイント機能を持つインジケーターは、シグナルを発した後、それを変更し、資金の損失につながる可能性があります。これにより、より高い確率と精度で市場に参入できます。また、矢印が現れた後、目標値(利益確定)に達するか、反転シグナルが現れるまで、ローソク足の色を変更する機能もあります。 繰り返しエントリ   主要プレーヤーの補充 エントリーポイントを探す
Stratos Pali Indicator is a revolutionary tool designed to enhance your trading strategy by accurately identifying market trends. This sophisticated indicator uses a unique algorithm to generate a complete histogram, which records when the trend is Long or Short. When a trend reversal occurs, an arrow appears, indicating the new direction of the trend. Important Information Revealed Leave a review and contact me via mql5 message to receive My Top 5 set files for Stratos Pali at no cost ! Down
スイングトレーディング は、トレンドの方向のスイングと可能な反転スイングを検出するように設計された最初のインジケーターです。トレーディングの文献で広く説明されているベースラインスイングトレーディングアプローチを使用します。インディケータは、いくつかの価格と時間のベクトルを調査して、全体的なトレンドの方向を追跡し、市場が売られ過ぎまたは買われ過ぎて修正の準備ができている状況を検出します。 [ インストールガイド | 更新ガイド | トラブルシューティング | よくある質問 | すべての製品 ] むち打ちを起こさずに市場スイングの利益 インジケーターは常にトレンドの方向を表示します 色付きの価格帯は機会のベースラインを表します 色付きのダッシュは、可能な反転スイングを表します この指標は、独自の品質とパフォーマンスを分析します 複数時間枠のダッシュボードを実装します カスタマイズ可能なトレンドおよびスイング期間 電子メール/サウンド/プッシュアラートを実装します インジケータは再描画またはバックペインティングではありません Swing Tradingとは Swing Tradingは
Candle Smart Range
Gianny Alexander Lugo Sanchez
MetaTrader 5用 Candle Smart Range (CSR) Candle Smart Rangeは、複数のタイムフレームで価格レンジを自動的に識別するためのテクニカル指標です。このツールは、ローソク足の形成と、以前の高値・安値との相互作用に基づいて市場構造を分析します。 主な機能: レンジ検出: 勢いのある動きの前のコンソリデーション(保ち合い)ゾーンを特定します。 だまし(フェイクアウト)の識別: 価格が以前の水準を超えたものの、ローソク足の終値基準でレンジ内に戻った場合をマークします。 マルチタイムフレーム分析: カスタム期間を含む最大19のタイムフレームのデータを1つのチャートに表示します。 内部可視化(ズーム): チャートを切り替えずに、上位足のローソク足内部の値動きを確認できます。 時間フィルター: 主要な市場セッションなど、特定の時間帯で動作するように設定可能です。 履歴確認モード: 過去のデータをステップバイステップで確認し、分析できます。 アラート機能: ローソク足の確定や新しいレンジの検出を通知します。 インターフェース: 視覚的な負荷を管理する画面
RelicusRoad Pro: 定量的市場オペレーティングシステム 【期間限定】無制限アクセス 70% OFF - 2,000人超のトレーダーと共に なぜ多くのトレーダーは「完璧な」インジケーターを使っても失敗するのでしょうか? それは、文脈を無視して 単一の概念 だけでトレードしているからです。文脈のないシグナルは単なるギャンブルです。勝ち続けるには、 根拠の重なり(コンフルエンス) が必要です。 RelicusRoad Proは単なる矢印インジケーターではありません。完全な 定量的市場エコシステム です。独自のボラティリティモデリングを用いて、価格が推移する「適正価値の道(Fair Value Road)」をマッピングし、ノイズと真の構造的ブレイクを判別します。 推測はやめましょう。機関投資家レベルの「ロード・ロジック」でトレードを。 コアエンジン:「Road」アルゴリズム システムの中心となる Road Algo は、市場環境にリアルタイムで適応するダイナミックなボラティリティチャネルです。 安全ライン(平衡点) と、価格が数学的に反転しやすい 拡張レベル を投影します。 Si
作者のその他のプロダクト
Z Score Plus MT5
Eduardo Da Costa Custodio Santos
In finance, Z Scores are measures of the variability of an observation and can be used by traders to help determine market volatility. Z scores tell Traders whether a score is typical for a specified dataset or is atypical. Z scores also enable analysts to adapt scores from multiple datasets to make scores that can be more accurately compared to each other. # In practice, we have the ZScore with zero point and oscillations between 2 and 3 for ultra high high points and oscillations between -2 an
Trend Everest
Eduardo Da Costa Custodio Santos
Trend Everest MT5 indicator is a trend following indicator that aids in decision making. It is based on the calculation of ATR that assist and the average hull. A key issue is that the Trend Everest MT5 nominee does not repaint, so you can backtest with greater confidence. When it is Green, UpTrend When it is a Red downtrend. Not that the Market is fractal, so the longer the graphic time, the greater its degree of assertiveness.
HLC bar MT5 Wyckoff
Eduardo Da Costa Custodio Santos
MT5のインジケーター「HLC_bar_MT5Wyckoff」は、取引時の分析を容易にするために作成されました。 HLCバーはRichardWyckoffによって使用され、現在「VSA」操作で広く使用されています。 Wyckoffは、High、Low、およびCloseを使用すると、グラフがはるかにクリーンになり、分析が容易になることを発見しました。 区分 "HLC_bar_MT5 Wyckoff"により、以下が可能になります。 #バーの幅を変更します。 #バーを同じ色のままにします。 #そして、同じ価格で開閉したバーを強調表示します。 色と幅は設定で簡単に変更できます インジケーターを使用するには、インジケーターをチャートにドラッグするだけです。
Segmented Volume MT5
Eduardo Da Costa Custodio Santos
MT5セグメント化ボリュームインジケーターは、価格とボリュームの分析、VSA、VPA、ワイコフメソッド、スマートマネーシステムを使用して取引する人を容易にするために作成されました。 セグメント化されたボリュームは、任意の市場(暗号、CFD、外国為替、先物、株式など)で機能し、任意のチャート時間で機能します。 解釈がいかに簡単かをご覧ください。 #緑:市場平均よりもはるかに多いボリューム #濃いピンク:平均よりも大きいボリューム #青:正の通常の音量 #赤:マイナスの通常の音量 #ピンク:少量 #黄色:超少量 MT5セグメント化ボリュームインジケーターは、ティックボリュームまたはリアルボリュームで使用できます。 それはあなたの意思決定を容易にするスマートマネーの動きを読むのに役立ちます。
VSA Smart Money
Eduardo Da Costa Custodio Santos
The VSA Smart Money indicator tracks the movement of professional traders, institutional trades and all compound man movements. The VSA Smart money Indicator reads bar by bar, being an excellent tool for those who use VSA, Wyckoff, PVA and Any other analysis that uses price and volume. There are 10 indications that you will find in your Chart: *On Demand *Climax *UT Thrust *Top Reversal bar *Stop Volume *No Supply *Spring *Reversal Bottom *Shakeout *Bag Holding Using this indicator you will be o
Jac Trend
Eduardo Da Costa Custodio Santos
The JAC Trend Indicator for MT5 was created to facilitate the identification of the market trend in an easy and agile way. # When JAC Trend indicator is green , we have a pre-trend to uptrend market. # When JAC Trend indicator is Red we have a pre-trend to downtrend market. # When JAC Trend indicator is gray , we have a sideways market without strength. That way you have all the sides that the Market can go to in a clear and objective way.
JAC Trend Color Candle
Eduardo Da Costa Custodio Santos
The indicator "JAC Trend Color Candle" for Meta Trader 5, was created to visually facilitate the trend for the trader. It is based on three parameters, which identifies the uptrend, downtrend and non-trending market. The colors are trader-configurable, and the average trader-configurable as well. trend parameters cannot be configured as they are the indicator's differential.
WAPV Box Effort x Result
Eduardo Da Costa Custodio Santos
MT5のWA_PV_BOX_EFFORTXRESULT WAPV Box Effort x Result Indicatorは、Package Indicatorsグループ(Wyckoff Academy Wave Market)の一部です。 MT5のWAPVボックスエフォートx結果インジケーターは、価格とボリュームを読み取るのに役立ちます。その読みは、努力×結果の特定を支援することで構成されています グラフによって作成された波で。 ボックスが緑色の場合のMT5のWAPVボックスの労力x結果インジケーターは、ボリュームが需要に有利であり、ボックスが赤色の場合を意味します ボリュームは供給に有利です。 ボックスが大きいほど、価格に対するボリュームの変位が大きくなります。価格の上昇波がボックスのサイズに比例しない場合、 努力×結果。 非常に視覚的な方法で、ボリュームと価格の間のこの相違を識別できます。 MT5のWAPVBoxEffort x Result Indicatorを使用すると、インジケーターをゼロ軸の下に配置することで、視覚化を向上させることもできます。 ティックボリュームとリア
Wapv Price and volume
Eduardo Da Costa Custodio Santos
MT5のWAPV価格と出来高インジケーターは、(Wyckoff Academy Wave Market)および(Wyckoff Academy Price and Volume)ツールセットの一部です。 MT5のWAPV価格および出来高インジケーターは、チャート上の出来高の動きを直感的な方法で簡単に視覚化できるように作成されました。 それを使用すると、ピークボリュームの瞬間と市場が専門家の関心を持たない瞬間を観察することができます 「スマートマネー」の動きではなく、慣性によって市場が動いている瞬間を特定します。 ユーザーが変更できる4色で構成されています。 赤=オファーの増加 緑=需要の増加 灰色のキャンドル=需要と供給の減少 青=スマートマネー演技 上方向への動きは強さを示します。 下向きの動き弱さを示します。 価格の方向に関係なく、最強のボリュームが上がる必要があります。 R.Wyckoffの理論に基づいて作成されたインジケーター
Weis Wave Double Side
Eduardo Da Costa Custodio Santos
The Weis Wave Bouble Side Indicator for MT5 is part of the toolkit (Wyckoff Academy Wave Market) The Weis Wave Bouble side Indicator for MT5 was created based on the already established Weis Wave created by David Weis. The Weis Wave Double Side indicator reads the market in waves as it was done by R. Wyckoff in 1900. It helps in the identification of effort x result, cause and effect, and Supply and demand Its differential is that it can be used below the zero axis, further improving plus operat
Weis Wave Double Side Alert
Eduardo Da Costa Custodio Santos
The Weis Wave Bouble Side Indicator for MT5 is part of the toolkit (Wyckoff Academy Wave Market) The Weis Wave Bouble side Indicator for MT5 was created based on the already established Weis Wave created by David Weis. The Weis Wave Double Side indicator reads the market in waves as R. Wyckoff did in 1900. It helps in the identification of effort x result, cause and effect, and Supply and demand Its differential is that it can be used below the zero axis and has a breakout alert showing Who is s
VSA Candle Signal
Eduardo Da Costa Custodio Santos
The VSA Candle Signal for MT5 is part of the toolset (Wyckoff Academy Price and Volume). Its function is to identify the correlation of Price and Volume in the formation of the candle. Its creation is based on the premises of R.Wyckoff , a precursor in the analysis of Price and Volume. VSA Candle Signal for MT5 assists in decision making, leaving your reading clearer and more fluid. See the images below.
Force and Weakness Trading
Eduardo Da Costa Custodio Santos
The Force and Weakness Indicator for MT5 Forex is part of the (Wyckoff Academy Price and Volume) Toolkit The Force and Weakness Indicator for MT5 Forex was developed to identify the Strength and Weakness of volume in an accumulated way. Enabling the vision of a panorama between price and volume. The Indicator can be used as an oscillator and as a histogram. As usual it has all the premises of R. Wyckoff's three laws when put together with the price: Cause and Effect, Effort x Result and Supply a
WAPV Force and Weakness MT5
Eduardo Da Costa Custodio Santos
The Force and Weakness Indicator for MT5 Real Volume is part of the (Wyckoff Academy Price and Volume) toolset The Force and Weakness Indicator for MT5 Real Volume was developed to identify the Strength and Weakness of volume in an accumulated way. Enabling the vision of a panorama between price and volume. The Indicator can be used as an oscillator and as a histogram. As a fantasy it has all the premises of R. Wyckoff's three laws when put together with the price: Cause and Effect, Effort x Res
WAPV Weis Wave Chart Forex
Eduardo Da Costa Custodio Santos
The Weis Wave Chart Forex for MT5 is a Price and Volume indicator. The Price and Volume reading was widely disseminated through Richard Demille Wyckoff based on the three laws created by him: Supply and Demand, Cause and Effect and Effort vs. Result. In 1900 R.Wyckoff already used the wave chart in his analyses. Many years later, around 1990, David Weis Automated R. Wyckoff's wave chart and today we bring you the evolution of David Weis' wave chart. It shows the amount of Volume and the amount o
WAPV Weis Wave Chart MT5
Eduardo Da Costa Custodio Santos
The Weis Wave Chart for MT5 is a Price and Volume indicator. The Price and Volume reading was widely disseminated through Richard Demille Wyckoff based on the three laws created by him: Supply and Demand, Cause and Effect and Effort vs. Result. In 1900 R.Wyckoff already used the wave chart in his analyses. Many years later, around 1990, David Weis Automated R. Wyckoff's wave chart and today we bring you the evolution of David Weis' wave chart. It shows the amount of Volume and the amount of pips
WAPV Full MT5
Eduardo Da Costa Custodio Santos
5 (1)
## WAPV Full を使用して専門的に操作し、追跡できるようにする ビッグプレーヤーのお金はどこにありますか 単独で読み取りを行うツールを手に持っていると想像してください 最高の取引地域を示す主要な市場プレーヤーの 価格と出来高の分析に基づいています。 WAPV Full は、R. Wyckoff の運用に 100% 焦点を合わせた完全なツールです。 トレーディング ウェーブにおける市場の動きをマッピングするだけでなく、マッピングも行います。 価格と出来高を読み取ることにより、市場。 プロフェッショナル マーケットは、R.ワイコフの 3 つの法則に基づいて運営されています。 # 原因と結果 # 需要と供給 # 努力×結果 これらはすべて WAPV Full で提供され、16 の基本的なツールが提供されます。 あなたが市場を専門的に分析し、その結果として あなたの結果を改善します。 画像とビデオを見て、私が話していることを理解してください。 ## WAPV furu o shiyō shite senmon-teki ni sōsa shi, tsuiseki dekiru yō
WA Order Block FVG bos MT5
Eduardo Da Costa Custodio Santos
O  WA Order Block FVG bos MT5  é um indicador com base no estudo de SMC (Smart Money Concepts) criado pelo ICT Inner Circle Trader, eleplota no seu gráfico as informações de Order Blocks em 3 tempos gráficos diferentes, fair Value Gaps e Regiões de Liquidez além do BOS ( Break os Structures), tudo em um só indicador. Dessa forma você não precisa colocar essas informações de forma manual. Agora você tem tudo isso de forma automática em seu gráfico.
Livro Visual
Eduardo Da Costa Custodio Santos
O LIVRO VISUAL é uma ferramenta que auxilia na identificação de escoras e renovação de ordens, para quem opera Tape Reading ou fluxo no gráfico é uma excelente ferramenta. Porem ele funciona somente em Mercados Centralizados ou com profundidade nível 2. É de fundamental importância você saber que ele não funciona em Mercado de FOREX. Porem pode ser utilizado no Mercado da B3.
フィルタ:
レビューなし
レビューに返信