EMA Multi Timeframe Plus
- インディケータ
- バージョン: 6.1
- アップデート済み: 30 6月 2026
- アクティベーション: 5

One Glance. Seven Timeframes. Complete Trend Analysis. EA-Ready.
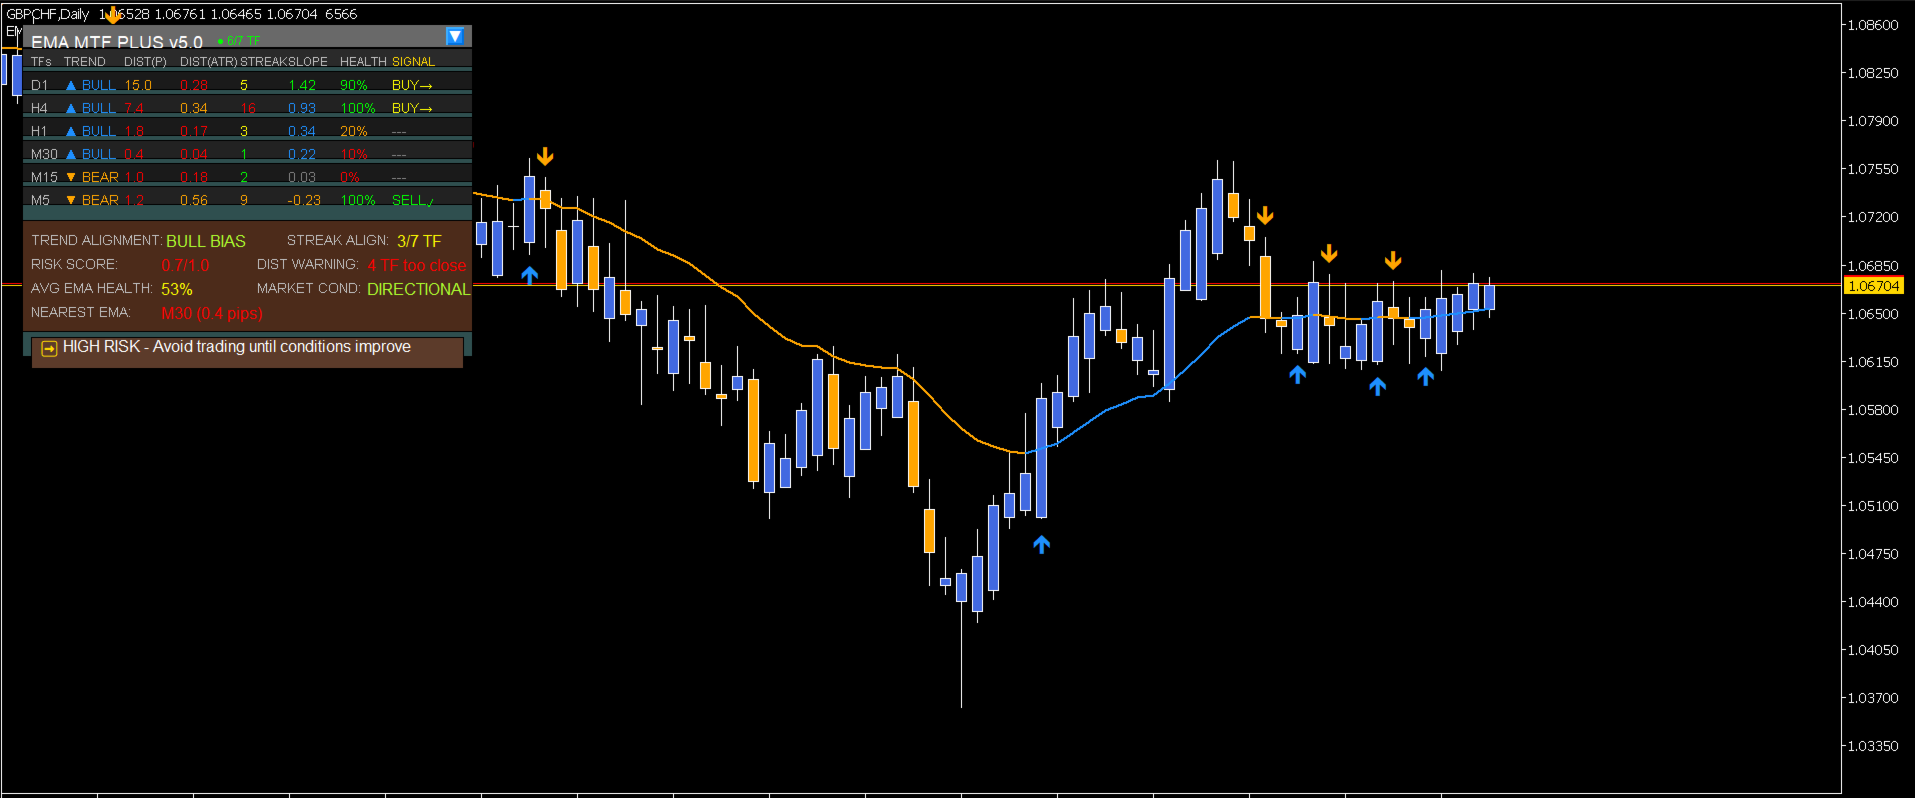
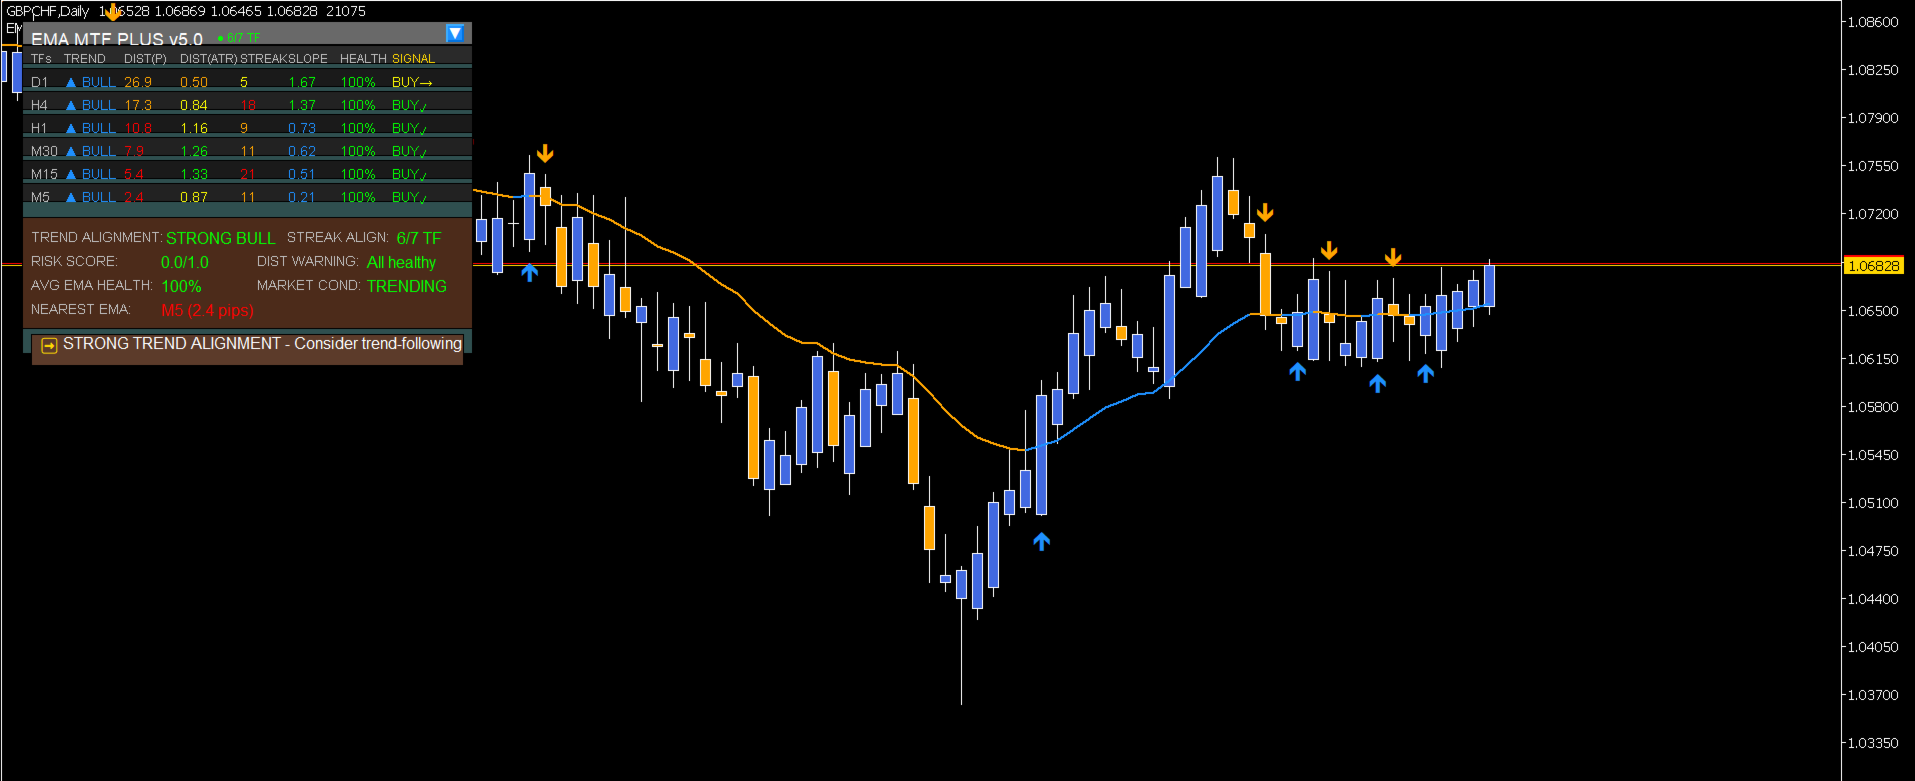
EMA MTF Plus v5.0 transforms your chart into a professional multi-timeframe command centre. No more switching between timeframes or guessing alignment. See every EMA direction PLUS trend health, distance metrics, streak analysis, and actionable insights – all on one ultra-clean, CPU-optimized display.
What It Answers in Seconds
| Question | How It Answers |
|---|---|
| Is TimeFrame trend bullish or bearish? | Blue = Bullish ▲ / Orange = Bearish ▼ |
| Do all timeframes agree? | Dashboard shows all 7 timeframes at once |
| When should I enter? | Graphical arrows plot when EMA changes direction |
| Is this a pullback or reversal? | Entry timeframes (H1–M5) Vs macro Trend (W1–H4) |
| How far is price from EMA? | DIST(P) column – distance in pips |
| Is the trend healthy or extended? | DIST(ATR) column – normalized by volatility |
| How long has this trend lasted? | STREAK column – consecutive bars on same side |
| Is momentum accelerating or dying? | SLOPE column – EMA steepness in pips/bar |
| What's the overall trend quality? | HEALTH column – 0-100% composite score |
| Should I enter now or wait? | SIGNAL column – Strong(✓), Moderate(→), or Weak(?) |
| What's the overall bias? | Smart Weighted Calculation: BULLISH / BEARISH / NEUTRAL |
| What's my risk level? | RISK SCORE – 0.0 to 1.0 quantitative assessment |
| Is the market trending or choppy? | MARKET CONDITION – TRENDING / DIRECTIONAL / CHOPPY / RANGING |
| What should I do right now? | ACTIONABLE INSIGHT – Clear trading recommendation |
| Can my EA use this? | Yes – 4 signal buffers fully exposed |
What It Does
Main Chart Features:
-
EMA line with dynamic color (Blue = rising, Orange = falling)
-
Clear Buy/Sell arrows when EMA changes direction
Dashboard Panel – Expanded Columns:
| Column | What It Shows | Why It Matters |
|---|---|---|
| TIMEFRAME | W1, D1, H4, H1, M30, M15, M5 | Complete market structure |
| TREND | ▲ BULL / ▼ BEAR / ● FLAT | Instant direction |
| DIST(P) | Distance from EMA in pips | Know if price is extended or compressed |
| DIST(ATR) | Distance normalized by volatility | Universal comparison across all instruments |
| STREAK | Consecutive bars on same EMA side | Fresh trend (1-3 bars) vs mature (10+ bars) |
| SLOPE | EMA steepness in pips/bar | Momentum acceleration or deceleration |
| HEALTH | 0-100% composite score | At-a-glance trend quality |
| SIGNAL | ✓ Strong / → Moderate / ? Weak | Trade readiness indicator |
Smart Summary Area:
| Metric | What It Reveals |
|---|---|
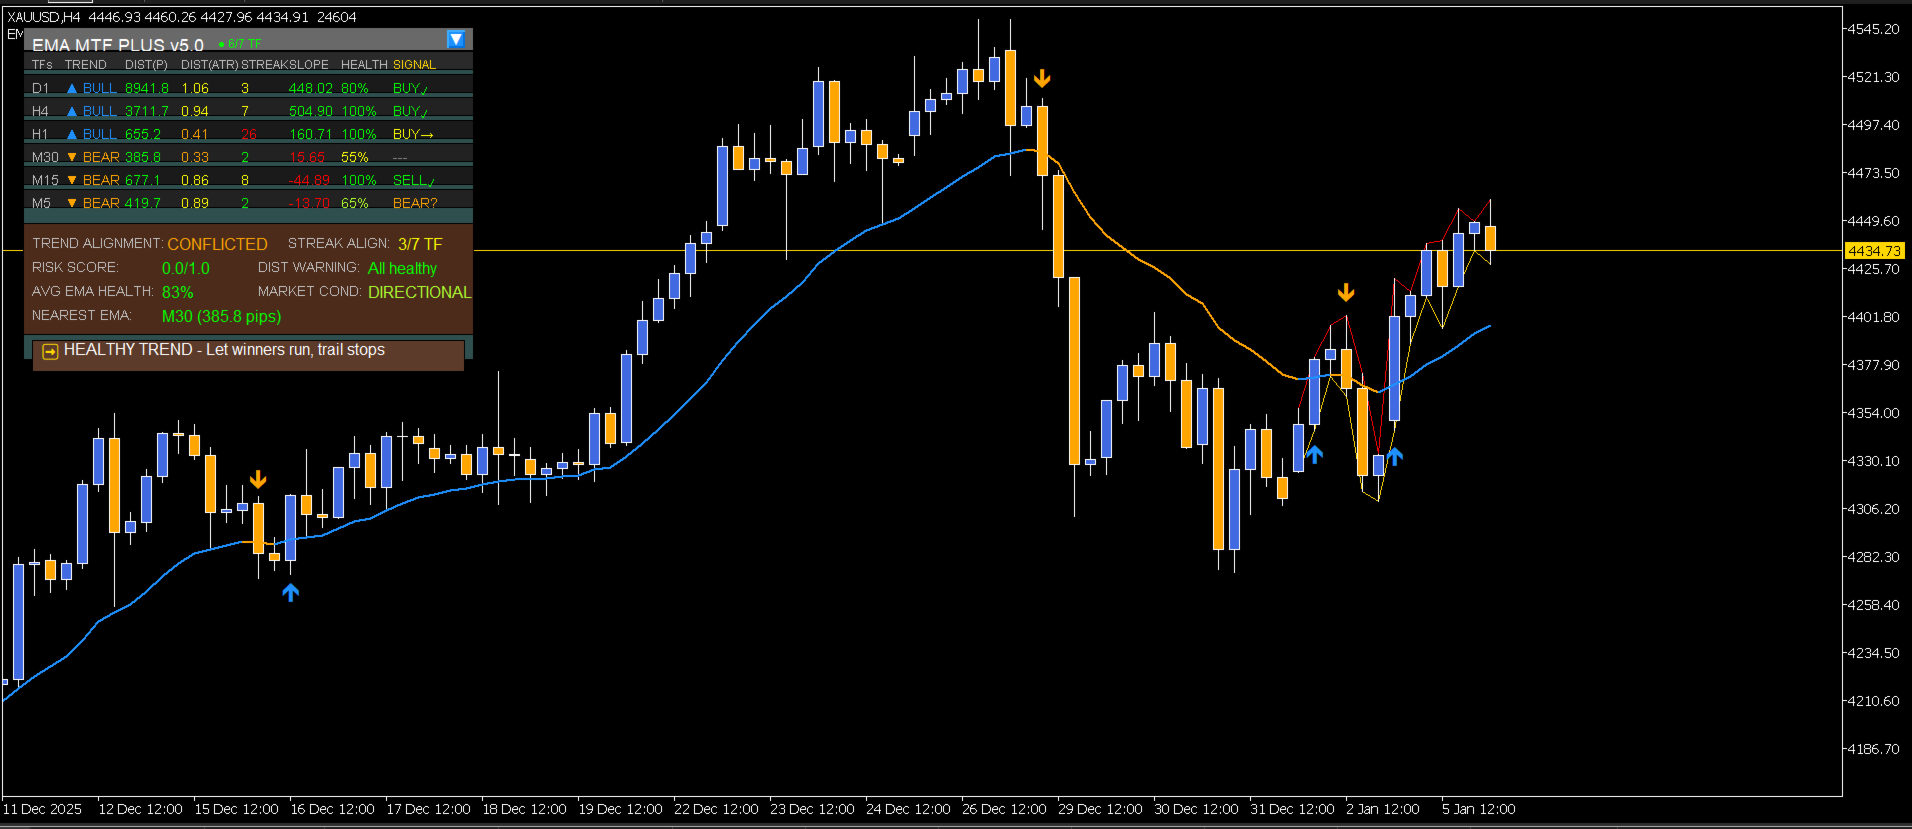
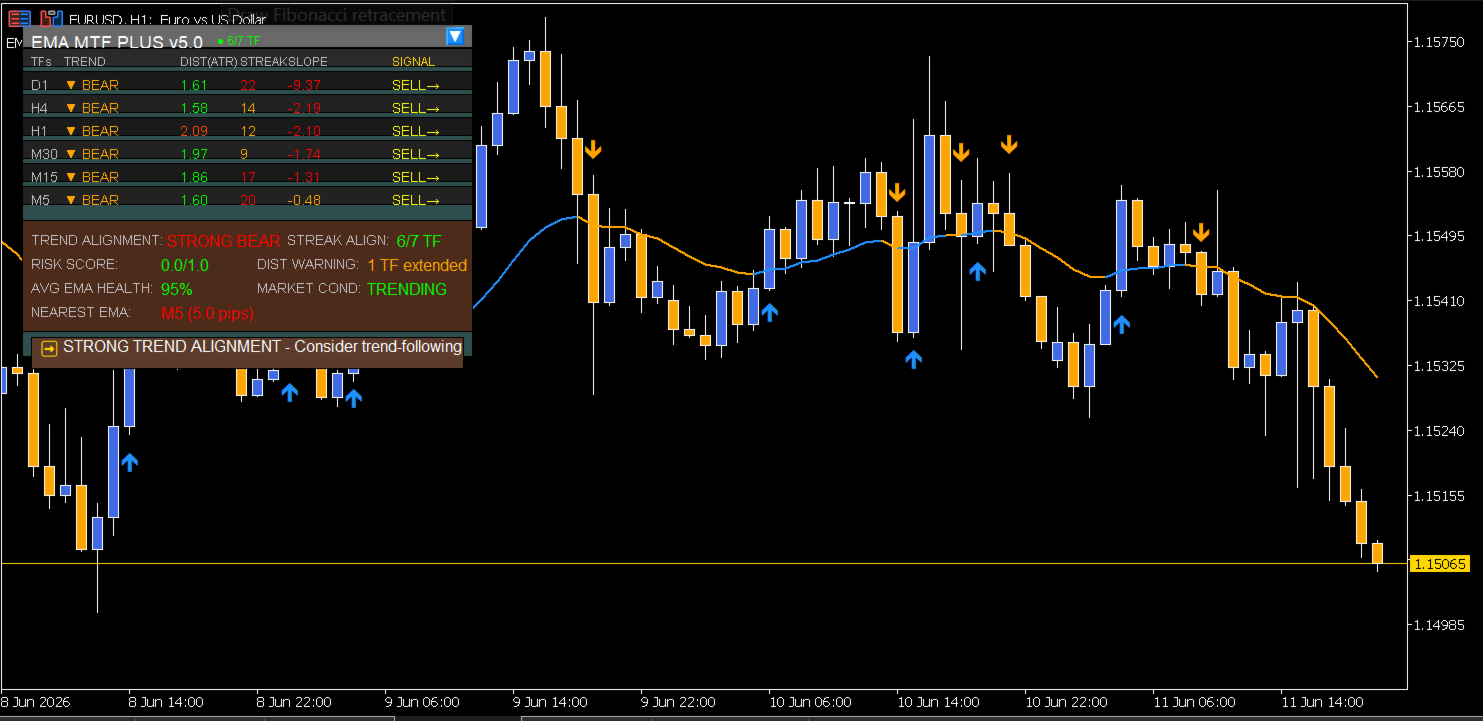
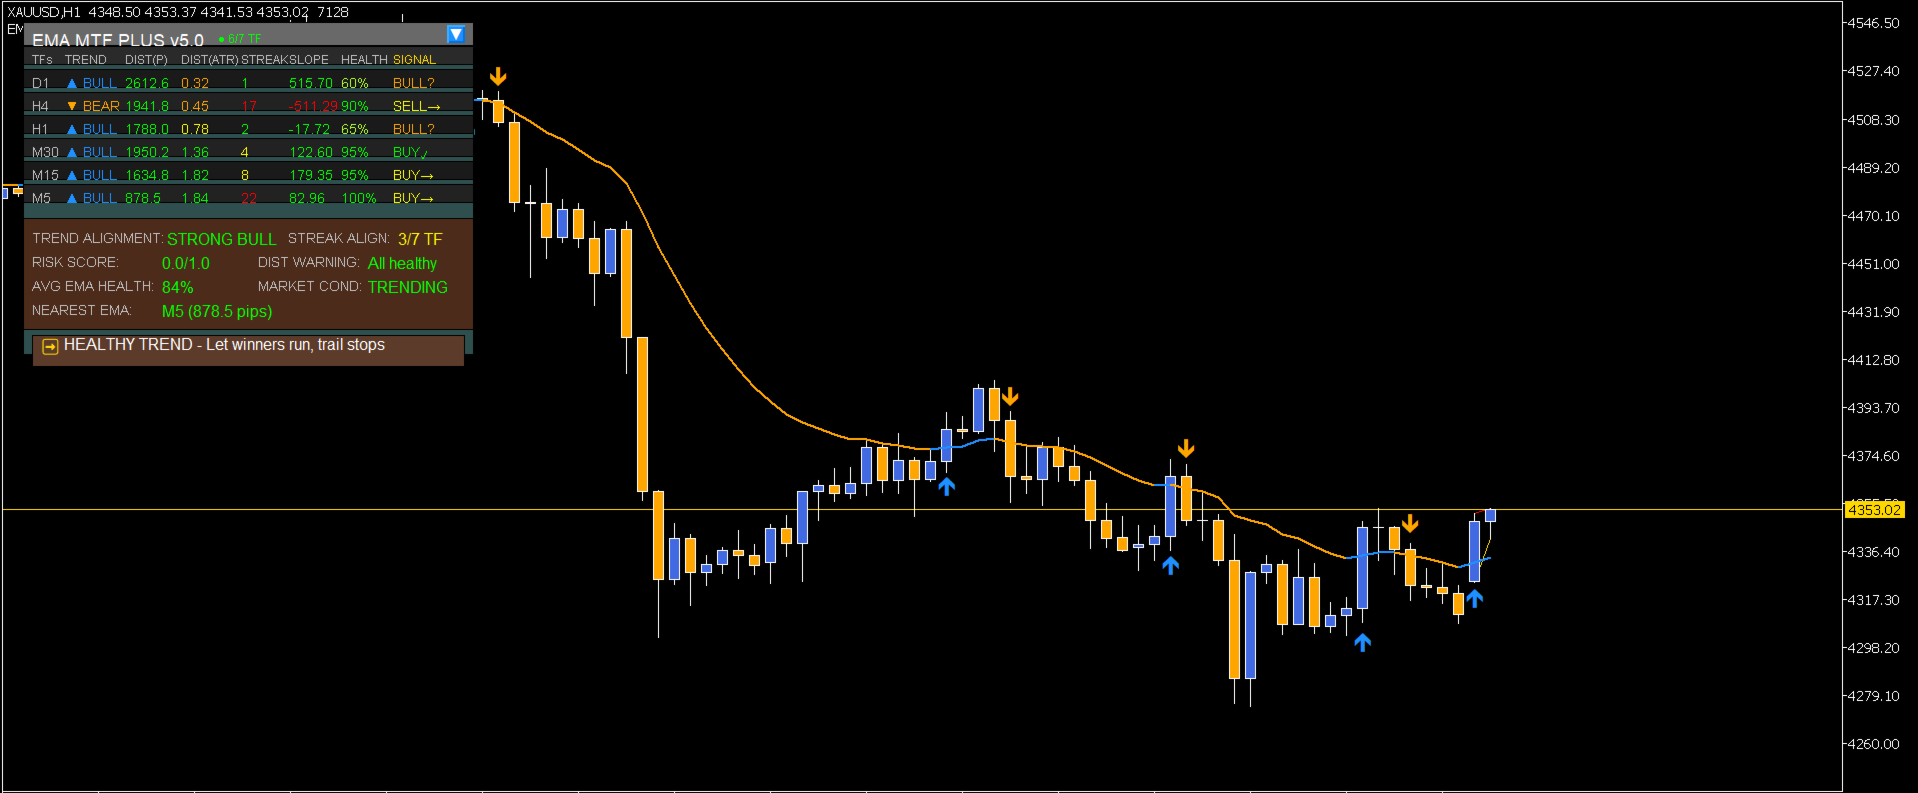
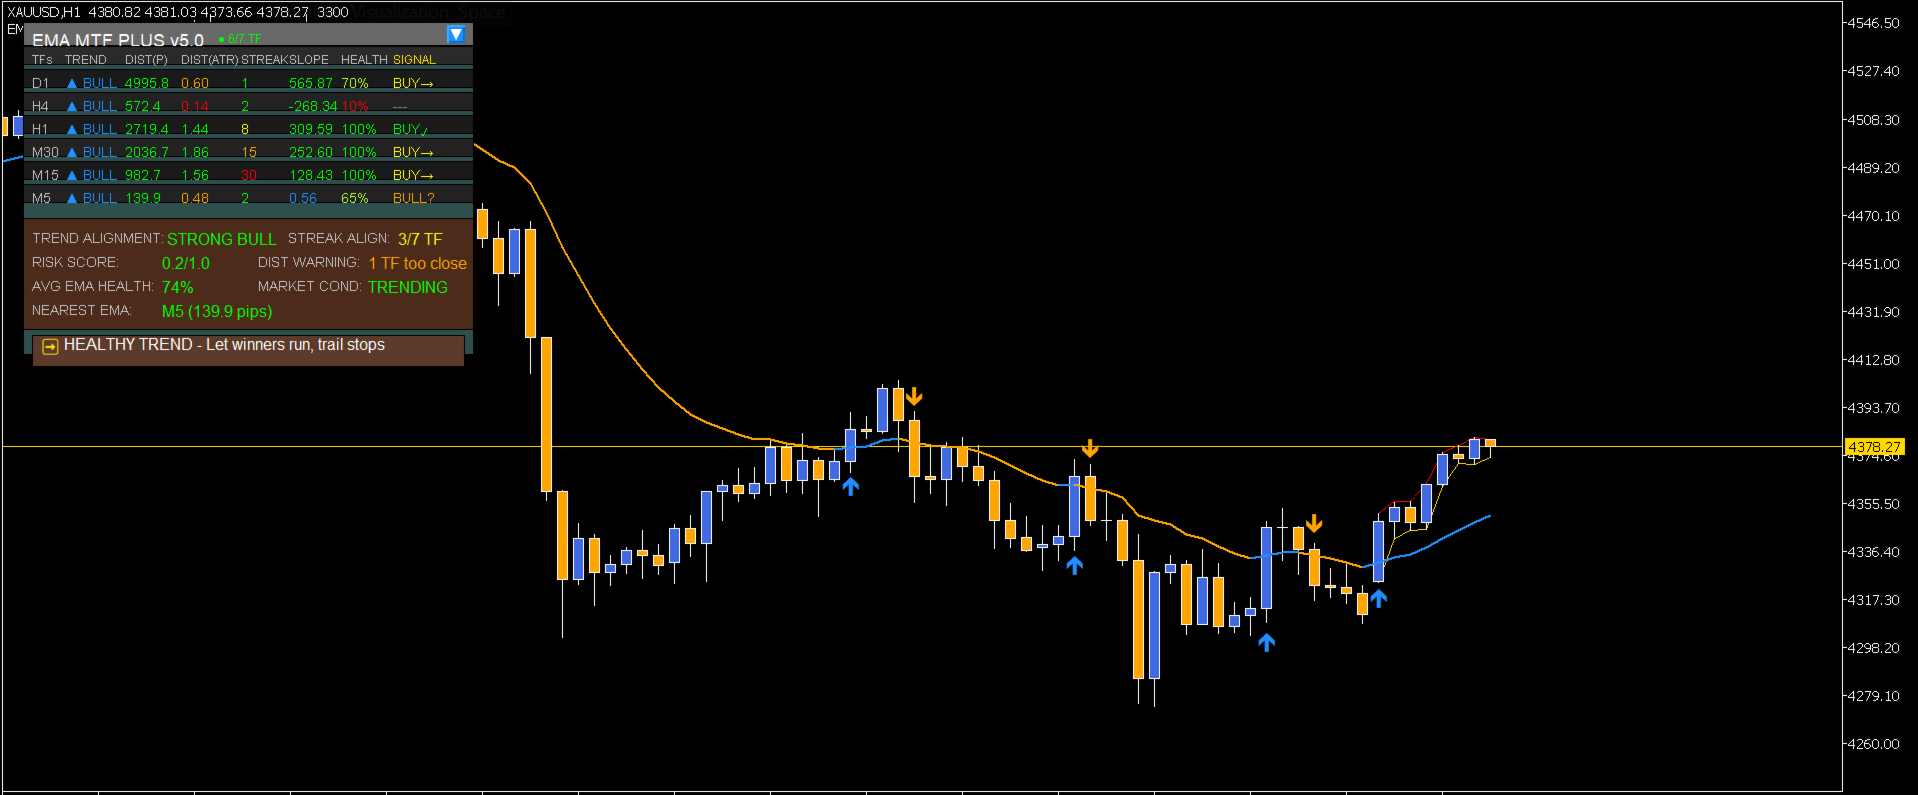
| TREND ALIGNMENT | STRONG BULL (80%+ TFs bullish) / CONFLICTED / STRONG BEAR |
| RISK SCORE | 0.0-1.0 quantitative risk assessment (HIGH >0.5, LOW <0.3) |
| AVG EMA HEALTH | Average health across all timeframes |
| STREAK ALIGNMENT | How many TFs have established trends (5+ bars) |
| NEAREST EMA | Closest EMA level = immediate support/resistance |
| DISTANCE WARNING | Alerts when price is too close OR too extended |
| MARKET CONDITION | TRENDING / DIRECTIONAL / CHOPPY / RANGING |
| ACTIONABLE INSIGHT | Clear trading recommendation based on all metrics |
EA-Ready Signal Buffers:
-
Buffer 0: Real-time raw EMA values
-
Buffer 1: Dynamic color trend state (0 = Bullish, 1 = Bearish)
-
Buffer 2: Buy signal trigger prices (EMPTY_VALUE if none)
-
Buffer 3: Sell signal trigger prices (EMPTY_VALUE if none)
Alert Features:
-
Custom pop-up alerts when overall market bias changes
-
Configurable cooldown timer to prevent spam in choppy markets
Why Traders Use It
Engineered for MT5 Expert Advisors
Call indicator data directly from your automated strategies using native MT5 handles and buffers. No slow parsing required.
Initialize in EA's OnInit() int emaMtfHandle = iCustom(_Symbol, _Period, "EMA MTF Plus", 20, true); // Read trend direction (Buffer 1) double trendDirection[]; ArraySetAsSeries(trendDirection, true); CopyBuffer(emaMtfHandle, 1, 0, 1, trendDirection); // Returns: 0 = Bullish, 1 = Bearish Check for fresh buy signal (Buffer 2) double buySignal[]; CopyBuffer(emaMtfHandle, 2, 0, 1, buySignal); bool newBuy = (buySignal[0] != EMPTY_VALUE);
Strategy Tester Verified
Recalculates every tick. What you see in backtests matches live execution perfectly. No lag, no repainting.
Hyper CPU-Efficient Design
-
User-toggleable columns – only calculate what you enable
-
Timer-based dashboard updates – configurable refresh rate (default 500ms)
-
Objects created once – never recreated, only updated in place
-
Smart throttling – MTF data refreshes at 1-second intervals
-
Change detection – panel redraws only when states change
Professional-Grade Metrics
Distance Tracking (DIST(P) / DIST(ATR)):
-
15-60 pips or 0.5-1.5x ATR = Healthy trend
-
<15 pips or <0.3x ATR = Too close – high reversal risk
-
60 pips or >2.0x ATR = Extended – potential pullback
Streak Analysis:
-
1-3 bars = Fresh trend – early entry opportunity
-
5-15 bars = Established trend – let it run
-
20+ bars = Mature trend – trail stops
Slope Momentum:
-
1.0 pips/bar = Accelerating momentum
-
0.5-1.0 pips/bar = Healthy momentum
-
<0.1 pips/bar = Momentum dying – trend weakening
Health Score (0-100%):
-
80%+ = Very strong trend – high confidence
-
60-80% = Healthy trend – tradable
-
40-60% = Moderate – use caution
-
<40% = Weak trend – avoid directional trades
Actionable Insights – What They Mean
| Insight | What It Tells You |
|---|---|
| STRONG TREND ALIGNMENT – Consider trend-following entry | High conviction setup across multiple timeframes |
| STRONG DIRECTION – Wait for pullback to EMA | Trend clear but price extended – wait for better entry |
| PRICE TOO CLOSE TO EMA on multiple TFs – High reversal risk | Choppy market likely – avoid directional trades |
| PRICE EXTENDED on multiple TFs – Mean reversion possible | Overextended – potential reversal or pullback |
| HEALTHY TREND – Let winners run, trail stops | Strong momentum – manage existing positions |
| TRADABLE BIAS – Confirm with lower timeframe entry | Directional bias exists – use lower TF for precise entry |
| CONFLICTED TIMEFRAMES – Wait for better alignment | No clear consensus – stay on sidelines |
| WEAK TREND HEALTH – Consider range trading strategies | Market lacks conviction – trade ranges |
Technical Specifications
| Specification | Detail |
|---|---|
| Platform | MT5 |
| Timeframes | W1, D1, H4, H1, M30, M15, M5 |
| Indicator Type | Interactive Chart Overlay + Sidebar Dashboard |
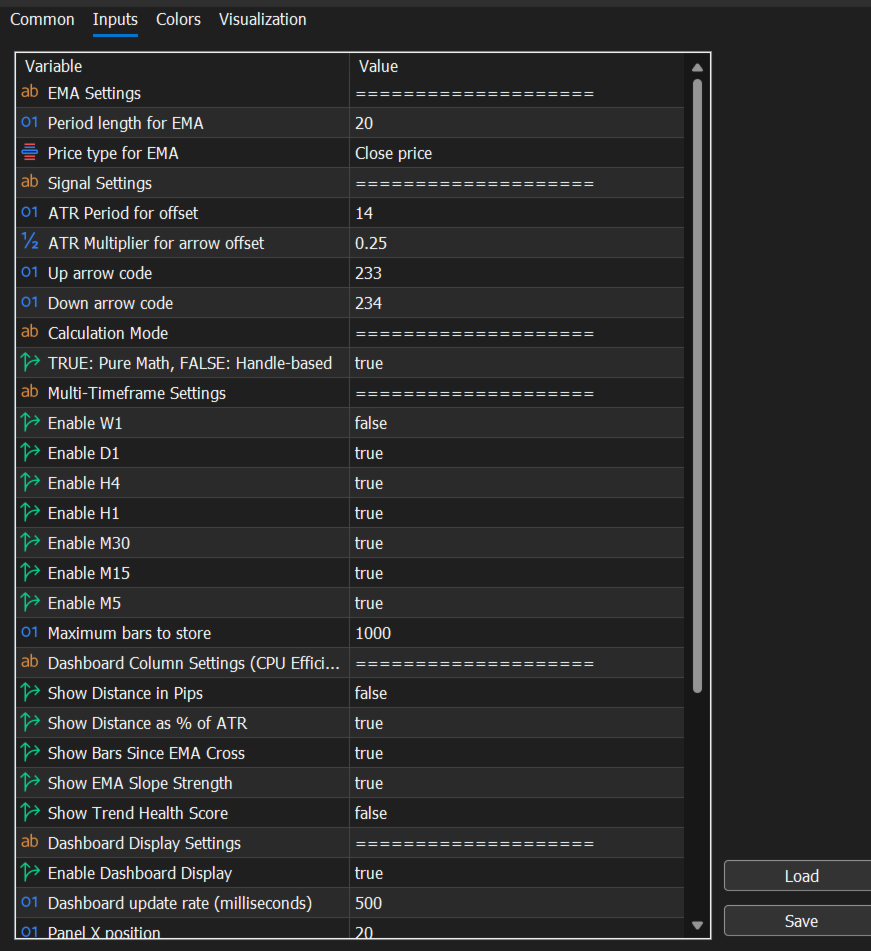
| Core Engine | Pure Math (faster) OR Handle-based |
| Max Bars | Configurable (default 1,000) |
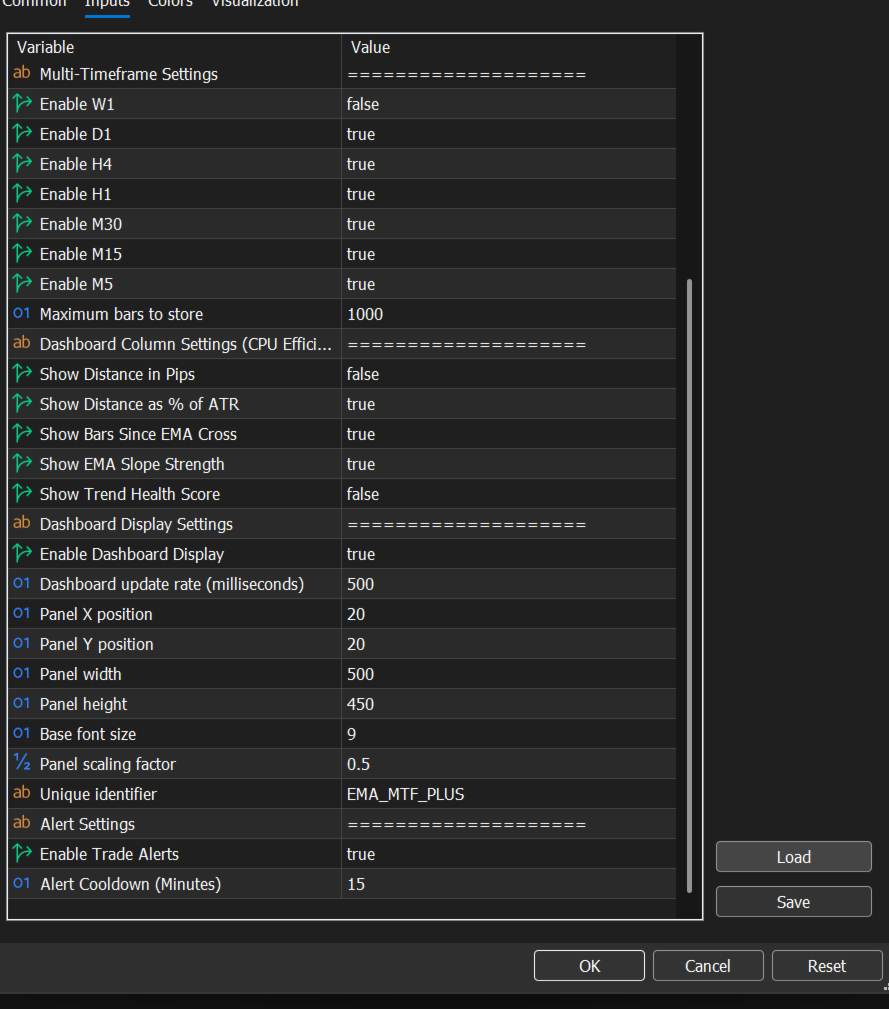
| Dashboard Update Rate | Configurable (default 500ms) |
| EA Integration | Buffers 0, 1, 2, 3 exposed sequentially |
| User-Configurable Columns | Show/Hide any column for CPU efficiency |
Quick Reference Card
DASHBOARD VALUES:
| Symbol | Meaning |
|---|---|
| ▲ BULL (Blue) | EMA rising – Bullish trend |
| ▼ BEAR (Orange) | EMA falling – Bearish trend |
| ● FLAT (Gray) | EMA flat or consolidating |
COLUMN LEGEND:
| Column | Healthy Range | Warning |
|---|---|---|
| DIST(P) | 15-60 pips | <15 = too close, >60 = extended |
| DIST(ATR) | 0.5-1.5x | <0.3 = choppy, >2.0 = extended |
| STREAK | 3-15 bars | 1 = fresh, 20+ = mature |
| SLOPE | 0.5-2.0 pips/bar | <0.1 = dying, >2.0 = accelerating |
| HEALTH | 60-100% | <40% = weak, avoid |
| SIGNAL | ✓ = Strong, → = Moderate, ? = Weak | — |
NATIVE EA BUFFERS:
| Buffer | Data |
|---|---|
| Buffer 0 | Real-time EMA value |
| Buffer 1 | 0 = BULLISH / 1 = BEARISH |
| Buffer 2 | Buy arrow price (or EMPTY_VALUE) |
| Buffer 3 | Sell arrow price (or EMPTY_VALUE) |
SMART BIAS RECOMMENDATION:
| Result | Meaning |
|---|---|
| STRONG BULLISH - TREND FOLLOW | High confidence bullish setup |
| BULLISH - CAUTION | Bullish with weak health |
| NEUTRAL - AWAIT DIRECTION | No clear consensus |
| CHOPPY - RANGE EXPECTED | Market ranging, avoid trends |
ON-CHART REVERSAL ARROWS:
| Arrow | Trigger |
|---|---|
| Buy ↑ | EMA changes from Orange (falling) to Blue (rising) |
| Sell ↓ | EMA changes from Blue (rising) to Orange (falling) |
CPU OPTIMIZATION TIPS:
-
Disable columns you don't need via input parameters
-
Increase DashboardUpdateRate for slower systems (1000ms+)
-
Reduce MaxBarsPerTF if memory is limited
-
Enable only the timeframes you actively monitor
Questions or Support? E-mail ebrah.ssali@nnanda.com or message us directly through the platform. We wish you profitable trading!