Williams Vix Fix MT5
- インディケータ
- バージョン: 1.0
- アクティベーション: 5

Williams Vix Fix MT5
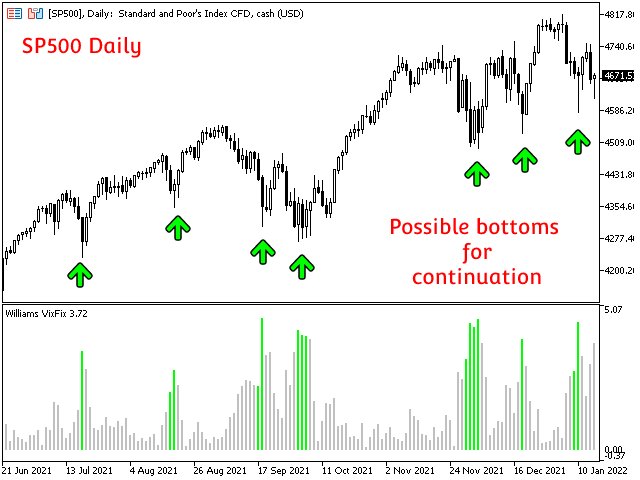
Need help trying to time the bottoms in the market?
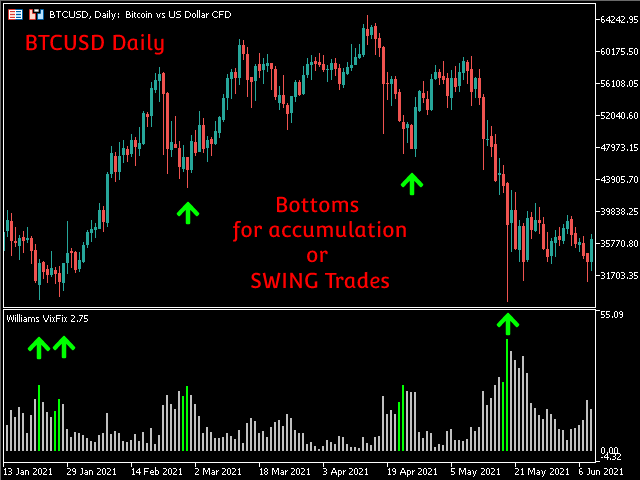
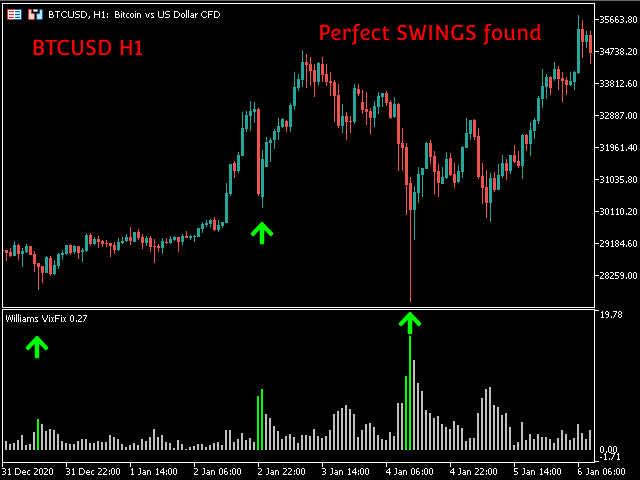
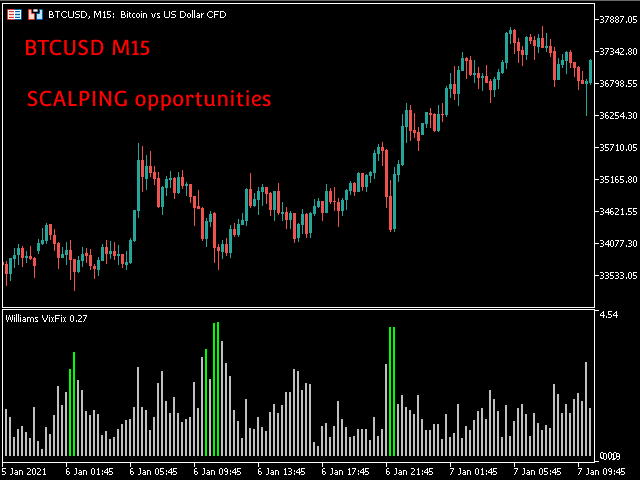
Williams Vix Fix MT5 is based on the volatility of the market and grants a huge support for finding out when a correction is comming to its end.
TRY IT FOR FREE NOW!
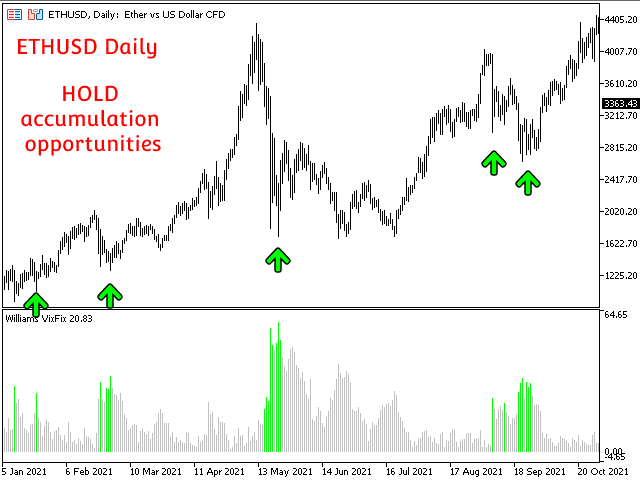
Williams Vix Fix MT5 derivates from Larry Williams's VixFix indicator addapted for fitting every asset class. VIX reprensents the fear and greed in the market based on its volatility. A high VIX value shows fear in the market, this is usually a good time to look for accumulating long possitions or looking for long trades. This can open big opportunities if combined with lower timeframes.
VIX Fix is calculated using the following formula:
VIX Fix = (Highest(Close, 22) - Low) / (Highest(Close,22)) * 100
This indicator offers the posibility to adapt it yourself and choose price's high, close or open and the period for the comparation to better fit the desired asset class. Besides that it is combined with Bollinger Bands and percentiles for better highlighting possible bottoms.
This indicator can be use on its own or with a grid method for HOLD strategies or analyzing higher timeframes and looking for entries in lower ones for SCALPING and SWING strategies.
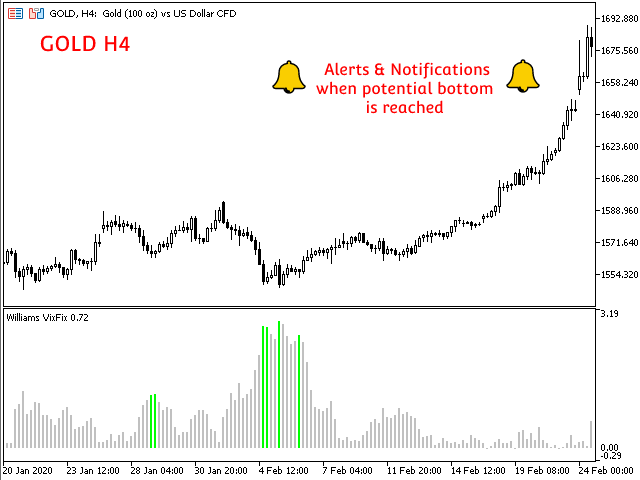
At the same time, Williams Vix Fix MT5 provides a system of alerts and notifications on the mobile phone and on the MT5 Terminal when the price enters reaches a possible bottom.
Some of the characteristics of the indicator are the following:
- Time saving
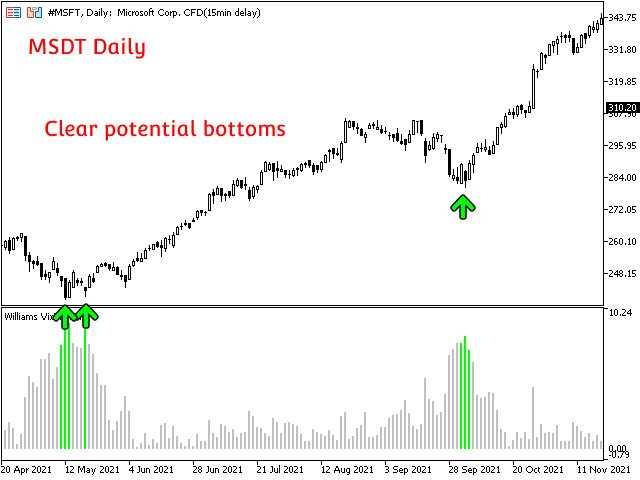
- Provides information about price reaching possible bottoms
- Ease of decision-making for entries
- Highly customizable
- Functional in all pairs (Crypto, Forex, Stocks, Indices, Commodities ...)
- Perfect for Scalping, HOLD or Swing trading
- Alerts and notifications on the MT5 terminal and on the mobile phone
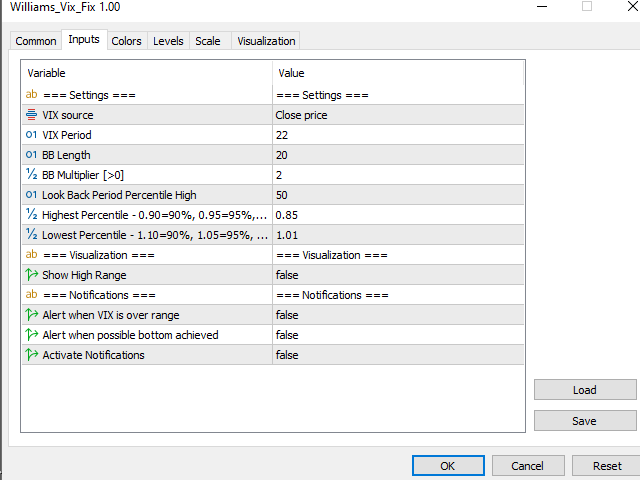
Input parameters
Settings:
- VIX Source: Price data source for the VIX calculation (High, open, close, median, typical and weighted)
- VIX Period: Standard deviation period for the VIX calculation
- BB Length: Bollinger Bands' period
- BB Multiplier: Bollinger Bands' multiplier [>0]
- Look Back Period Percentile High: Number of candles for checking High Percentile
- Highest Percentile: High percentile lvl (0.90=90%, 0.95=95%, 0.99=99%)
- Lowest Percentile: Lowpercentile lvl (0.90=90%, 0.95=95%, 0.99=99%)
- Show High Range: Shows VIX range in the indicator's window
Notifications:
- Alert when VIX is over range: Enables alerts on the MT5 Terminal every time VIX exits the range
- Alert when possible bottom achieved: Enables alerts on the MT5 Terminal if price reaches a possible bottom
- Activate Notifications: Enables phone Notifications
Support and questions
Do not hesitate to contact me for any questions and support
Author
Diego Arribas, private investor and speculator, automation engineer in the aerospace industry
ユーザーは評価に対して何もコメントを残しませんでした