SL Trend Scanner MT5
- インディケータ
- バージョン: 1.0
- アクティベーション: 5

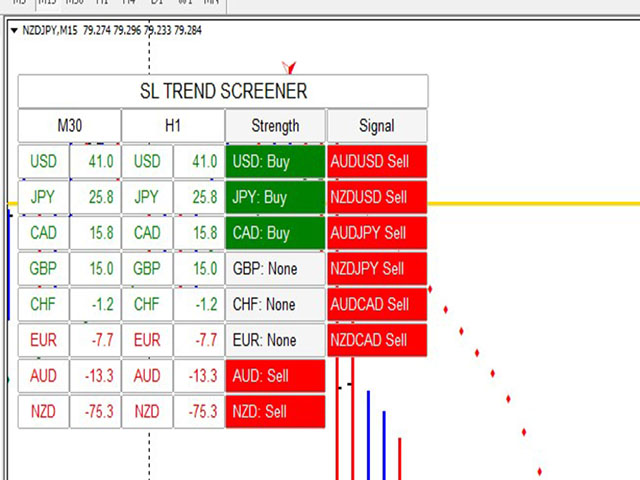
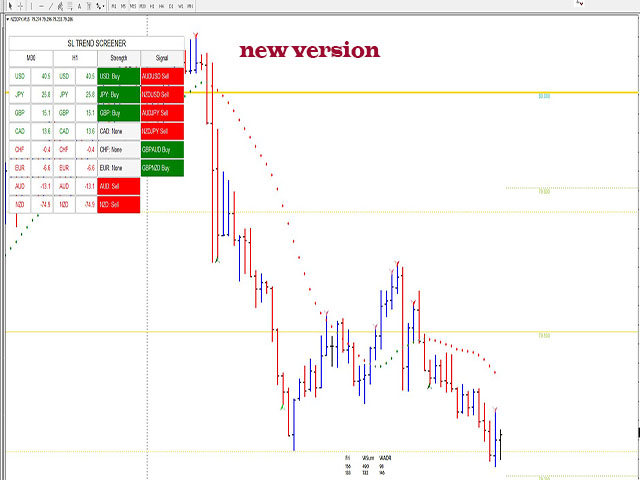
HI guys this my developing indicator 1st version alert logic work well..
this indicator using can you stronger currency and top weaker currency find well,this;s indicator multy
MTF time frame strength work.very good for SL trend screener intraday trader and long time trader, very easily
can you watch stronger and weaker index.I hope to more improve this future further,thank you
if you want more information please pm me