SL Sniper MT4
- インディケータ
- バージョン: 1.2
- アップデート済み: 12 4月 2022
- アクティベーション: 5

Suggested timeframes to trading :M1-M5 - M15-M30 -H1
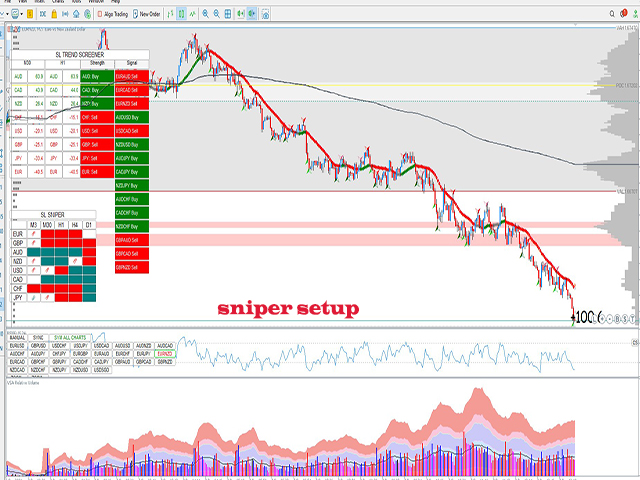
wait london and newyork markert open after wait best then select the best strong index and weakest index by sniper.
histogram is indicated by one arrow at a time. The signal in the end direction of weak and strong
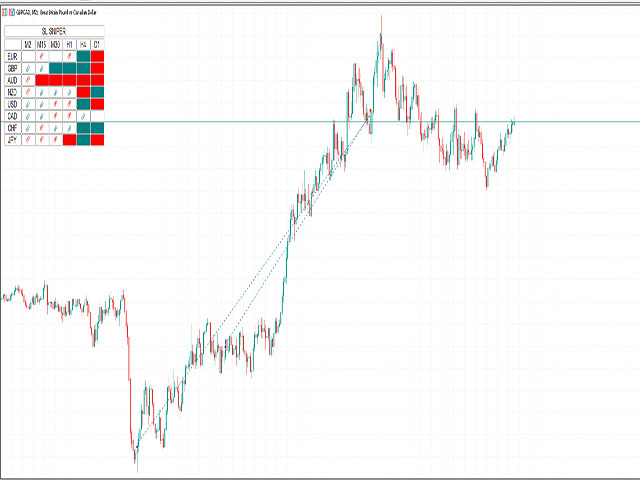
all red and green mean trending index,natural market is displayed only in white
SL Sniper Indicator can be used for short term long and scalping. It is better to confirm entry signals with high low price action.
currency is gaining strength and the other is losing strength.(up down arrow symbol possible trending it symbol)
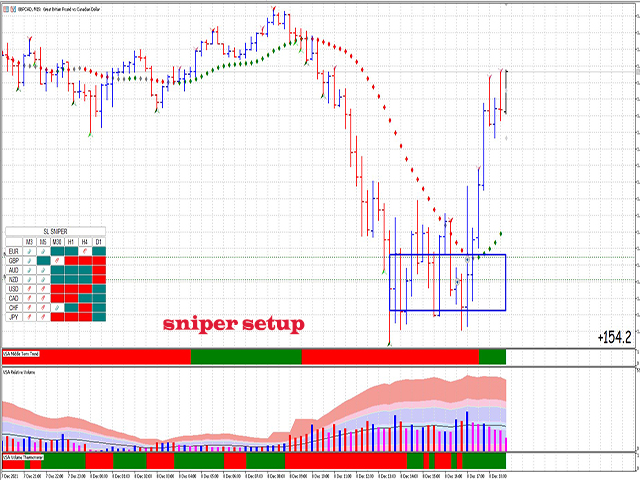
Trade rule watched sniper signalBefore analysis h1 and h4 chart supply and demand.scan multiply time frame volume price action signal bar
filter sniper signal and volume price action road is clearTake chart 1m and chart 5m and trade low risk
Four principals to become a successful trader Identify the two phases of Accumulation and the t wo phases of Distribution. Learn multiple time frames to identify up and down trends using a check list. Learn how to build a trading field structure. Know , Where, when and what set ups to take and how to manage your entrys, exits, and stop lose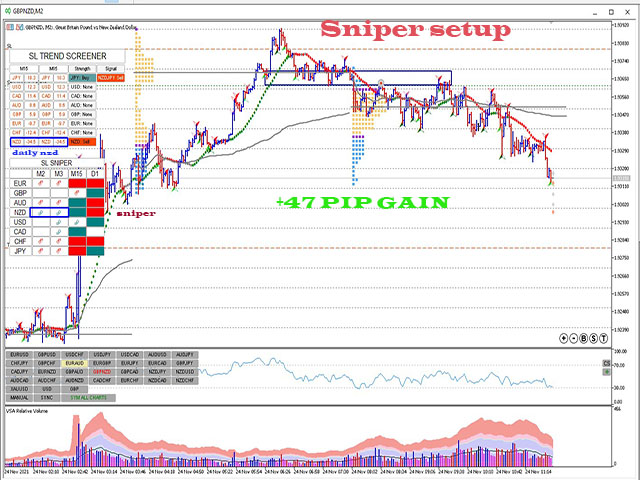
vsa implementation was SUCCESSFUL!....vsa system helps to see the market from a different angle....complements your own strategy...combines well with the indicator itself. Huge respect to the author in helping and setting up! Everything is very useful for trading!