MYArrow1
- インディケータ
- バージョン: 2.12
- アップデート済み: 23 11月 2023
- アクティベーション: 5

MyArrow インジケーター Nr:1
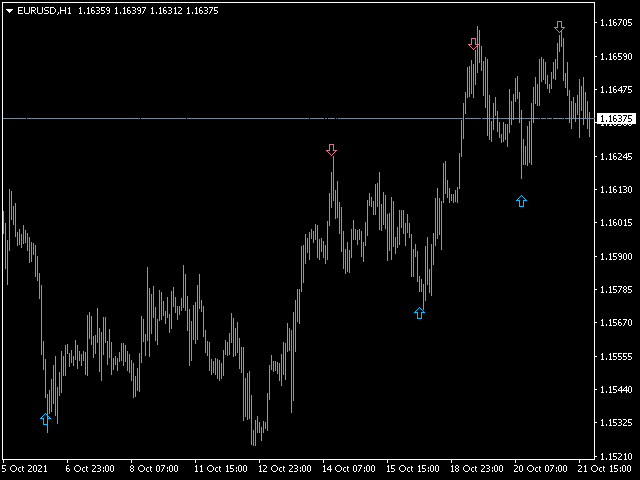
このインジケーターは、高値と安値の系列を調べることによって作成された移動平均と、グラフ上のこれらの移動平均から導出されたバンド値を超えることによって受信された信号によって作成されます。
簡単に理解できるように、下向きの矢印は有望な売りシグナルを示し、上向きの矢印は可能性のある買いシグナルを示します。
たくさんのお得...
MyArrow インジケーター Nr:1
このインジケーターは、高値と安値の系列を調べることによって作成された移動平均と、グラフ上のこれらの移動平均から導出されたバンド値を超えることによって受信された信号によって作成されます。
簡単に理解できるように、下向きの矢印は有望な売りシグナルを示し、上向きの矢印は可能性のある買いシグナルを示します。
たくさんのお得...

The Author is very responsive and friendly, when it comes to issues. For the momment it seems a great product. UPDATE 03.03.2025 Very very good product.