Ahmet Metin Yilmaz / 販売者
パブリッシュされたプロダクト

This indicator analyzes the ranges in the selected LookBack Bars and shows the relative strength of the price movement with the Level percentage you set. The blue line indicates that the current price movement is strong, and the yellow line indicates that we are in a flat price movement. The blue line does not determine whether the price action is up or down, it just shows relative strength. Therefore, as seen in the picture, direction can be determined with a simple zigzag indicator on the main

3S indicator designed for trend detection without the effect of accidental price leaps. It uses Price Series and a few moving averages for noise reduction. It works on multiple timeframes, even M1. To increase effectiveness, it is recommended to use default parameters for M1 graphic (see screenshots). You can change settings for other time frames. Example of using this indicator : If Gold cross to Blue down and both gold and blue under the Gray , it could be a promising sell signal .
To

EwoMov indicator is useful for determining a trend with higher period of price Moving Averages (it should be higher than 200). I am using this indicator for swing trade on M5-M30 charts. This indicator uses several bars for calculation. They are all saved in external parameters. The proper values are 5 - 13 - 34, but you can change them. It is ready for all timeframes, but does its best for M5-H1. It is designed to be optimized for other timeframes. You can find some explanations on screenshots.

Mighty Scalper LightEA
A Trend Friendly EA There are different and complex logic mixed in it It begins to work, simply with a BreakOut strategy and Works in PARTIAL CLOSE and CLOSE TIME LIMIT you had never seen before in the market expert... It opens an order and use partial close in a specific levels and close order within a specific time ( if order still live ) No Martingale and hedging It works any kind of broker, but lower spread gets more gain Fast optimization for strategy tester ( for n

This EA uses Non-Repaint Hull Moving Averages calculation. You can find positive results with the correct optimization. Optimization should be adjusted according to the properties of the broker you are using and your trading institution. Default settings are optimized for AUDUSD in an ECN broker for M30 time frame. (Remember, it is necessary to re-optimize your brokers for the settings.)
Test it before buying for your broker settings if it is ok, It is recommended use rental option to be sure.

The Great Gig In The Sky is an expert advisor and also a song from My favorite Rock Band's. Pink Floyd. There is only one input parameter. Lots amount. You know what do you do in there. Try in a demo account from your real broker to test. Expert logic also includes stop loss and take profit transactions. Do not worry about them. The one-month rental period is only for you to try the experiment and is valid for limited copy. Tested and Preferred pairs are GBPJPY, CHFJPY,CADJPY. I am still contin

Alan Hull's moving average, more sensitive to the current price activity than the normal MA. Reacts to the trend changes faster, displays the price movement more clearly. No Repaint Version on separate Windows shows the trend 1 and -1 . Improvement of the original version of the indicator by WizardSerg <wizardserg@mail.ru>. Suitable for all timeframes.
Parameters Period - period, recommended values are from 9 to 64. The greater the period, the smoother the indicator. Method - method, suitable v
このインジケーターは、入力パラメーター バー検出戦略を使用してブレイクアウトを除外します。 WaitForBarClosed 関数を使用してシグナル (true) を確認できますが、false よりも少し遅れてアクティブになることがあります。 インジケーターが別のウィンドウで開きます。 すべての時間枠とペアに適しています。 青い線はトレンドの方向を示しています。
任意のチャートにインジケーターを添付 ポップアップ表示されるインジケーター ダイアログ ボックスから、入力タブで目的の入力を選択します。 [OK] を選択して確認し、続行します。
パラメーター Lines_Break: 周期、推奨値は 3 ~ 21 です。周期が大きいほど、インジケーターが滑らかになります。 WaitForBarClosed: "true" または "false"。 よりタイトなストップ ロスと小さなテイク プロフィット レベルによって、より早いシグナルに「false」を使用できます。 確認済みシグナルには「true」を使用できます。 true と false の両方のオプションが一緒に使用されているス

OneWayTicket indicator is based on CCI indicator. In fact, it analyzes multiple CCIs from several timeframes. There are four Ways of OneWayTicket, read from left to right - 15 min, 30 min, 1 hour and 4 hours. The idea is to enter the market when all four CCIs agree on a trend. A trader chooses which timeframes to monitor. When all four ways of the OneWayTicket are green - Buy . When all four ways of the OneWayTicket are bright red - Sell . Original idea from the author: tageiger, revised for the

This Script Shows your Account & Symbol information which you use on your graphics. These are: Account Information Number Name Currency Server Leverage Stop Out Level Balance Information Balance Equity Margin Free Margin Symbol Information Symbol Lot Size Min.Lot Lot Step Max.Lot Tick Value Tick Size Spread Stop Loss Level Swap Long Swap Short Initial Margin Maint.Margin Required Margin Trade Allowed

"Virtue" is a fully automated Long term Expert Advisor. It calculates market condition itself and decides to enter a position. "Virtue" needs patience that is the why its name Virtue. Patience is a virtue. You must be patient to make some Money. You have to wait for it to find optimal conditions to open an order. It will be enough to just install it on the platform. No need to optimize many parameters. Expert is optimized for EURUSD H1 timeframe. First download demo and test it for your broker.

Virtue Multi Lot "Virtue" is a fully automated Long term Expert Advisor. It calculates market condition itself and decides to enter a position. This is the main position. After that position, it adds some small lots for scalping. You can select how many orders will be open extra. It depends on your account margin and risk managment.
"Virtue" needs patience that is the why its name Virtue. Patience is a virtue. You must be patient to make some Money. You have to be wait it find optimal conditi

Instructions Attach the indicator to any chart (advised H4) Use input tabs (defaults are 5 and false ) Press ok and continue trading.
Description The indicator uses a kind of pattern breakout strategy to help your trading strategy. I am using this strategy on H4 charts for many of pairs with a trailing stop and default indicator settings. Better results are shown on USDJPY, EURJPY, CADJPY, EURGBP, EURUSD, USDCAD, USDCHF, NZDUSD and GBPUSD.
Trailing stops should be different for each pair. The b

PivotSupportResistance This indicator plots horizontal lines at daily pivot levels R3, R2, R1, Pivot, S1, S2, S3, where R means Resistance and S means Support. This indicator can be applied to any chart period, although daily pivots on charts with long periods are meaningless (if you switch your chart timeframe greater than daily chart, you will get alert and indicator will not work). Labels are shown for the most recent day's levels. There are no external inputs, so it is easy to use. Please re

PriceChannel is designed for trend detection without the effect of accidental price leaps. It uses Price Series and a few moving averages for noise reduction. It works on multiple timeframes, even M1. To increase effectiveness, it is recommended to use 3 instances of PriceChannel with different parameters on one chart (see screenshots). You can use the following settings (for M1 charts): PriceChannel(10,2,30) Gold colour. PriceChannel(10,5,30) Blue colour. PriceChannel(21,8,13) Gray colour. Exa

Variation of Moving Averages indicator is calculated as the difference between different periods of moving averages. Obtained result filtered by another MA. It displays more precise signals of divergences between prices and the value of the indicator. It emphasizes price extremums more precisely, it moves faster.
There are three inputs FastMA: Default is 13, shows MA period. SlowMA: Default is 21, shows MA period. SignalMA: Default is 8, shows MA period. It basically detects the trend, advised

This indicator calculates price movement with the Volume. The Volume indicates the number of deals in the desired period, but does not show number of contracts per deal. From this point of view, the tick does not reflect the true volume. However it is a valuable demand indicator. Volume and price are calculated with a special formula.
There are 3 input parameters EMAPeriod: Price and volume data are calculated using this period of Moving Average first. DEMAPeriod: Results of first EMA, recalcul

Differences of Moving Averages This indicator plots short term trend with two moving averages difference and its signal line. Best result at 5 min chart in default parameters. There are 7 extern input parameters: MaShortPeriod: period of the first MA. MaLongPeriod: period of the second MA. ModeDoMA: DoMA method. ModePrc: MA price mode. SignalMaPeriod: Period of Signal MA. ModeSma: Signal MA mode. LabelLevel: Horizontal line level on display. Default parameters can be changed by user.

HLOC Trend Indicator This indicator helps you to determine trend direction on your trade. Default parameters for H1 time frame. You can use this indicator both bigger time frame and smaller time frame to open a trade. The calculation is based on high, low, opening and closing price values of each bar in the selected time period. When the values found in the Indicator custom formula are exceeded, the buy or sell signal falls on the screen. There are two extern inputs; RiskFactor: Early but risky

HLOC Trend Indicator This indicator helps you to determine trend direction on your trade. Default parameters for H1 time frame. You can use this indicator both bigger time frame and smaller time frame to open a trade. The calculation is based on high, low, opening and closing price values of each bar in the selected time period. When the values found in the Indicator custom formula are exceeded, the buy or sell signal falls on the screen. There are two extern inputs; RiskFactor: Early but risky

This indicator shows Linear Regression Line and it's channels which calculated with fibo numbers. You can use this indicator in different timeframes on your chosen timeframe chart. You only need to attach this indicator on the chart twice or more with a different colors to do this. There are 6 input parameters; period : you can choose regression timeframe independent of chart timeframe. linewidth : width of line on the chart. bars back regression begin : calculated regression bar count. LR

This indicator examines the relative strengths of the currencies of 8 different countries and displays the one that has the potential to gain profit in the short term as a suggestion. The relative strength of each country's currency over the selected time period is shown on the graph as a percentage.
The recommended currency according to BuyLevel and SellLevel determined by the user is shown in the bottom right section. The indicator also automatically brings up the 30-minute graph of the sugges

Price Action Signals generates buy and sell signals with price close and complex logic. You can use it different timeframes and pairs. Best results are on M30 and H1 charts with default parameter. You can change this parameter ( nFrequency ) for other timeframes. ( except M1 timeframe ) There is only one extern input: nFrequency: It determines signal frequency. Default is 0.004. You can use this arrow for Expert Advisors. Upsignal: iCustom(......"PriceActionSignals", buffer nr:0 ) Downsignal :

ATR Channel is an indicator. It shows us ATR ( depends on selected period ) Line on main chart. It also draw 3 up ATR channels (ATRu) and 3 down ATR channels (ATRd) on the same window. All they helps you to trade with a ATR indicator. There are 6 extern inputs; PeriodsATR : You can change ATR Period default is 13. MA_Periods : Use for draw ATR channels MA periods. Default is 34. MA_Type : You can change MA_method here. Default is Linear weighted. Mult_Factor1 : It is for first up and d

偶発的な価格急騰の影響を受けずにトレンドを検出するように設計された PriceRunner インジケーター。 ノイズ削減のために、Price Series といくつかの移動平均を使用します。 M1 を含め、複数の時間枠で動作します。 効果を高めるには、M1 グラフィックにデフォルトのパラメーターを使用することをお勧めします (スクリーンショットを参照)。 他の時間枠の設定を変更できます。 このインジケーターの使用例: ゴールドがブルーにクロスし、ゴールドとブルーの両方がグレーの下にある場合、有望な売りシグナルである可能性があります。
このインジケーターからシグナルを取得するには (プロのエキスパート ユーザー向け): ゴールド: バッファー番号。 0、青: バッファ番号。 1、灰色: バッファ番号。 2 このインジケーターは同じロジックを使用し、「TripleS インジケーター」を計算しますが、チャート ウィンドウではなく別のウィンドウに描画します。以前に「TripleS インジケーター」を販売した場合、これも販売することをお勧めしません。スクリーンショットを見て、最初にデモをテス

SrEwo Expert adviser designed and optimized for EURUSD. You may Optimize all other instruments. It is easy to use. *** It uses only M5 chart graphic and you need to use M5. ( Both test and live ) Input Parameters: Lots: Base lot amount.Expert use this amount as referance. crossfactorlimit: expert will open new order with this limit modifylimit & TP limit : order modify and another TP limit. targetprofit : expert calculates this number in its logic. crossfactor : next order lots multiply with t

Expert works H1 timeframe only There are two main criteria. Daily pivots and moving averages. To open a buy order, today's daily pivot must greather than the day before's daily pivots. Moving averages for EURUSD pair as default. They can be changed for other pairs and also for EURUSD too. You can also change takeprofit and stoploss level. expert doesnt trade on mondays and before 2 hour on other trade days. You can test and optimize for all pairs with extern parameters. Do not purchase without

Psr1 EA is the one of Psr series EAs. It works on 5 minutes chart only. You can use this EA any currencies but you should optimize first. Default parameters belongs to my broker databases EURUSD M5 . It uses pivot and 2 main moving averages. Moving averages can be adjustable by user. ( for optimizing ) Input Parameters: MagicNum: Expert will use this number to determine experts orders. Lots: Lots amount which you want to use. Default is 0.01 ( it can be cahnged by expert due to your broker's

Psr3 EA is the one of Psr series EAs. It works on 5 minutes chart only. You can use this EA any currencies but you should optimize first. Default parameters belongs to my broker databases EURUSD M5 . It uses pivot and Support/Resistance Levels. Stoploss and Takeprofit can be adjustable by user. ( for optimizing ) Input Parameters: MagicNum: Expert will use this number to determine experts orders. Lots: Lots amount which you want to use. Default is 0.01 ( it can be cahnged by expert due to you

Indicator values are in the range 0-100.
The greater is the indicator value, the greater is the market stability,
so the more likely we have trend.
The smaller is the indicator value - the less probable the trend is.
Tips:
Trading on unstable market:
Buy, when moving average (blue line) of the CMI indicator is below 40 and the histogram is red.
Sell when moving average (blue line) of the CMI indicator is below 40 and the histogram is green.
Close positions when CMI histogram is

SIGNALINE INDICATOR This indicator for all pairs and all timeframes I have just completed the M5 timeframe for deep optimization EURJPY yet. EURJPY M5 Optimization ( TP=150 , SL=130 , IndicatorPeriod=6 , Mov1=22 , Mov2=48 ) (*)Added 20.05.2019 You can find this signal page below https://www.mql5.com/en/signals/583477 Other optimizasyon results will be added on this signalpage. Input Parameters: IndicatorPeriod: Default is 8. Mov1 : Default is 21. Mov2 : Default is 48.

Expert's signal link has been working on 25 different instruments since 09.07.2019. It will be stopped after a while. https://www.mql5.com/en/signals/605823 This expert advisor works well on daily charts. Opens a pending order based on daily price movements and may revise this pending order based on price movements during the day. It can keep the current order by following the price movements and can open two different types of additional orders as soon as it sees the opportunity. If he sees t

This dashboard is designed and simplified for use on the standard mt4 terminal. There are 1 spread columns and adjustable signal columns for 5 different timeframes. For the signals, I used a special indicator that I developed and called mars. I haven't published the Mars indicator in the market yet. You can use this indicator only as dashboard signals. I'm in preparation for an expert for the indicator, and I will publish it when it's ready. ( Published https://www.mql5.com/en/market/product/40

Marsi Expert is an effective advisor especially at low spread rates. Tested and designed on M5 & H1 chart in EURUSD. There is no input option other than lot selection and Magic number selection. The other settings will be adjusted according to the time period of the chart you will put on the Expert. Advanced versions will be updated with renewed sales price. * Must be tested on demo accounts before using in real account, due to your broker behavior.

Standart "PureDailyEA" 's signal link has been working on 25 different instruments since 09.07.2019. It will be stopped after a while. https://www.mql5.com/en/signals/605823 Differences between Standart " PureDailyEa" and "PureDailyAdvanced" are: 1. Added one more input parameters for fine tuning ( optimizasyon ) 2. Only 5 currencies works together. You can add daily all 25 currencies but experts open orders ( if conditions met ) only five of them. This because margin problem in the small a

Each broker uses different parameters for different currency pairs. In addition, each currency pair has its own price movements. Self-Adjusted EA tolerates many of these differences and provides easy operation. Default parameters are based on variables commonly used by most brokers and can be used for time frames that are in line with the following currency pairs. If your broker does not give a positive result in this criterion, please report it as a comment. The most appropriate result for your

Each broker uses different parameters for different currency pairs. In addition, each currency pair has its own price movements. Self-Adjusted EA tolerates many of these differences and provides easy operation. Begining capital must be at least 1.000 USD. with standart lots amount 0.01. Default parameters are based on variables commonly used by most brokers and can be used for time frames that are in line with the following currency pairs. If your broker does not give a positive result in this c

*This Price for only limited time and limited copy to 1 year rent. **Signal page can be found this link https://www.mql5.com/en/signals/614621 PDADaily Expert Advisor This expert advisor works well on daily charts. Opens a pending order based on daily price movements and may revise this pending order based on price movements during the day. It can keep the current order by following the price movements and can open additional orders as soon as it sees the opportunity. If a re-entry condition

This indicator is produced from the value of two different moving averages calculated with a special formula and the moving average of this value. * This is not just an crossover of two moving averages. You can use this indicator on all time frames, but it is useful for M5 time frame with default parameters. Silver colored line shows the trend; if it is crossing up to zero line trend probably starting at the up direction. You can use crossover silver and red lines to the opposite direction of

FxF is an indicator and shows the possible direction of the trend in the selected time period. If "Lime" line is greater than zero trend is uptrend and "Red" line lower than zero the trend is downtrend in the selected timeframe. You can change bar period and price type on the control panel easily. It can be used for all currencies and time frames. Default settings are: BarPeriod=30, PriceType=MedianPrice.

This indicator shows you reversal levels for trade. You can also use it as an exit indicator for your regular trades. It is useful if you use this indicator on H4 charts. There is no input parameters. It is using price actions to generate reversal levels. test it with your regular trade systems and see the difference It can be use multi time frames and multi currencies.

Standart MACD indicator but All parameters can be changed for users. Extern Inputs: FastMA method : Simple, Exponential, Smoothed and Linear Weighted FastMA Price : Close, Open, Low, High, Median, Typical and Weighted FastMA count : Default is 12 SlowMA Method : Simple, Exponential, Smoothed and Linear Weighted SlowMA Price : Close, Open, Low, High, Median, Typical and Weighted SlowMA Count : Default is 26 Draw Mode : Line or Histogram SignalMA Method : Simple, Exponential,

Moving Average of Momentum This indicator shows you trend and also how strenght it is together. You can use this indicator for your own experts with iCustom() Momentum is in the buffer ( 0 ) and moving average is in the buffer ( 1 ) there are afew parameters for using this indicator on different currencies and different time frames. you can test it and optimize it . Input Parameters: MomentumPeriod: default is 40 SignalMaPeriod : default is 28 SignalMAMode : default is SSMA

Moving Averages Of ATR This indicator shows you Average of Average true Range. You can use this indicator for your own experts with iCustom() ATR is in the buffer ( 0 ) and moving average is in the buffer ( 1 ) there are afew parameters for using this indicator on different currencies and different time frames. you can test it and optimize it . Input Parameters: ATRPeriod: default is 13 SignalMaPeriod : default is 28 SignalMAMode : default is SSMA

Nexxt Indicator This indicator shows you trend and also how strenght it is together. You can use this indicator for your own experts with iCustom() BlueBuffer is in the buffer ( 0 ) and GoldBuffer is in the buffer ( 1 ) there are afew parameters for using this indicator on different currencies and different time frames. Best Results are in M15 , H1 and H4 ( depends on currencies ) you can test it and optimize it . Input Parameters: Nexxt1: default is 7 Nexxt2: default is 14

Nexxt2 Indicator This indicator shows you trend and also how strenght it is together. You can use this indicator for your own experts with iCustom() BlueBuffer is in the buffer ( 0 ) and GoldBuffer is in the buffer ( 1 ) Strategy can be like this; Blue and Gold cross till Blue touch to level 1 or -1. These levels show us must be ready close position. It depends on you. there are afew parameters for using this indicator on different currencies and different time frames. Best Results are in H4 (
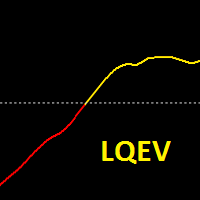
LINEAR QUADRATIC ESTIMATION OF VELOCITY OSCILLATOR Linear quadratic estimation (LQE) is an algorithm that generates predictions of unknown variables observed over time using statistical noise and other inaccuracies and predicts a single measurement more accurately than those based on it. linear quadratic estimation of velocity oscillator shows trend. You can use this oscillator all pairs and on all timeframes. Better results are H1 and H4.

Kalman Filter Velocity Oscillator Kalman filter is an algorithm that uses a series of measurements observed over time, containing statistical noise and other inaccuracies. The filter was originally designed to work with noisy data. Also, it is able to work with incomplete data. Another advantage is that it is designed for and applied in dynamic systems; our price chart belongs to such systems. This Oscillator works all pairs, all timeframes, on separete windows and zero based oscillator.
Trend Direction Estimation * Please use the free demo before renting or buying. This indicator works in all kinds of frames and presents you the trend in the time period you choose. This trial period (Rental for 1 month) offered for promotion is valid for a limited number of copies. At the end of the trial period, longer term rental and unlimited purchase options will also be opened in it's new prices. My expert advisor work is continuing for the strategies I have been developing for the Trend

Trend Direction Arrows * Please use the free demo before renting or buying. This indicator works in all kinds of frames and presents you the trend in the time period you choose. You can try to enter the bars in the bars where the arrows are formed or it helps you to understand the trend direction in the time period you look at. This trial period (Rental for 1 month) offered for promotion is valid for a limited number of copies. At the end of the trial period, longer term rental and unlimited pu

Moving Averages Of Rsi This indicator shows you Average of Relative Strenght Index. You can use this indicator for your own experts with iCustom() RSI is in the buffer ( 0 ) and moving average is in the buffer ( 1 ) there are afew parameters for using this indicator on different currencies and different time frames. you can test it and optimize it . Input Parameters: RsiPeriod: default is 14 SignalMaPeriod : default is 28 SignalMAMode : default is SSMA

Moving Averages Of Cci This indicator shows you Average of Commodity Channel Index. You can use this indicator for your own experts with iCustom() CCI is in the buffer ( 0 ) and moving average is in the buffer ( 1 ) there are afew parameters for using this indicator on different currencies and different time frames. you can test it and optimize it . Input Parameters: CciPeriod: default is 14 SignalMaPeriod : default is 28 SignalMAMode : default is SSMA
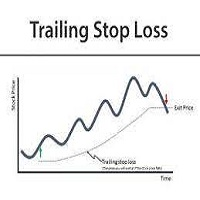
TrailingStopLoss
This tool applies trailingstoploss to orders opened manually or opened by an expert. * For testing on demo it will be open only one buy order so you can see how trailing stop works. It doesnt open orders itself in real or demo accounts but manage your opened orders .
It is simple to use.
Input Parameters
Stoploss calculation level : default is 5, stoploss will be calculation after 5 pips from opening price.
Stoploss movement step : default is 5, Once stop loss is activated,
The price fluctuates. Just like planets oscillating in a star system. The wavelength of the oscillations depends on gravity in the center and other factors in the system.
You can benefit from these oscillations with this expert advisor in the market.
It is an expert advisor suitable for beginners with simple usage inputs. Stoploss Calculation Level: Stoploss Begins after breakeven in points
Stoploss Movement Step: Step points after stoploss works.
Minimum Start Level in Points: Minimum strat lev
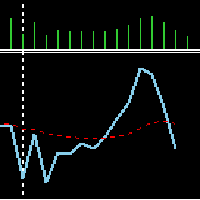
Volume MA This indicator shows selected period of volume and it's moving averages. Easy to use has nothing complicated. It has two parameters input. Volume period: Default is 9 Signal MA: Default is 21 If the blue line is rising, there is an increase in the volume within the selected period. If it is the opposite, it is falling. The dashed Red line shows the moving average of the volume values within the selected period.
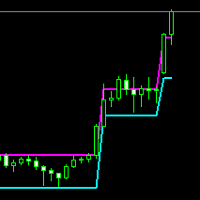
ATRenko Indicator
ATRenko is an indicator and I think it works better on the daily chart. Indicator draws 2 lines; Upper band line and lower band line.
If the price is between two bands, it means that there is no trend or the previous trend is continuing and there is a consolidation process. There are two indicator inputs that can be changed by the user.
1. ATRenko Period
It is 10 by default. It determines in how many bars the calculation will be made in the selected timeframe.
2. Katrenko; By
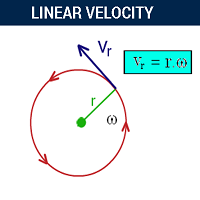
LinearVelocity Indicator
Velocity is Distance/Time where Distance is Close-Open basicly. Linear velocity; calculated with tick volume*Velocity in smoothed way. Red line shows LinearVelocity based of zero level in that way. And Magenta line is Moving avrages of LinearVelocity. Final Indicator helps you detecting trend in different timeframes. Default input parameters for M5 timeframe, and you can change them for different timeframes and different pairs. I wish you good profits.

回帰モデルは、観察されたデータに線を当てはめることによって、変数間の関係を記述します。線形回帰モデルは直線を使用しますが、ロジスティックおよび非線形回帰モデルは曲線を使用します。回帰を使用すると、独立変数の変化に応じて従属変数がどのように変化するかを推定できます。
単純な線形回帰を使用して、2 つの量的変数間の関係を推定します。
この指標は、2 つの異なる回帰計算の差と、選択した期間におけるこの差の移動平均を計算します。
したがって、独立変数である価格の将来の見積もりを決定しようとします。
私の実験では、さまざまな時間枠がよりうまく機能し、さまざまなツールにさまざまな入力を使用できることがわかりました。
2 本の線の交点とゼロ点と交差する線の両方を信号として取得できます。
出口戦略はあなた次第です。

LinearRegressionDecomposition ( LRD ) Linear Regression Decomposition has been calculated using a very complex method.
Basically, by examining the retractions of the price movements of the instruments on the Metatrader platform, it is aimed to decompose these movements linearly.
The indicator is shown on the graph with two separate lines.
The red line is our main indicator and handles the price divergence.
The blue line filters the red signal.
For example, for a buy signal to occur: the red line

Keltner Channels are volatility-based bands that are placed on either side of an asset's price and can aid in determining the direction of a trend. The exponential moving average (EMA) of a Keltner Channel is typically 20 periods, although this can be adjusted if desired.( Default is 50 here..)
In the Classic Keltner Channels The upper and lower bands are typically set two times the average true range (ATR) above and below the EMA, although the multiplier can also be adjusted based on personal p
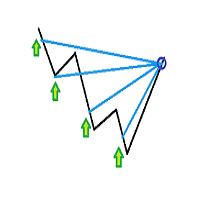
Simple Martingale system EA, You will choose the type of starting order according to the market situation. You will specify the grid range and the take profit value. The Take profit value will be automatically modified according to the number of orders opened and the average opening price. Remember that Martingale systems are always at risk and should be kept under control. Or you must have a large deposit.
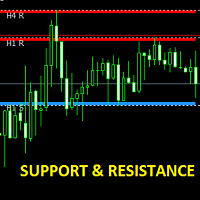
Indicator shows the hourly, 4-hour, Daily, Weekly and Monthly support and resistance zones on the chart you choose. Even if the time frame of the chart changes, the support and resistance zones will continue to be unchanged. It is an indicator that should be kept on the chart of manual trades and shows them the support and resistance zones in the upper time frames.
Volume-weighted average price
In finance, volume-weighted average price (VWAP) is the ratio of the value traded to total volume traded over a particular time horizon (usually one day). It is a measure of the average price at which a stock is traded over the trading horizon. VWAP is calculated using the following formula: *It is shown second screenshot in the screenshots.
trade that takes place over the defined period of time, excluding cross trades and basket cross trades. for more information

A resistance level is the opposite of a support level. It is where the price tends to find resistance as it rises. Again, this means that the price is more likely to "bounce" off this level rather than break through it. However, once the price has breached this level, by an amount exceeding some noise, it is likely to continue rising until meeting another resistance level. A support level is a level where the price tends to find support as it falls. This means that the price is more likely to "b

Woodies CCI is a momentum indicator that was developed by Ken Woods. It's based on a 14 period Commodity Channel Index (CCI) . It's a fully unbounded oscillator with a base value of 0 and has no lower or upper limit. Some traders use the indicator to spot a number of tradable CCI patterns both with and against the trend, such as the zero line reject, the reverse divergence and the trendline break. The 200 level signals an extreme reading. The indicator is often used in combination with other sig

Double Smoothed Price Momentum Oscillator
The Momentum Oscillator measures the amount that a security’s price has changed over a given period of time. The Momentum Oscillator is the current price divided by the price of a previous period, and the quotient is multiplied by 100. The result is an indicator that oscillates around 100. Values less than 100 indicate negative momentum, or decreasing price, and vice versa. Double Smoothed Price Momentum Oscillator examines the price changes in the deter

Switch & Refresh Charts This Script shows all the charts open on your MT4 platform in sequence with a delay of the second you specify, and refreshes the displayed charts if desired.
When it comes to the first chart you started, it waits for the minute you specify and starts the same cycle again.
The file you downloaded is located in the 'Scripts' section and when you come to the graphic you started to finalize, it should be removed from the chart as seen in the screenshot.

The parabolic SAR indicator, developed by J. Wells Wilder, is used by traders to determine trend direction and potential reversals in price. The indicator uses a trailing stop and reverse method called "SAR," or stop and reverse, to identify suitable exit and entry points. Traders also refer to the indicator as the parabolic stop and reverse, parabolic SAR, or PSAR.
The parabolic SAR indicator appears on a chart as a series of dots, either above or below an asset's price, depending on the dir

MyArrow インジケーター Nr:1 このインジケーターは、高値と安値の系列を調べることによって作成された移動平均と、グラフ上のこれらの移動平均から導出されたバンド値を超えることによって受信された信号によって作成されます。 簡単に理解できるように、下向きの矢印は有望な売りシグナルを示し、上向きの矢印は可能性のある買いシグナルを示します。 たくさんのお得... MyArrow インジケーター Nr:1 このインジケーターは、高値と安値の系列を調べることによって作成された移動平均と、グラフ上のこれらの移動平均から導出されたバンド値を超えることによって受信された信号によって作成されます。 簡単に理解できるように、下向きの矢印は有望な売りシグナルを示し、上向きの矢印は可能性のある買いシグナルを示します。 たくさんのお得...

The MyEwo indicator is a tool that helps you to find the short maturity direction in your chart. Default input values are frequently used values in this indicator. You can find and use your own values according to your own trend detection and pairs you will trade.
My advice is to use a moving average in order to understand the long maturity trend on your main graph (200 and higher may be appropriate). The M5 graphics will be simplify Scalping style Trade transactions that you will use . You can

Alan Hull's moving average, more sensitive to the current price activity than the normal MA. Reacts to the trend changes faster, displays the price movement more clearly. My HMA indicator is the developed state of the standard HMA indicator. The indicator is Non Repaint Version. The indicator shown in a separate window is worth the value of -1 to 1. Default entries will give better results in the M15 chart for the parities. With different entry values, you can also get better results in differen

This expert advisor optimized especially for XAU USD or GOLD. You can also use it other currencies and insturments. Optimized parameters for M5 time frame in XAU USD, ecn broker, low spread and low commission. Other successful results can be found M15 , H1 and H4 timframes with different settings. I will add other timeframe settings later. * Before the strategy test, ensure that the data in your platform's history is reliable.

Ease of movement is a momentum indicator that demonstrates the relationship between the rate of change in an asset’s price and its volume. It is intended for the daily chart and larger timeframes. As its name implies, the larger the magnitude of the indicator – the “easier” the movement in price – the more robust the trend is believed to be. A larger positive value indicates price moving upward on disproportionately low volume. Conversely, a larger negative value indicates price moving downward

ConquerorEA is an algorithm that I developed according to the basic functions of my simple but reliable strategy based on my experience. Here, I have optimized the Basic version entries that I have made available to you for the M15 Timeframe of GBPUSD parity. You can test your own optimization using the Free Demo option with your own data that you believe to be more reliable. The starting price has been kept at a minimum for 1 year of use for now. This price will increase over time. more suitab

BSA indicator is a ZigZag based indicator. This indicator is used to find the reversal level of the price. You can use the existing risk ratio and calculation timeframe in the entries by optimizing them according to your usage preference. In lower time frames, the indicator can repaint. For healthier results, you can detect the least repainting by observing for a while according to the graphic you will apply.

This Expert Advisor is a specially designed version of my previously published ConquerorEA product for WTI Light Crude Oil CFD. As you know, since CFDs have slightly different features than other forex parities, not all Expert Advisors give exactly the desired results in CFDs. For this reason, I have decided to republish the algorithms of my ConquerorEA product with the most appropriate optimization possible for WTI Light Crude Oil CFD.
Although this EA can be used on all instruments (it has

ConquerorProEA は、私の経験に基づいたシンプルだが信頼できる戦略の基本機能に従って開発したアルゴリズムです。
ここでは、EURUSD パリティの M15 タイムフレームで利用できるようにしたデフォルト バージョン エントリを最適化しました。
無料デモ オプションを使用して、より信頼できると思われる独自のデータを使用して、独自の最適化をテストできます。
この価格は期間限定で、時間の経過とともに値上がりします。
他の通貨ペアと時間枠では、より適切な結果が見つかります。
フリーランスのセクションから個人の仕事を開いて、自分のニーズに合わせて改善したいことをリクエストできます。
幸運を... Wish you Good Luck

ZigZagSpeed indicator measures the rate of formation of zig and zag over time calculated by the known zig zag indicator. The calculation system is simply calculated by dividing the difference in pips by the number of bars elapsed in the selected time frame. The speed measurements that occurred in the past period will also be displayed on the graph together with the date of occurrence. Velocity numbers are located above or below each zig and zag formation in white. The number shown in yellow rep
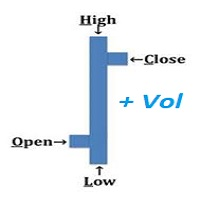
An "Intraday" indicator makes no sense anymore above H1 !! VOHLC is calculated using the following formula: VOHLC= ( Price * Volume ) / Volume Where Price= ( Open + High + Low + Close ) / 4 Volume= Tick Volume This indicator helps us to understand the current direction of the trend in the selected period. Typically, the indicator is calculated for one day, so there is no reason to use it on timeframes larger than the H1 timeframe.
BARS4 エキスパートアドバイザー この Expert Advisor には、トレンディング アルゴリズムとフィルタリングされたスキャルピング アルゴリズムが含まれています。 EA で組み合わされたこれら 2 つのアルゴリズムは、私が外国為替商品のために開発した、株式市場で何年も使用してきたトレーディング戦略の形式です。 アルゴリズムの詳細については説明しません。 以下に、いくつかのツールと異なる期間およびそれらのセット ファイルで成功した戦略テストの例 (スクリーンショットでテスト結果を見つけることもできます) を見つけることができます。 EA の入力は、異なる値を持つユーザーによる戦略テストの試みに開かれています。 これらのエントリは、完全に簡略化された形式で利用できます。
ロットサイズ: デフォルトで 0.01 距離: デフォルトで 15 ProfitFactor: デフォルトで 45 さまざまなブローカーがさまざまな条件 (スプレッド、レバレッジなど) で取引を提供しているため、提供される最適化の結果は、ブローカー会社が提供する条件に適していない場合が

MOST インジケーターは、他のプラットフォーム、特に株式や指数で使用されている非常に人気のあるインジケーターです。基本は移動平均と高値と安値のレベルです。株式および指数の場合はパーセント入力を 2、外国為替商品の場合は 1 ~ 1.5 を使用するのが適切な場合があります。楽器ごとに独自の調整を行うことができます。使いやすく、シンプルで分かりやすいインジケーターです。 1時間足チャートや日足チャートでよく見られます。今のところMT4プラットフォーム向けにのみ編集していますが、MT5向けのリクエストがあれば、将来的に公開する予定です。 MOST インジケーターは、他のプラットフォーム、特に株式や指数で使用されている非常に人気のあるインジケーターです。基本は移動平均と高値と安値のレベルです。株式および指数の場合はパーセント入力を 2、外国為替商品の場合は 1 ~ 1.5 を使用するのが適切な場合があります。楽器ごとに独自の調整を行うことができます。使いやすく、シンプルで分かりやすいインジケーターです。 1時間足チャートや日足チャートでよく見られます。今のところMT4プラットフォーム向けにの

ORDER BLOCKS REVERSAL
Reversal Trading involves identifying points where an asset's price direction changes, capitalizing on potential profits from such shifts. Spotting reversals requires analyzing price patterns and volume indicators.
Key indicators include moving averages, RSI, and MACD, which help traders predict potential trend shifts. This indicator show us potential reversal points using ORDER BLOCKS.
While Reversal Trading offers potentially high reward opportunities by entering earl

PriceRunner MT5 The PriceRunner indicator is based on pure relative power. It gives promising results even in M1 timeframes in currency pairs and M2 in commodities and cryptos. The indicator is designed with user-friendly and simple settings. It is very suitable even for beginners who are interested in indicators and strategies. I am ready to make improvements on the indicator in line with the needs of those who buy or rent. However, even in its current state, you can see very promising results