Bar Status 9 TFs
- インディケータ
- バージョン: 3.0
- アップデート済み: 9 7月 2023
- アクティベーション: 5

すべての主要な時間軸におけるバーの方向を示します。
視覚的信号の意味 (四角):
- 赤: 終値が始値より低い: Close < Open;
- 緑: 終値が始値より高い: Close > Open;
- 青: 終値が始値と等しい: Close = Open;
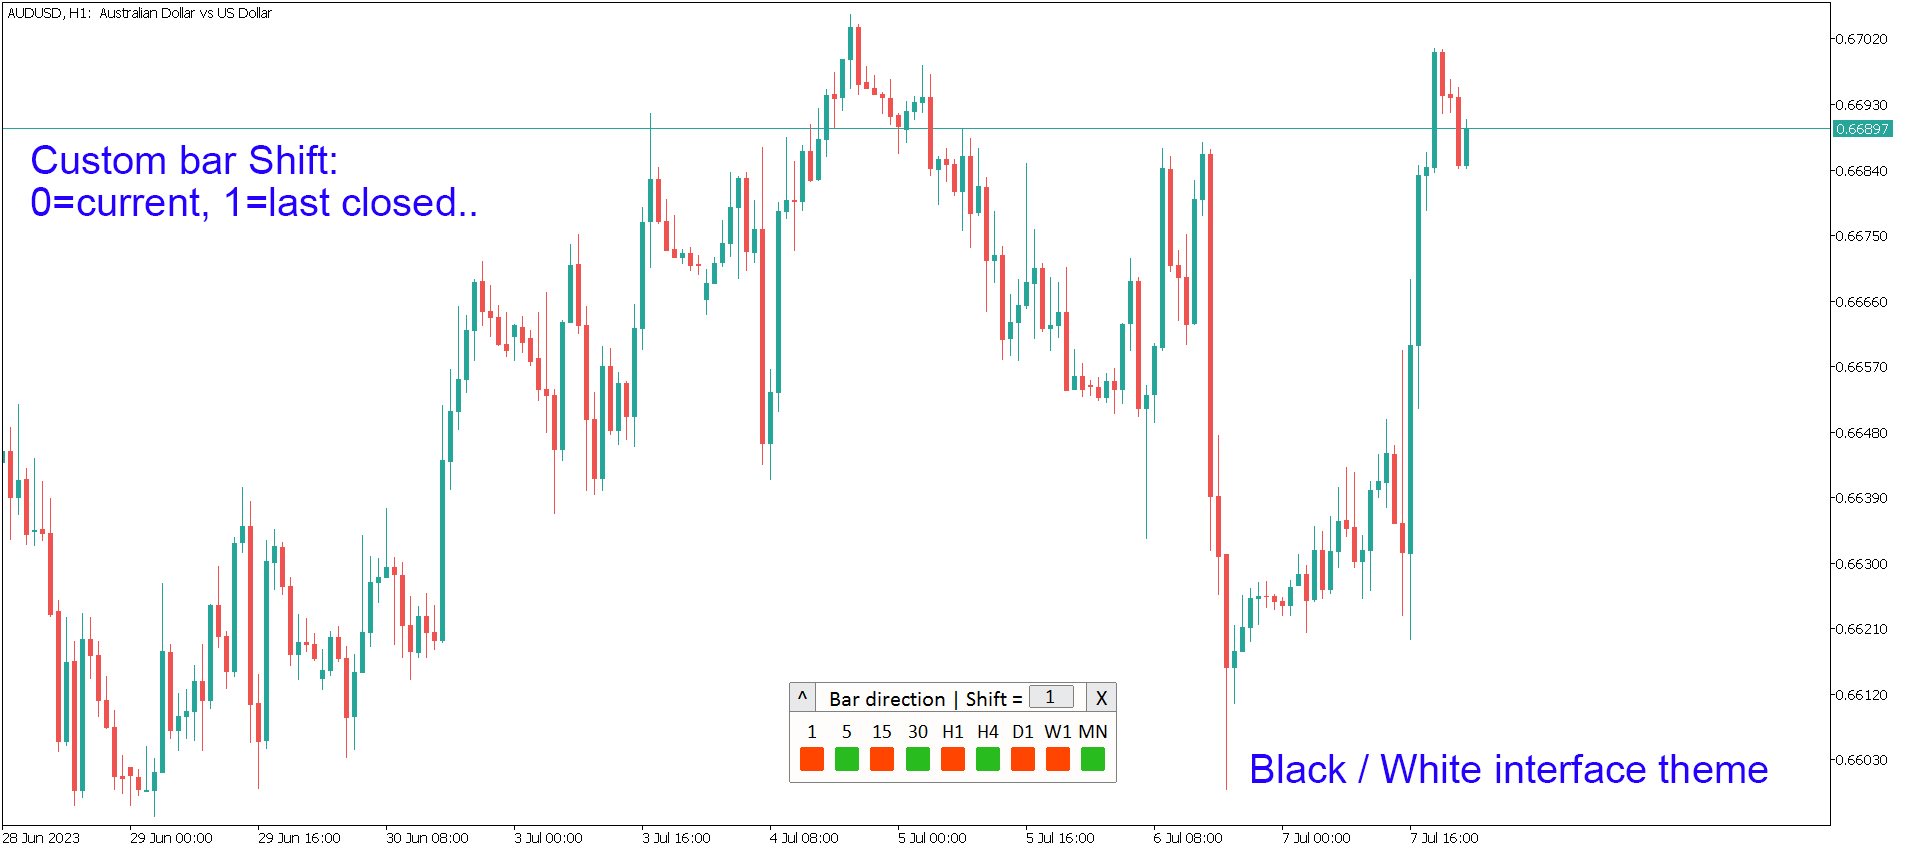
計算バーの シフト を現在のバーに対して設定できます:
- Shift = 0: 現在の(未確定)バーの方向,
- Shift = 1: 最後に確定したバーの方向(前のバー),
- Shift = 2: 現在から2本離れたバー、など...
このインジケーター:
- 市場の全体的なトレンドを確認するのに役立ちます;
- バイナリーオプション取引に便利です;
- 修正的な動きを見つけるのに便利です;
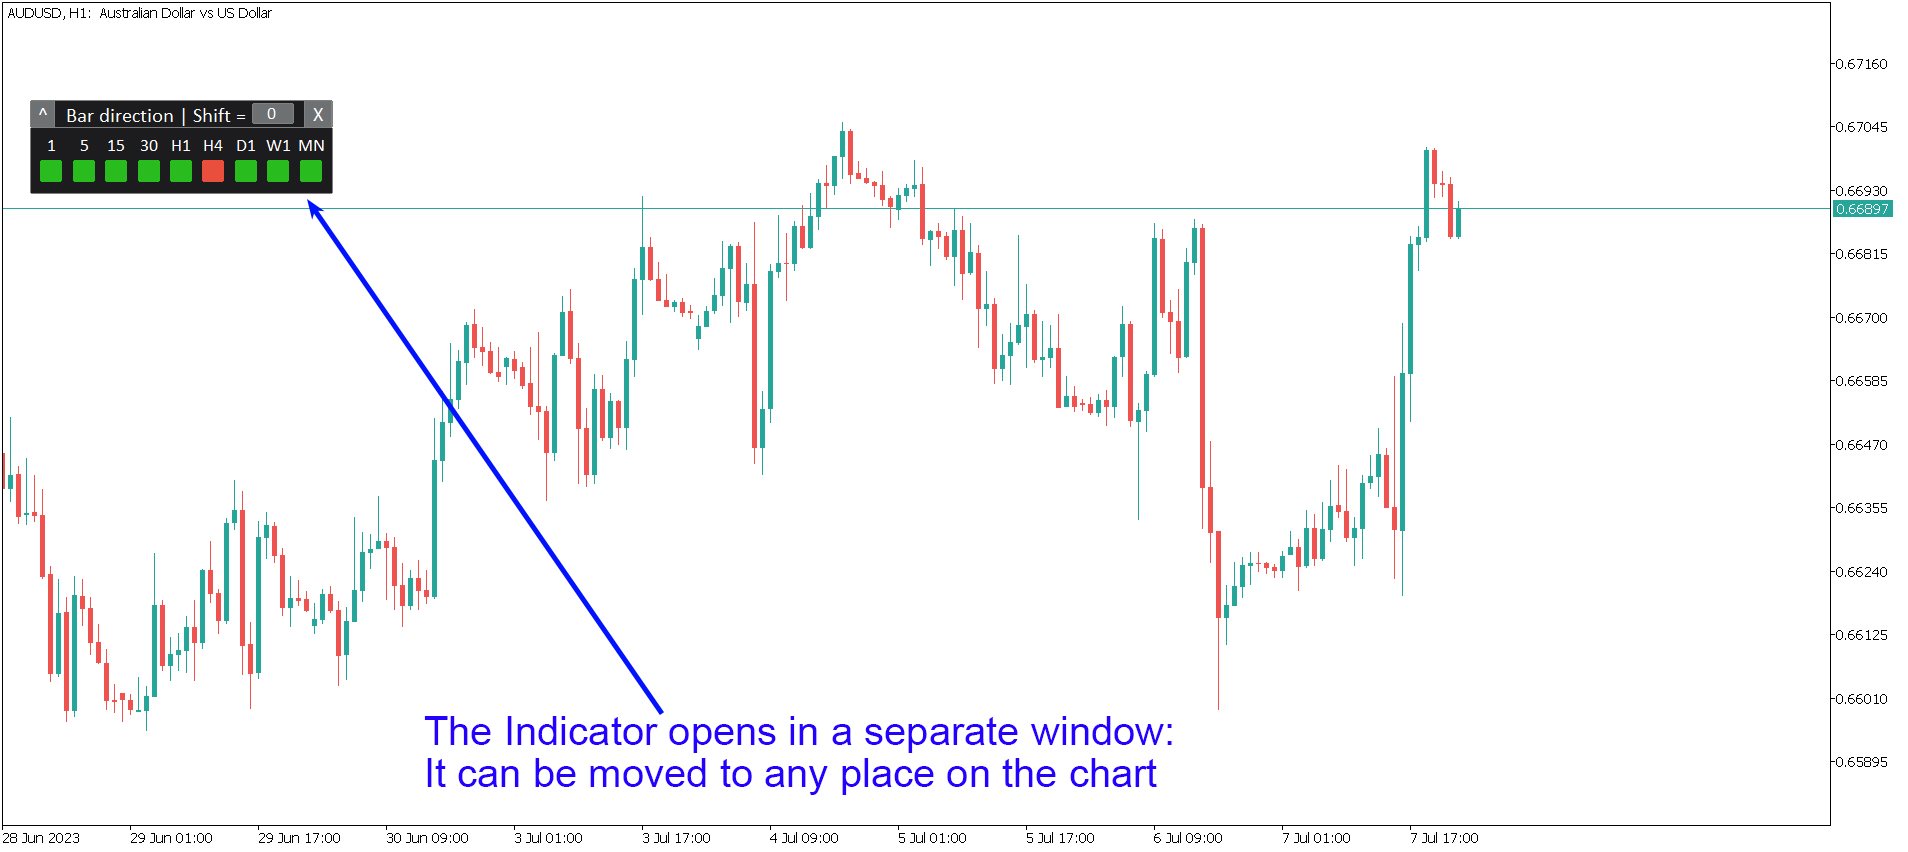
インジケーターは別ウィンドウで開きます:
- ウィンドウ はドラッグして チャート上の任意の場所に移動できます: どこでもドラッグ可能;
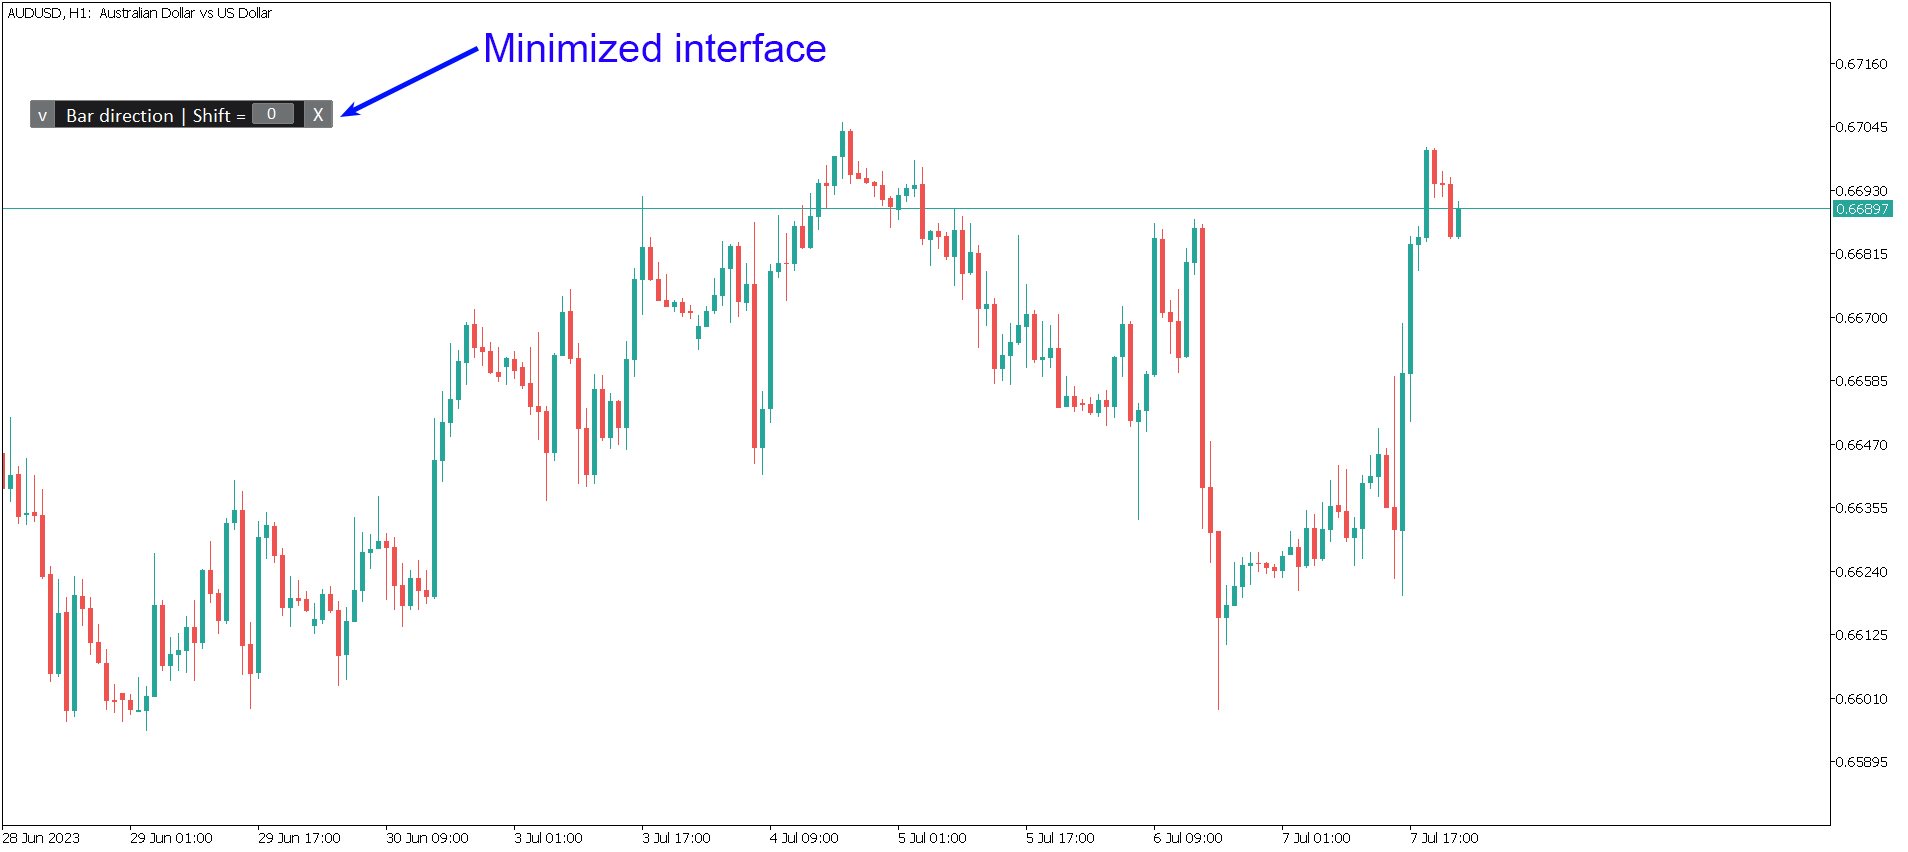
- ウィンドウはスペースを節約するために最小化も可能: [^] ボタン;
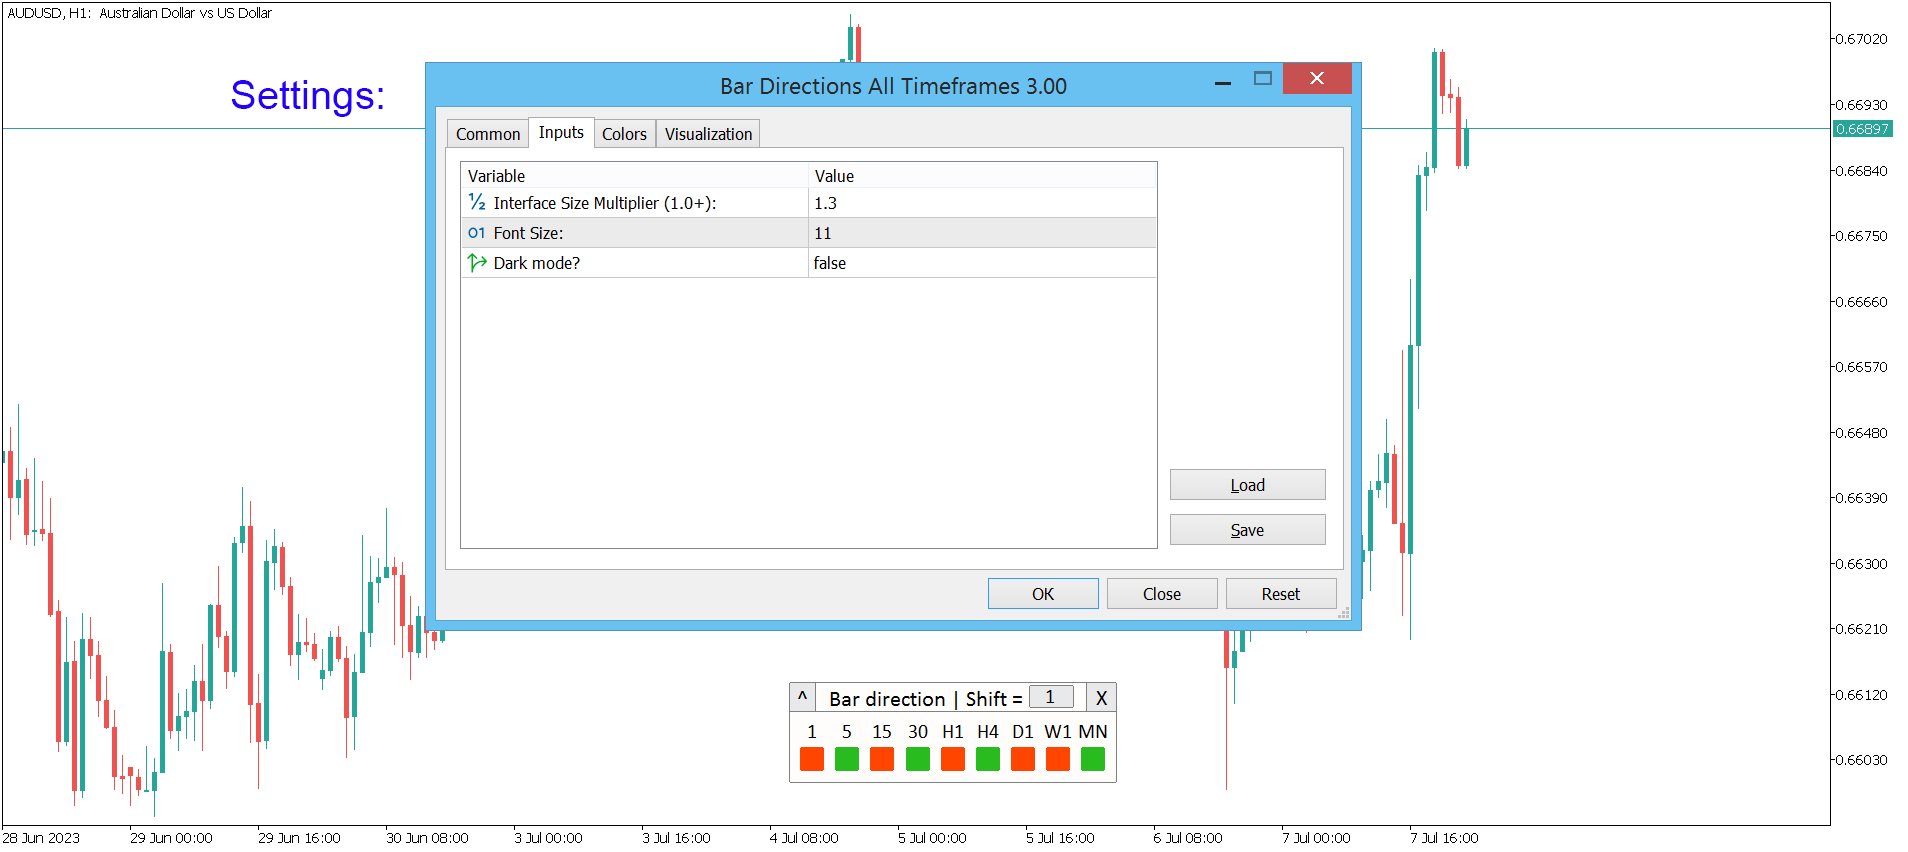
インジケーターの設定で以下を調整できます:
- ダーク / ライトインターフェーステーマ;
- インターフェースサイズの倍率;
- フォントサイズ;
プログラムファイルは"Indicators"ディレクトリに配置する必要があります。