MACD The Factor
- インディケータ
- バージョン: 1.10
- アップデート済み: 16 8月 2021
- アクティベーション: 5

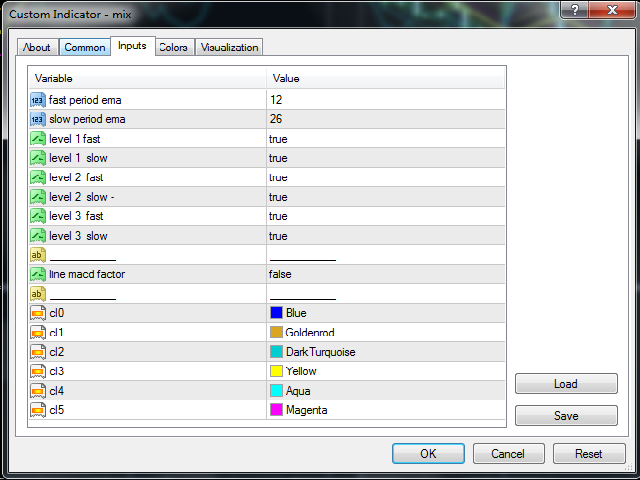
MACD FACTOR!
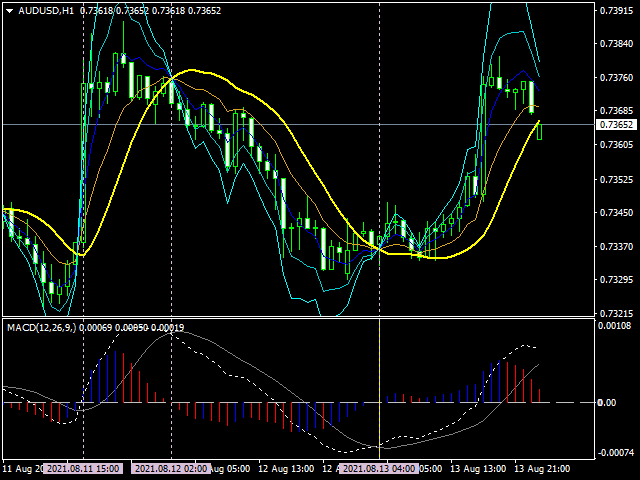
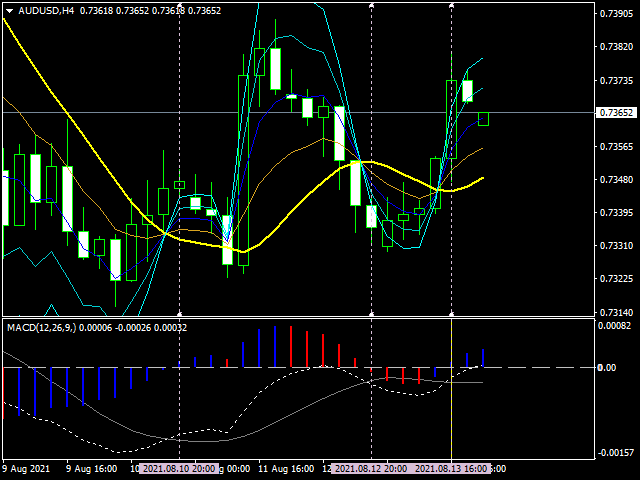
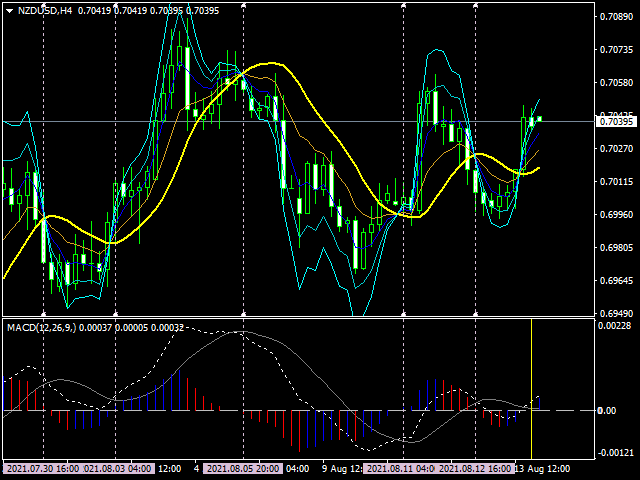
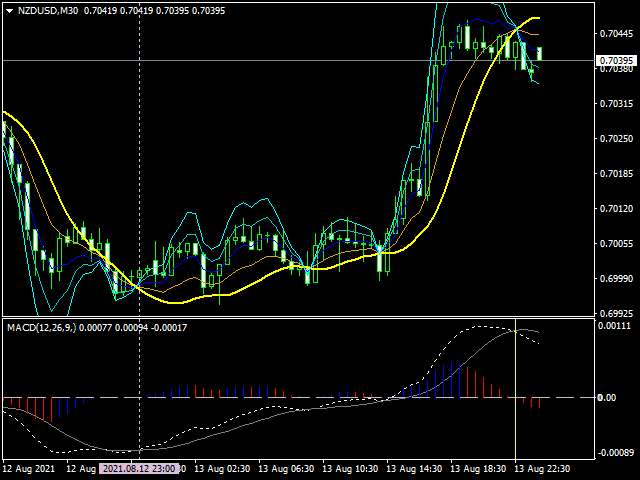
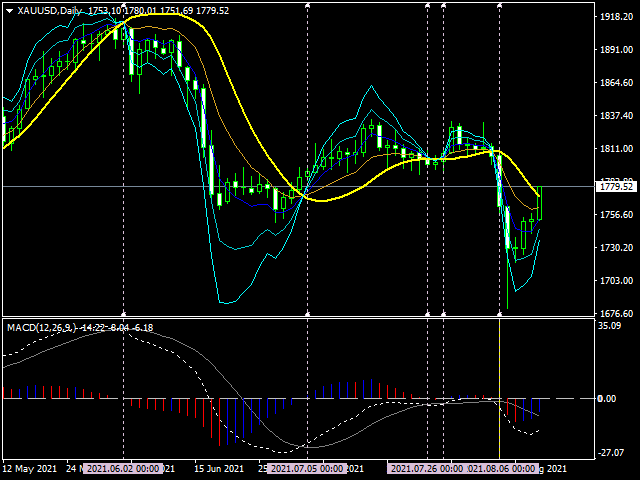
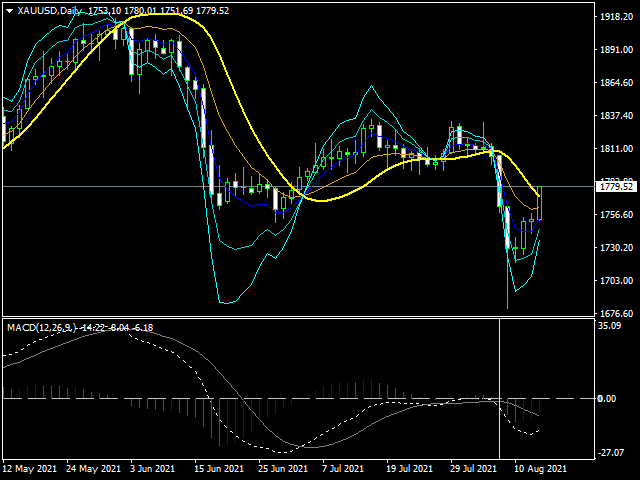
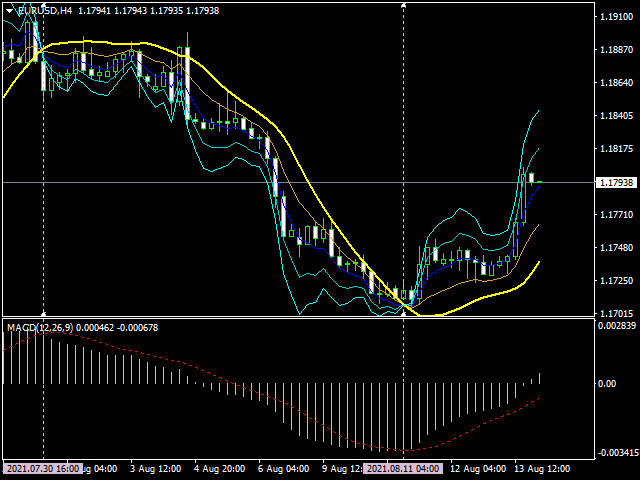
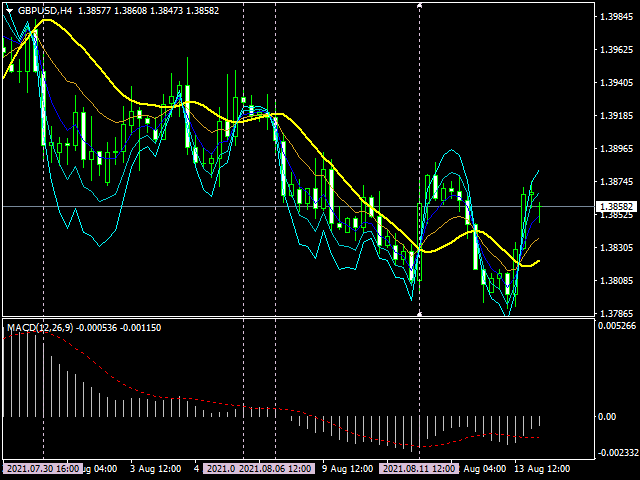
Macd factor is amazing!...it draws multi lines of its own factor of macd(12,26,9) on the chart! not on separate windows as normally macd (12,26,9) it is.
It is not 12,26 of EMA's on that chart ... it is now really different! ...
It has 6 difference lines + 1 line of it own factor line ..
You can examine every each of the lines cross over of each other at the specific time and price while at the same time, the main line of macd (12,26,9) cross over the signal line of macd(12,26,9) at separate windows, wherever it is, it must cross synchronously with macd(12,26,9) along the chart.
The horizontal silver dot lines in the picture , I draw it myself to proof...
The file name is mix.ex4