Araz Pressure MT5
- インディケータ
- バージョン: 1.0
- アクティベーション: 5

There is a very simple rule
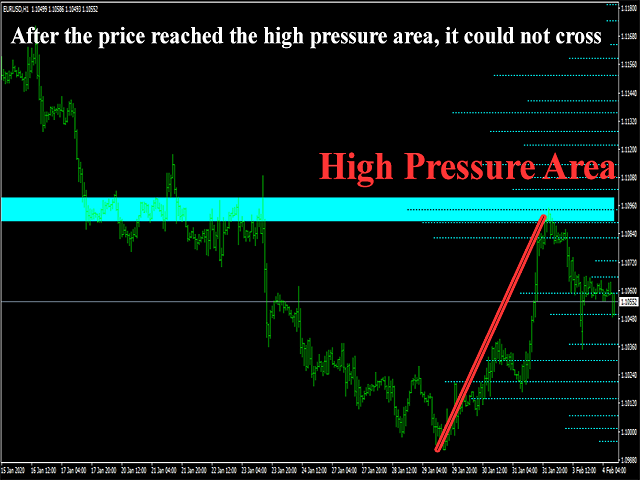
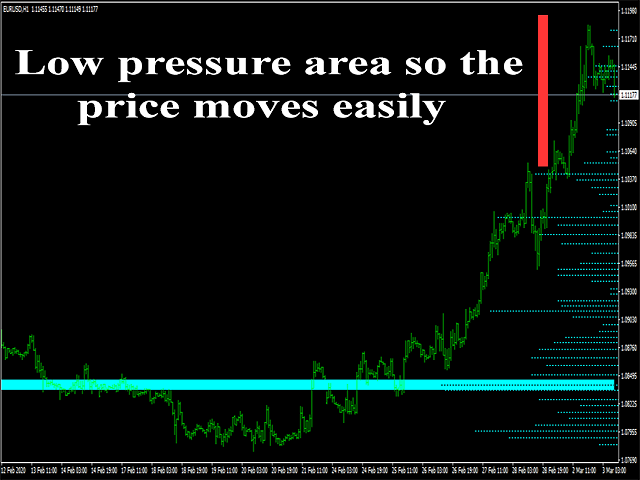
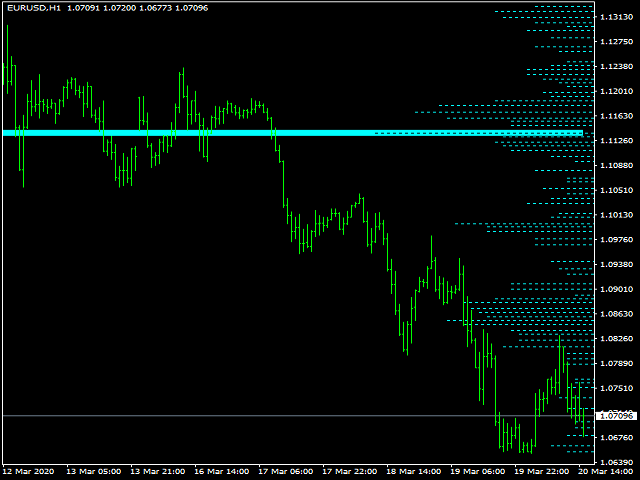
It is Always difficult to cross high pressure areas and easy to cross low pressure areas
This is definitely true for price
It was so simple, it was not!
So let's get started
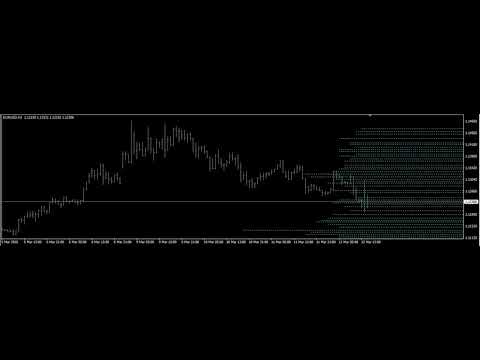
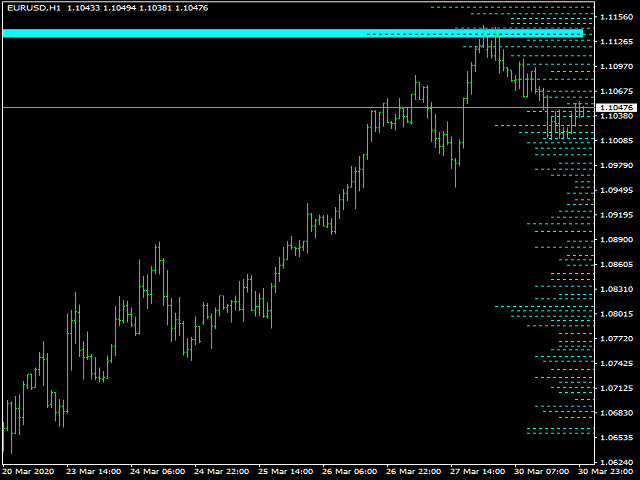
This indicator shows you the amount of pressure in that area according to the bars that it shows.
- The longer the bar, the higher the pressure in that area
- It also marks the most pressed area with a rectangle
From now on you can simply decide on the price move