Make Your Own TimeFrame

Would you like to set up the best time that fits your trading style? This indicator gives you this solution with ease.
  • 1 minute, 2, 3, 10 or whatever you want, now you can have them all with a simple external window indicator.
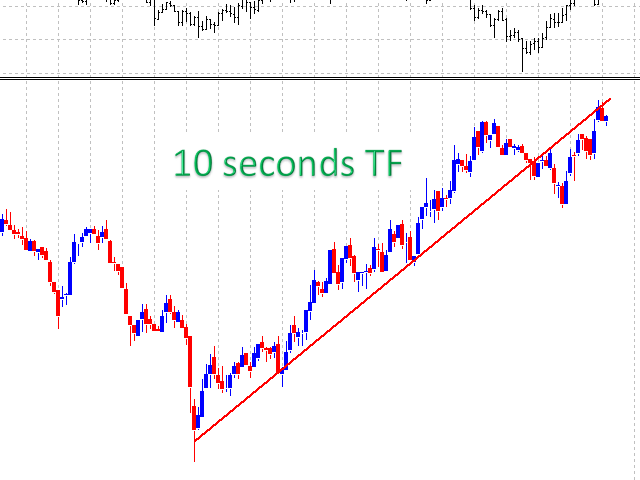
  • 5 seconds, 10, 30 or whatever seconds you want, now you can have those charts.
  • You can visualize different timeframes when Backtesting strategies.
  • The trading system is suitable for experienced traders and beginners.
  • The charts can be used for manual trading (short-term or long-term trading), scalping or binaries.

Features

  • All default Timeframes

  • Customizable minutes. 

  • Timeframes based on Seconds.

  • Simple format settings

  • Easy to use, only attach the indicator to the chart.

  • Optimized, high speed; it can be backtested within all the timeframes

  • No repaintings (timeframes using seconds cannot be plot initially, the indicator needs to be running)


How to Use it:

Step 1.- Attach the indicator and select the time frame that suits you best.


Indicator Parameters:

  • Type Timeframe: The type of Timeframe you will be using; there are 3 types: "Default" to use default Metatrader timeframes; "Minutes" to use a customizable value of minutes; and "Seconds" to use a customizable value of Seconds.
  • Default Timeframes: If Default Type is selected, here you can select the Timeframe you want to show.
  • Minutes Custom Value: If Minutes Custom is selected this number will be the number of minutes used in the custom timeframe.
  • Seconds Custom Value: If Seconds Custom is selected this number will be the number of seconds used in the custom timeframe.
  • Maximum initial Minutes (for custom only): When we use custom minutes timeframe, we need an initial number of previous minutes for the first initial plot.


おすすめのプロダクト
VR Cub
Vladimir Pastushak
VR Cub は、質の高いエントリーポイントを獲得するためのインジケーターです。このインジケーターは、数学的計算を容易にし、ポジションへのエントリーポイントの検索を簡素化するために開発されました。このインジケーターが作成されたトレーディング戦略は、長年にわたってその有効性が証明されてきました。取引戦略のシンプルさはその大きな利点であり、初心者のトレーダーでもうまく取引することができます。 VR Cub はポジション開始ポイントとテイクプロフィットとストップロスのターゲットレベルを計算し、効率と使いやすさを大幅に向上させます。取引の簡単なルールを理解するには、以下の戦略を使用した取引のスクリーンショットを見てください。 設定、設定ファイル、デモ版、説明書、問題解決方法は、以下から入手できます。 [ブログ] レビューを読んだり書いたりすることができます。 [リンク] のバージョン [MetaTrader 5] エントリーポイントの計算ルール ポジションをオープンする エントリーポイントを計算するには、VR Cub ツールを最後の高値から最後の安値までストレッチする必要があります。 最初
Super Reversal Pattern Indicator Unlock the power of advanced pattern recognition with our Super Reversal Pattern Indicator. Designed for traders seeking precision and reliability, this indicator identifies one of the most effective reversal patterns in technical analysis, offering a significant edge in your trading strategy. Key Features: Non-Repainting Accuracy: Enjoy the confidence of non-repainting technology. Once a Super Reversal Pattern is detected, it remains static, providing consiste
Noize Absorption Index - is the manual trading system that measures the difference of pressure between bears forces and bulls forces. Green line - is a noize free index that showing curent situation. Zero value of index shows totally choppy/flat market.Values above zero level shows how powerfull bullish wave is and values below zero measures bearish forces.Up arrow appears on bearish market when it's ready to reverse, dn arrow appears on weak bullish market, as a result of reverse expectation. S
Owl smart levels
Sergey Ermolov
4.24 (37)
MT5版  |   FAQ Owl Smart Levels Indicator   は、 Bill Williams   の高度なフラクタル、市場の正しい波構造を構築する Valable ZigZag、エントリの正確なレベルをマークする Fibonacci レベルなどの一般的な市場分析ツールを含む 1 つのインジケーター内の完全な取引システムです。 利益を得るために市場と場所に。 戦略の詳細な説明 インジケータを操作するための指示 顧問-取引助手 プライベートユーザーチャット ->購入後に私に書いて、私はプライベートチャットにあなたを追加し、あなたはそこにすべてのボーナスをダウンロードすることができます 力はシンプルさにあります! Owl Smart Levels   取引システムは非常に使いやすいので、専門家にも、市場を勉強し始めて自分で取引戦略を選択し始めたばかりの人にも適しています。 戦略と指標に秘密の数式や計算方法が隠されているわけではなく、すべての戦略指標は公開されています。 Owl Smart Levels を使用すると、取引を開始するためのシグナルをすばやく確認し、注
This is a trend indicator without redrawing Developed instead of the binary options strategy (by the color of the Martingale candlestick) Also works well in forex trading When to open trades (binary options) A signal will appear in the place with a candle signaling the current candle It is recommended to open a deal for one candle of the current timeframe M1 and M5 When a blue dot appears, open a deal up When a red dot appears, open a trade down. How to open trades on Forex. When a signal is rec
これは、キャンドルの終値を予測する指標です。 このインジケータは、主にD1チャートでの使用を目的としていますが. この指標は、従来の外国為替取引とバイナリオプション取引の両方に適しています。 インジケーターは、スタンドアロンのトレーディングシステムとして使用することも、既存のトレーディングシステムへの追加として機能させることもできます。 このインジケーターは、現在のキャンドルを分析し、キャンドル自体の内部の特定の強度係数と、前のキャンドルのパラメーターを計算します。 したがって、この指標は、市場の動きのさらなる方向性と現在のキャンドルの終値を予測します。 この方法のおかげで、この指標は、短期の日中取引だけでなく、中期および長期の取引にも適しています。 インジケーターを使用すると、市場の状況の分析中にインジケーターが生成する潜在的な信号の数を設定できます。 インジケーターの設定には、このための特別なパラメーターがあります。 また、インジケーターは、チャート上のメッセージの形式で、電子メールで、およびPUSH通知の形式で、新しい信号について通知することができます。 購入後は必ず私に書いて
Binary Options Assistant (BOA) Multi Currency Dashboard for Binary Options (MT4) . You can use any of the BOA Signals Indicators with the dashboard. Just change the BOA Signals Indicator Name in the dashboard settings to the indicator you want to get signals from. For example: CHILL. BOA_BURN_Indicator_v1   Strategy :   Ana Trader Binary Options Strategy (MACD & Stochastic) BOA_COLD_Indicator_v1   Strategy :  Amalia Trader Binary Options Strategy (Keltner & Stochastic) BOA_CHILL_Indicator_v1  
"The trend is your friend" is one of the best known sayings in investing, because capturing large trendy price movements can be extremely profitable. However, trading with the trend is often easier said than done, because many indicators are based on price reversals not trends. These aren't very effective at identifying trendy periods, or predicting whether trends will continue. We developed the Trendiness Index to help address this problem by indicating the strength and direction of price trend
「Auto FIBO Pro」Crypto_Forex インジケーターは、取引の補助ツールとして最適です。 - インジケーターは、フィボナッチ レベルとローカル トレンド ライン (赤色) を自動的に計算してチャート上に配置します。 - フィボナッチ レベルは、価格が反転する可能性のある重要な領域を示します。 - 最も重要なレベルは、23.6%、38.2%、50%、61.8% です。 - リバーサル スキャルピングやゾーン グリッド取引に使用できます。 - Auto FIBO Pro インジケーターを使用して、現在のシステムを改善する機会も多数あります。 - Info Spread Swap Display があり、接続されている外国為替ペアの現在のスプレッドとスワップを表示します。 - ディスプレイには、アカウントの残高、エクイティ、マージンも表示されます。 - Info Spread Swap Display は、チャートのどのコーナーにも配置できます。 0 - 左上コーナー、1 - 右上、2 - 左下、3 - 右下。 高品質のトレーディングロボットとインジケーターをご覧にな
Laguerre SuperTrend Clouds adds an Adaptive Laguerre averaging algorithm and alerts to the widely popular SuperTrend indicator. As the name suggests, Laguerre SuperTrend Clouds (LSC) is a trending indicator which works best in trendy (not choppy) markets. The SuperTrend is an extremely popular indicator for intraday and daily trading, and can be used on any timeframe. Incorporating Laguerre's equation to this can facilitate more robust trend detection and smoother filters. The LSC uses the impro
SMC Venom Model BPR インジケーターは、スマート マネー (SMC) コンセプトで取引するトレーダー向けのプロフェッショナル ツールです。価格チャート上の 2 つの主要なパターンを自動的に識別します。 FVG   (フェアバリューギャップ) は、3 本のローソク足の組み合わせで、最初のローソク足と 3 番目のローソク足の間にギャップがあります。ボリュームサポートのないレベル間のゾーンを形成し、価格修正につながることがよくあります。 BPR   (バランス価格範囲) は、2 つの FVG パターンの組み合わせで、「ブリッジ」を形成します。これは、価格がボリュームアクティビティの少ない動きで動くときに、ブレイクアウトしてレベルに戻るゾーンで、ローソク足の間にギャップを作成します。 これらのパターンは、大規模な市場プレーヤーと一般参加者の相互作用が発生するチャート上のボリュームと価格動向の分析に基づいて、トレーダーが主要なサポート/レジスタンス レベル、ブレイクアウト ゾーン、エントリ ポイントを識別するのに役立ちます。 インジケーターは、長方形と矢印の形でパターンを視
The Point61 indicator is the result of many years of monitoring of price behavior of currency pairs and metals. It is not a secret, that in times of uncertainty, traders are looking for possible levels of support and resistance - the point, where price should stop its movement. There are 2 possible scenarios at these points: 1. Reverse (correction) to the opposite direction; 2. Breakthrough to continue movement. Very often these points are used to set stop orders - TakeProfit or StopLoss
MetaTrader 4(MT4)用「Two Moving Average Crossover」インディケータは、2本の移動平均線を表示し、移動平均線が交差した際に通知するテクニカル分析ツールです。 このインディケータは、2本の移動平均を計算し、一方が速く、もう一方が遅い移動平均をプロットします。速い方の移動平均が遅い方の移動平均を上回った場合、強気シグナルと見なされ、トレンドの反転や新しい上昇トレンドの開始を示唆します。逆に、速い方の移動平均が遅い方の移動平均を下回ると、弱気 のシグナルとなり、トレンドの反転や新たな下降トレンドの開始を示唆し ます。 このインディケータは、単純移動平均(SMA)、指数移動平均(EMA)、平滑化 移動平均(SMMA)、線形加重移動平均(LWMA)など、異なるタイプの移動 平均を使用するようにカスタマイズすることが可能です。また、トレーダーの取引スタイルや好みに合わせて、各移動平均の期間を調整することができます。 移動平均のプロットだけでなく、クロスオーバーが発生した際にアラートを発 生させます。トレーダーは、クロスオーバーが発生したときに、音声または
The indicator displays the data of the Stochastic oscillator from a higher timeframe on the chart. The main and signal lines are displayed in a separate window. The stepped response is not smoothed. The indicator is useful for practicing "manual" forex trading strategies, which use the data from several screens with different timeframes of a single symbol. The indicator uses the settings that are identical to the standard ones, and a drop-down list for selecting the timeframe. Indicator Paramet
TWO PAIRS SQUARE HEDGE METER INDICATOR Try this brilliant 2 pairs square indicator It draws a square wave of the relation between your two inputs symbols when square wave indicates -1 then it is very great opportunity to SELL pair1 and BUY Pair2 when square wave indicates +1 then it is very great opportunity to BUY pair1 and SELL Pair2 the inputs are : 2 pairs of symbols         then index value : i use 20 for M30 charts ( you can try other values : 40/50 for M15 , : 30 for M30 , : 10 for H1 ,
Magical Arrow
Ranguni Abdulsamir Abdulmajid
Magical Arrow Indicator – Clear & Reliable Signals The Magical Arrow Indicator is a non-repainting, trend-following tool that gives you crystal-clear Buy and Sell signals . It  high-probability reversals and entries . No more guesswork – just follow the arrows on your chart! The Magical Arrow Indicator is a powerful, easy-to-use trading tool that helps you catch the most profitable Buy and Sell opportunities in the Forex market. It is designed for beginners and professional traders , giving y
The Th3Eng PipFinite indicator is based on a very excellent analysis of the right trend direction with perfect custom algorithms. It show the true direction and the best point to start trading. With StopLoss point and Three Take Profit points. Also it show the right pivot of the price and small points to order to replace the dynamic support and resistance channel, Which surrounds the price. And Finally it draws a very helpful Box on the left side on the chart includes (take profits and Stop loss
[ZhiBiCCI]インディケータは全てのサイクル使用に適しており、そして全ての市場品種にも適しています。 [ZhiBiCCI]緑色の実線は強気の発散の逆転です。緑色の点線は古典的な強気の発散です。 [ZhiBiCCI]赤への実線は逆弱気の発散である。赤い点線は古典的な弱気の発散です。 [ZhiBiCCI]はパラメータ(アラート、メール送信、通知送信)で設定でき、(true)に設定するとインスタント信号をアラームウィンドウに送信し、Eメール、インスタントメッセージを送信できます。 パラメータ設定の説明 [displayAlert]:これはアラームスイッチで、trueに設定され、矢印が表示されればプロンプトに自動的に警告され、falseに設定されれば警告されません。 [sendmail_NO_OFF]:これはメールを送信するためのスイッチで、trueに設定します。矢印が表示されていればMT4で設定したメールボックスにメールを送信し、falseに設定されていればメールを送信しません。 [sendnotification_NO_OFF]:これはインスタントメッセージを送信するた
Phase Analytics Pro: Advanced Cyclic Market Analyzer Phase Analytics Pro is a sophisticated technical tool designed for traders who prioritize mathematical precision over lag-heavy traditional indicators. Based on the principles of digital signal processing, this indicator decomposes price action into phase and quadrature components to identify the dominant market cycle. How it works: The algorithm calculates the instantaneous phase of the market, allowing it to distinguish between trending and
トレンドオシレーターは、高度なカスタム Crypto_Forex インジケーター、効率的な取引ツールです! - 高度な新しい計算方法を使用 - パラメーター「計算価格」のオプションは 20 種類。 - これまで開発された中で最もスムーズなオシレーター。 - 上昇トレンドの場合は緑色、下降トレンドの場合は赤色。 - 売られすぎの値: 5 未満、買われすぎの値: 95 以上。 - このインジケーターを使用すると、標準戦略をアップグレードする機会が十分にあります。 - PC およびモバイルアラート付き。 高品質のトレーディングロボットとインジケーターをご覧になるにはここをクリックしてください! これは、この MQL5 Web サイトでのみ提供されるオリジナル製品です。
Crypto_Forex MT4用インジケーター「 RSI SPEED 」は、優れた予測ツールで、リペイント機能はありません。 - このインジケーターの計算は物理学の方程式に基づいています。RSI SPEEDはRSI自体の1次導関数です。 - RSI SPEEDは、主要トレンドの方向にスキャルピングエントリーするのに適しています。 - 適切なトレンドインジケーター(例えばHTF MA(画像参照)など)と組み合わせて使用​​してください。 - RSI SPEEDインジケーターは、R​​SI自体がどれだけ速く方向転換するかを示します。非常に敏感です。 - モメンタムトレード戦略にはRSI SPEEDインジケーターの使用をお勧めします。RSI SPEEDインジケーターの値が0未満の場合は価格モメンタムが下降し、RSI SPEEDインジケーターの値が0を超える場合は価格モメンタムが上昇します。 - インジケーターにはモバイルとPCのアラートが組み込まれています。 高品質のトレーディングロボットとインジケーターをご覧になるにはここをクリックしてください! これは、このMQL5ウェブサイトで
Crypto_Forex インジケーター HTF Ichimoku for MT4。 - Ichimoku インジケーターは、最も強力なトレンド インジケーターの 1 つです。HTF は、Higher Time Frame を意味します。 - このインジケーターは、トレンド トレーダーや、プライス アクション エントリとの組み合わせに最適です。 - HTF Ichimoku インジケーターを使用すると、より高い時間枠の Ichimoku を現在のチャートに添付できます。 - 上昇トレンド - 赤い線が青い線より上 (両方の線が雲より上) / 下降トレンド - 赤い線が青い線より下 (両方の線が雲より下)。 - 価格が Ichimoku 雲の上部境界を突破した場合にのみ、買い注文を開きます。 - 価格が Ichimoku 雲の下部境界を突破した場合にのみ、売り注文を開きます。 - HTF Ichimoku インジケーターを使用すると、大きなトレンドを捉える機会が得られます。 高品質のトレーディングロボットとインジケーターをご覧になるにはここをクリックしてください! これは、この M
An indicator of pattern #31 ("Long Island") from Encyclopedia of Chart Patterns by Thomas N. Bulkowski. The second gap is in the opposite direction. Parameters: Alerts - show alert when an arrow appears   Push - send a push notification when an arrow appears (requires configuration in the terminal) GapSize - minimum gap size in points ArrowType - a symbol from 1 to 17 ArrowVShift - vertical shift of arrows in points   ShowLevels - show levels ColUp - color of an upward line ColDn - color of a
Title : Market Bias Indicator - Oscillator-Based Trading Tool Introduction : Discover the potential of the "Market Bias Indicator," a revolutionary oscillator-based trading tool designed for precise market analysis. If you're in search of a robust alternative to traditional bias indicators, your quest ends here. Market Bias Indicator offers unparalleled accuracy in identifying market sentiment and is your gateway to confident trading decisions. Recommended Trading Pairs : Market Bias Indicator i
Crypto_Forex MT4 用インジケーター「モーニング スター パターン」 - インジケーター「モーニング スター パターン」は、プライス アクション トレーディングに非常に強力なインジケーターです。再描画なし、遅延なし。 - インジケーターは、チャート上で強気のモーニング スター パターンを検出します。チャート上の青い矢印信号 (画像を参照)。 - PC、モバイル、および電子メール アラート付き。 - また、その兄弟である弱気の「イブニング スター パターン」インジケーターも利用できます (以下のリンクに従ってください)。 - インジケーター「モーニング スター パターン」は、サポート/レジスタンス レベルと組み合わせるのに最適です。 高品質のトレーディングロボットとインジケーターをご覧になるにはここをクリックしてください! これは、この MQL5 Web サイトでのみ提供されるオリジナル製品です。
Wave WOLD MT4外国為替インジケータは、Wolf waveを検索し、取引端末の現在のウィンドウに表示するように設計されています。 取引でオオカミの波を使用するトレーダーのための優れた指標。 取引戦略への適用は、効率と収益性を大幅に向上させます。 指標に関する情報 他のWolf wave指標とは異なり、Wave WOLD MT4外国為替指標は、その有効性を大幅に高める多くの機能を備えています: 最初のものは開いているWindows5Pointパラメータ(真の値)情報サポートを提供します。つまり、Wolf waveが登場したチャートのウィンドウを展開します。 たとえば、EURUSD、AUDUSD、GBPUSDチャートが開いていて、それぞれにWave WOLD MT4インジケーターがインストールされている場合、ユーロモデルが検出されると、対応するチャートが自動的に他のチャートの上に前景に表示され、多数の商品を取引するときに非常に便利になります。  2番目の機能は、ユーザーが自分で選択できるパラメータ(デフォルト設定(12,26,9))であるmacd上の組み込みの発散分析です。
の紹介     Quantum平均足PRO チャート 市場のトレンドに対する明確な洞察を提供するように設計された平均足キャンドルは、ノイズを除去し、誤ったシグナルを排除する能力で知られています。混乱を招く価格変動に別れを告げ、よりスムーズで信頼性の高いチャート表現を導入しましょう。 Quantum Heiken Ashi PRO を真にユニークなものにしているのは、従来のローソク足データを読みやすい色のバーに変換する革新的なフォーミュラです。赤と緑のバーはそれぞれ弱気トレンドと強気トレンドをエレガントに強調し、潜在的なエントリーポイントとエグジットポイントを驚くほど正確に見つけることができます。 量子EAチャネル:       ここをクリック MT5のバージョン:       ここをクリック この注目すべき指標には、いくつかの重要な利点があります。 明確性の向上: 価格変動を平滑化することで、平均足バーは市場トレンドをより明確に表現し、有利な取引機会を特定しやすくします。 ノイズの削減: 誤ったシグナルを引き起こすことが多い不安定な価格変動に別れを告げます。 Quantum H
Trade Trends Confidently with the Non-Repainting Trend & Arrow Indicator for MT4! Stop missing profitable moves! This powerful indicator helps you: Clearly See the Trend: Easy-to-follow Green/Red lines instantly show you the current market direction (Uptrend/Downtrend). Get Reliable Entry Signals: Accurate Buy/Sell arrows appear precisely when the trend potentially changes. Crucially, these signals are NON-REPAINTING – they appear on bar close and never change afterwards, giving you dependable s
Gvs Undefeated Trend   indicator is designed for trend and signal trading. This indicator generates trend signals.  It uses many algorithms and indicators to generate this signal. It tries to generate a signal from the points with the highest trend potential. This indicator is a complete trading product. This indicator does not need any additional indicators.  You can only trade with this indicator. The generated signals are displayed on the graphical screen.  Thanks to the alert features you ca
Improved version of the free HMA Trend indicator (for MetaTrader 4) with statistical analysis. HMA Trend is a trend indicator based on the Hull Moving Average (HMA) with two periods. HMA with a slow period identifies the trend, while HMA with a fast period determines the short-term movements and signals in the trend direction. The main differences from the free version: Ability to predict the probability of a trend reversal using analysis of history data. Plotting statistical charts for analyzi
このプロダクトを購入した人は以下も購入しています
Miraculous Indicator – ガン・スクエア・オブ・ナインに基づく100%非リペイントのFXおよびバイナリーツール この動画では、FXおよびバイナリーオプションのトレーダー向けに特別に開発された、非常に正確で強力な取引ツールである Miraculous Indicator を紹介しています。このインジケーターがユニークなのは、伝説的な ガン・スクエア・オブ・ナイン と ガンの振動の法則 に基づいている点で、現代の取引で利用できる最も正確な予測ツールの一つとなっています。 Miraculous Indicatorは 完全に非リペイント であり、ローソク足が確定した後にシグナルが変化したり消えたりすることはありません。つまり、見たものがそのまま利用できます。これにより、トレーダーは自信を持ってエントリーおよびエグジットを行うための信頼性と一貫性のある根拠を得ることができます。 主な特徴: ガン・スクエア・オブ・ナインとガン理論に基づいて構築 100%非リペイントのシグナルシステム すべての時間枠(M1、M5、H1、H4、日足、週足)で機能 FXおよびバイナリーオプション取引
Gann Made Easy は、ミスター・ギャンの理論を使用した取引の最良の原則に基づいた、プロフェッショナルで使いやすい外国為替取引システムです。 W・D・ガン。このインジケーターは、ストップロスとテイクプロフィットレベルを含む正確な買いと売りのシグナルを提供します。 PUSH通知を利用して外出先でも取引可能です。 購入後に私に連絡して、取引のヒント、ボーナス、および「GANN MADE EASY」EA アシスタントを無料で入手してください。 おそらく、ギャンの取引手法についてはすでに何度も聞いたことがあるでしょう。通常、ギャンの理論は初心者のトレーダーだけでなく、すでにある程度の取引経験がある人にとっても非常に複雑なものです。なぜなら、ギャンの取引手法は理論的にはそれほど簡単に適用できるものではないからです。私はその知識を磨き、最良の原則を私の外国為替インジケーターに組み込むために数年を費やしました。 このインジケーターは非常に簡単に適用できます。必要なのは、それをチャートに添付し、簡単な取引推奨事項に従うだけです。このインジケーターは常に市場分析の仕事を行い、取引の機会を探しま
M1 SNIPER は使いやすいトレーディングインジケーターシステムです。M1時間足向けに設計された矢印インジケーターです。M1時間足でのスキャルピングのためのスタンドアロンシステムとして、また既存のトレーディングシステムの一部としても使用できます。このトレーディングシステムはM1時間足での取引に特化して設計されていますが、他の時間足でも使用できます。元々、この手法はXAUUSDとBTCUSDの取引用に設計しましたが、他の市場においても役立つと考えています。 インジケーターのシグナルは、トレンドの方向と逆方向に取引できます。インジケーターのシグナルを利用して両方向に取引するのに役立つ特別な取引テクニックをご紹介します。この手法は、特別な動的なサポートとレジスタンスの価格帯を利用することに基づいています。 ご購入後、M1 SNIPER矢印インジケーターをすぐにダウンロードできます。さらに、M1 SNIPERツールのすべてのユーザーに、以下のスクリーンショットに表示されているApollo Dynamic SRインジケーターを無料で提供しています。この2つのインジケーターを組み合わせることで
事前に指標   市場の反転レベルとゾーンを決定し 、価格がそのレベルに戻るのを待って、新しいトレンドの終わりではなく、始まりにエントリーできるようにします。 彼は示す   反転レベル   市場が方向転換を確認し、さらなる動きを形成する場所。 このインジケーターは再描画なしで動作し、あらゆる金融商品に最適化されており、       トレンドラインプロ   インジケータ。 すべての機器に対応する可逆構造スキャナー すべての取引商品を自動的に追跡し、すべての R 反転パターンを即座に識別して、LOGIC AI 信号がすでに存在する場所やその他の有用な情報を表示します。 Logic AI – エントリーポイントを表示するアシスタント 市場参入の最適なタイミングを判断するインテリジェントなシグナル。TPSproSYSTEMアルゴリズムを使用し、価格動向、トレンド、主要参加者の活動を分析します。 LOGIC AI が表示されるということは、市場状況が十分に整い、高い成功確率で取引の決定を下せる状態であることを意味します。 (R1-PRO)モードは、トレンドプロインジケーターからのトレンドの変化
説明書(ロシア語)  /  説明書 (英語)  /  バージョン MT5 主な機能: 売り手と買い手のアクティブなゾーンを表示します。 このインジケーターは、買いと売りの適切な最初のインパルスレベル/ゾーンをすべて表示します。これらのレベル/ゾーンがアクティブになると、エントリーポイントの探索が始まり、レベルの色が変わり、特定の色で塗りつぶされます。状況をより直感的に把握できるように、矢印も表示されます。 LOGIC AI - テンプレートをアクティブ化するときにエントリポイントを検索するためのゾーン(円)の表示 視認性を向上させるため、人工知能を用いて進入ポイントを探索したゾーンを表示する機能が追加されました。 より高い時間枠からのレベル/ゾーンの表示(MTFモード) より長い時間間隔でレベル/ゾーンを表示する機能を追加しました。また、インジケーターに自動トレンド検出機能(   TPSproTREND PRO   )を実装しました。 取引のための個別の専門的なステップバイステップのアルゴリズム このアルゴリズムは、トレンドの方向と逆方向の両方でデイトレードを行うために設計されていま
First 25 copies at $80, after that price becomes $149 (3 copies left) Gold Signal Pro is a powerful MT4 indicator designed to help traders spot strong price reactions in the market. It focuses on clear wick rejections , showing when price strongly rejects a level and often continues in the same direction. Gold Signal Pro is mainly built for scalping gold (XAUUSD) and works best on lower timeframes like M5 and M15 , where timing matters most. That said, it can also be used on any forex pair, a
PRO Renko Systemは、特別にRENKOチャートを取引するために設計された高精度の取引システムです。 これは、様々な取引商品に適用することができる普遍的なシステムです。 システムは効果的に正確な逆転信号へのアクセスを与えるいわゆる市場の騒音を中和する。 表示器は非常に使いやすく、信号の生成に責任がある1つの変数だけがあります。 あなたは簡単にお好みの任意の取引ツールとレンコバーのサイズにツールを適応させることができます。 私はいつもあなたが私のソフトウェアで収益性の高い取引を支援するために余分なサポートを提供する準備ができています! 私はあなたに幸せで収益性の高い取引をしたいです! ご購入後にご連絡ください! 私はあなたに私のレンコチャートジェネレータを送信します。 私はまた、私の個人的な推奨事項やシステムの他のモジュールを無料で共有します!
ゴールドラッシュ・トレンド・アロー・シグナル ゴールドラッシュ・トレンド・アロー・シグナル 指標は、XAU/USDにおける高速・短期スキャルパー向けに最適化された、正確でリアルタイムのトレンド分析を提供します。 1分足専用に設計されたこのツールは、明確なエントリーポイントを示す方向矢印を表示し、スキャルパーが変動の激しい市場状況でも自信を持って取引できるよう支援します。 この指標は、PRIMARY(主要)とSECONDARY(補助)のアラート矢印で構成されています。PRIMARYシグナルは、トレンドの方向転換を示す白と黒の方向矢印であり、SECONDARYシグナルは、PRIMARY矢印が示す方向を確認し、潜在的なエントリーポイントを示す青と赤の矢印です。 注意:トレンド方向の変化後にPRIMARYアラート矢印が1つだけ表示される場合、複数のSECONDARY青/赤矢印が表示される点に注意が必要です。SECONDARYシグナルは、シグナル基準を満たす任意のローソク足後に表示されます。したがって、長期的なトレンド移動の場合、画面に多くのSECONDARY矢印が表示されます(添付の
Trend indicator AI
Ramil Minniakhmetov
4.65 (80)
Trend Ai indicatorは、トレンドの識別と実用的なエントリポイントと反転アラートを組み合わせることで、トレーダーの市場分析を強化する優れたツールです。 この指標は、ユーザーが自信と正確さで外国為替市場の複雑さをナビゲートすることを可能にします トレンドAiインジケーターは、主要なシグナル以外にも、プルバックやリトレースメント中に発生するセカンダリエントリポイントを識別し、トレーダーが確立されたトレンド内の価格修正を活用できるようにします。 重要な利点: *MT4およびMT5の仕事 *明確な買いまたは売りシグナル *再描画しません ·すべての資産で動作します 私はeaやセットをtelegram it詐欺で販売しないように注意してください。 すべての設定はここでブログで無料です。  重要! 指示とボーナスを得るために購入後すぐに私に連絡してください! 私の他のプロダクトと同様、実質操作の監視はここに見つけることができます: https://www.mql5.com/en/users/mechanic/seller&nbsp ; 設定および入力: すべての
Trend Screener
STE S.S.COMPANY
4.79 (95)
トレンドインジケーター、1つのツールに組み込まれたすべての重要なトレンド機能を備えたトレンドトレーディングとフィルタリングのための画期的なユニークなソリューション! これは、すべてのシンボル/商品(外国為替、商品、暗号通貨、インデックス、株式)で使用できる100%再描画されていないマルチタイムフレームおよびマルチ通貨インジケーターです。 期間限定オファー: サポートおよびレジスタンス スクリーナー インジケーターは、たった 50 ドルで永久的にご利用いただけます。(元の価格 250 ドル) (オファー延長) トレンドスクリーナーは、チャート内のドットで矢印トレンドシグナルを提供するインジケーターに続く効率的なインジケーターです。 トレンド分析インジケーターで使用できる機能: 1.トレンドスキャナー。 2.最大利益分析を備えたトレンドライン。 3.トレンド通貨強度メーター。 4.アラート付きのトレンド反転ドット。 5.アラート付きの強いトレンドドット。 6.トレンド矢印 毎日の分析例、毎日のシグナルパフォーマンス...など、トレンドスクリーナーインジケーターを使用して、ここで見つけること
トレンドラインプロ   市場の真の方向転換点を理解するのに役立ちます。この指標は、真のトレンド反転と主要プレーヤーが再び参入するポイントを示します。 分かりますか     BOSライン   複雑な設定や不要なノイズなしに、より長い時間足でのトレンドの変化と重要なレベルを把握できます。シグナルは再描画されず、バーが閉じた後もチャート上に残ります。 VERSION MT 5     -     RFI LEVELS PRO インジケーター と組み合わせることで、その潜在能力を最大限に発揮します。 インジケーターが示す内容: 本当の変化   トレンド(BOSライン) 一度シグナルが現れたら、それは有効です!これは、リペイント機能を持つインジケーターとの重要な違いです。リペイント機能を持つインジケーターは、シグナルを発した後、それを変更し、資金の損失につながる可能性があります。これにより、より高い確率と精度で市場に参入できます。また、矢印が現れた後、目標値(利益確定)に達するか、反転シグナルが現れるまで、ローソク足の色を変更する機能もあります。 繰り返しエントリ       主要プレーヤーの
System Trend Pro - This is the best trend trading indicator!!! The indicator no repaint!!!  The indicator has   MTF   mode, which adds confidence to trading on the trend (   no repaint   ). How to trade? Everything is very simple, we wait for the first signal (big arrow), then wait for the second signal (small arrow) and enter the market in the direction of the arrow. (See screens 1 and 2.) Exit on the opposite signal or take 20-30 pips, close half of it, and keep the rest until the opposite
Full Fledged EA and Alert plus for alerts will also be provided in this offer along with the purchase of Indicator. Limited copies only at this price and Ea too. Grab your copy soon Alert plus for indicator with set file is kept in comment section with the image  SMC Blast Signal with FVG, BOS and trend Breakout The SMC Blast Signal is a Precise trading system for Meta Trader 4 that uses Smart Money Concepts (SMC), including Fair Value Gaps (FVG) and Break of Structure (BOS), to identify high-pr
通貨強さウィザードは、取引を成功させるためのオールインワン ソリューションを提供する非常に強力な指標です。このインジケーターは、複数の時間枠のすべての通貨のデータを使用して、このまたはその外国為替ペアのパワーを計算します。このデータは、使いやすい通貨インデックスと通貨パワーラインの形式で表され、特定の通貨のパワーを確認するために使用できます。 必要なのは、取引したいチャートにインジケーターを接続することだけです。インジケーターは、取引する通貨の実際の強さを示します。このインジケーターは、トレンドに合わせて取引するときに有利に利用できる売買高の圧力の極値も示します。このインジケーターには、フィボナッチに基づく可能なターゲットも表示されます。 このインジケーターは、PUSH 通知を含むあらゆるタイプのアラートを提供します。 購入後ご連絡下さい。私の取引のヒントをあなたと共有し、素晴らしいボーナスインジケーターを無料で提供します! 幸せで有益な取引をお祈りします。
Gold Scalper Super is an easy-to-use trading system. The indicator can be used as a standalone scalping system on the M1 time frame, as well as part of your existing trading system. Bonus: when purchasing an indicator, Trend Arrow Super is provided free of charge, write to us after purchase. The indicator 100% does not repaint!!! If a signal appears, it does not disappear! Unlike indicators with redrawing, which lead to the loss of a deposit, because they can show a signal and then remove it.
Volatility Trend System - a trading system that gives signals for entries. The volatility system gives linear and point signals in the direction of the trend, as well as signals to exit it, without redrawing and delays. The trend indicator monitors the direction of the medium-term trend, shows the direction and its change. The signal indicator is based on changes in volatility and shows market entries. The indicator is equipped with several types of alerts. Can be applied to various trading ins
Presenting one-of-a-kind Gann Indicator for XAUUSD IQ Gold Gann Levels is a non-repainting, precision tool designed exclusively for XAUUSD/Gold intraday trading. It uses W.D. Gann’s square root method to plot real-time support and resistance levels, helping traders spot high-probability entries with confidence and clarity. William Delbert Gann (W.D. Gann) was an exceptional market analyst whose trading technique was based on a complex blend of mathematics, geometry, astrology, and ancient calcul
An exclusive indicator that utilizes an innovative algorithm to swiftly and accurately determine the market trend. The indicator automatically calculates opening, closing, and profit levels, providing detailed trading statistics. With these features, you can choose the most appropriate trading instrument for the current market conditions. Additionally, you can easily integrate your own arrow indicators into Scalper Inside Pro to quickly evaluate their statistics and profitability. Scalper Inside
現在40%オフ 初心者やエキスパートトレーダーに最適なソリューション! このインジケーターは、独自の機能と新しい計算式を取り入れた、ユニークで高品質、かつ手頃な価格のトレーディングツールです。たった1枚のチャートで28の為替ペアの通貨強度を読み取ることができます。新しいトレンドやスキャルピングチャンスの引き金となるポイントを正確に特定することができるので、あなたのトレードがどのように改善されるか想像してみてください。 ユーザーマニュアルはこちら  https://www.mql5.com/en/blogs/post/697384 これが最初の1本、オリジナルだ! 価値のないクローンを買わないでください。 特別な サブウィンドウの矢印で強い通貨の勢いを表示 GAPがあなたのトレードを導く! 基準通貨や気配値が売られすぎ・買われすぎのゾーン(外相フィボナッチレベル)にあるとき、個別チャートのメインウィンドウに警告表示。 通貨がレンジの外側から反落した場合、プルバック/リバーサルのアラート。 クロスパターンの特別なアラート 複数の時間枠を選択可能で、トレンドを素早く確認できます
Pulse Scalping Line - an indicator for identifying potential pivot points. Based on this indicator, you can build an effective Martingale system. According to our statistics, the indicator gives a maximum of 4 erroneous pivot points in a series. On average, these are 2 pivot points. That is, the indicator shows a reversal, it is erroneous. This means that the second signal of the indicator will be highly accurate. Based on this information, you can build a trading system based on the Martingale
PIP STORM シグナル PIP STORM は、高いボラティリティがある相場環境で超高頻度のエントリーを行うために設計された、矢印ベースの高度なシステムです。その主な目的は、遅延したり使い古されたインジケーターに頼ることなく、実行可能なスキャルピングシグナルを継続的に提供することです。予測するのではなく、価格の転換ゾーンに正確に反応し、ミクロなブレイクアウトや流動性の歪みを、ミニマルかつリアルタイムの確認ロジックで捉えます。 最新情報を受け取る 今後のリリースやアップデート情報を受け取るには、公式チャンネルにご参加ください: https://www.mql5.com/en/channels/signalsandindicators スキャルピングの頻度 このツールは静かに使うために作られたものではありません。 PIP STORM は、アクティブな市場においてほぼすべてのローソク足でシグナルを発生させ、現在の方向性を確認したり、重要な押し目や戻りを的確に検出します。 シグナルの見方 視覚的にはシンプルでありながら、動作は非常に強力です: 赤い矢印は売り(SELL
Apollo SR Master は、サポート/レジスタンスゾーンを利用した取引をより容易かつ確実にする特別な機能を備えたサポート/レジスタンスインジケーターです。このインジケーターは、ローカル価格の高値と安値を検出することで、タイムラグなしでリアルタイムにサポート/レジスタンスゾーンを計算します。そして、新たに形成されたSRゾーンを確認するために、インジケーターは特別なシグナルを表示します。このシグナルは、SRゾーンを実際の売りまたは買いシグナルとして考慮して使用できることを示します。この場合、SRゾーンの強度が高まり、SRエリアからの取引が成功する確率も高まります。これがこのインジケーターの基本的な考え方です。 SRゾーンは、ストップロスとテイクプロフィットの設定を容易にします。シグナルの方向に応じて、SRゾーンの上または下のスペースをストップロスとして設定できます。さらに、反対側のSRゾーンは、潜在的なテイクプロフィットエリアとして設定できます。 また、Apollo SRマスターインジケーターをご利用のすべてのユーザーには、「Apollo Price Action System」
このダッシュボードは、選択されたシンボルの最新の利用可能なハーモニックパターンを表示するので、時間を節約し、より効率的に / MT5バージョン 。 無料インジケーター: Basic Harmonic Pattern インジケーター列 Symbol : 選択したシンボルが表示されます。 Trend : 強気または弱気 Pattern : パターンの種類(ガートレー、バタフライ、バット、カニ、サメ、サイファー、ABCD) Entry : エントリー価格 SL: ストップロス価格 TP1: 1回目の利食い価格 TP2: 2回目の利食い価格 TP3: 3回目の利食い価格 Current price : 現在値 Age (in bars):  最後に描画されたパターンの年齢 主な入力項目 Symbols: "28 Major Currency Pairs "または "Selected Symbols "から選択。 Selected Symbols: カンマで区切られた監視したいシンボル("EURUSD,GBPUSD,XAUUSD")。ブローカーがペアに接尾辞または接頭辞を付けている場合
現在40%OFF! 初心者やエキスパートトレーダーのためのベストソリューション! このダッシュボードソフトウェアは、28の通貨ペアで動作しています。それは私達の主要な指標(高度な通貨の強さ28と高度な通貨インパルス)の2に基づいています。それは全体の外国為替市場の大きい概観を与えます。それは、すべての(9)時間枠で28の外国為替ペアのための高度な通貨の強さの値、通貨の動きの速度と信号を示しています。チャート上で1つのインディケータを使用して市場全体を観察し、トレンドやスキャルピングの機会をピンポイントで見つけることができたら、あなたのトレードがどのように改善されるか想像してみてください。 このインディケータには、強い通貨と弱い通貨の識別、潜在的な取引の識別と確認がより簡単になるような機能が搭載されています。このインディケータは、通貨の強さや弱さが増加しているか減少しているか、また、すべての時間枠でどのように機能しているかをグラフィカルに表示します。 新機能として、現在の市場環境の変化に適応するダイナミックなマーケットフィボナッチレベルが追加され、すでに当社のAdvanced
This indicator depends on some secrets equations to draw Signals with Stop loss and maximum 4 Take profits. There is a free EA depends on this indicator as a gift when you purchase/rent it. Features Simply it gives you entry point as Ready sign (Buy / Sell) and arrow (Buy / Sell) after candle closed, also SL line and 4 TP lines or less. Once SL-TP lines are shown with the arrow, they remains as they are until signal change. It is historical indicator. No Repaint. user manual for V5 please click
MetaForecast M4
Vahidreza Heidar Gholami
5 (2)
MetaForecastは、価格データのハーモニクスに基づいて、どんな市場の未来を予測し視覚化します。市場が常に予測可能ではありませんが、価格にパターンがある場合、MetaForecastは可能な限り正確な未来を予測できます。他の類似製品と比較して、MetaForecastは市場のトレンドを分析することでより正確な結果を生成することができます。 入力パラメータ Past size (過去のサイズ) MetaForecastが将来の予測を生成するために使用するバーの数を指定します。モデルは選択したバー上に描かれた黄色の線で表されます。 Future size (将来のサイズ) 予測すべき将来のバーの数を指定します。予測された将来は、ピンクの線で表示され、その上に青い回帰線が描かれます。 Degree (程度) この入力は、MetaForecastが市場で行う分析のレベルを決定します。 Degree 説明  0 Degree 0の場合、価格の全てのピークや谷、そして詳細をカバーするために、「Past size」の入力に大きな値を使用することが推奨されています。  1 (推奨) Degre
ICT(情報通信技術)、SMC(スマートマネーコンセプト)、サポートとレジスタンス、トレンド分析、価格アクション、市場構造、オーダーブロック、ブレーカーブロック、モメンタムシフト、強い不均衡、HH/LL/HL/LH、公正な価値ギャップ、FVG、プレミアム&ディスカウントゾーン、フィボナッチリトレースメント、OTE、バイサイド流動性、セルサイド流動性、流動性の空白、市場セッション、NDOG、NWOG、シルバーバレット、ICTテンプレート 金融市場では、正確な市場分析は投資家にとって重要です。市場のトレンドや流動性をより良く理解するために、高度な市場分析のためのユーザーマニュアルを提供しています。以下は、いくつかの機能とその実装方法の簡単な紹介です: 1. 高時間枠の市場構造の表示:    パラメータを設定することで、チャート上に高時間枠の市場構造を表示することができます。これにより、全体的な市場のトレンドと構造をより良く理解することができます。必要に応じて時間枠をカスタマイズし、市場構造をチャート上に表示することができます。 2. 流動性の表示:    流動性は市場で重要な指標の一つです
Scalper Vault は、スキャルピングを成功させるために必要なすべてを提供するプロフェッショナルなスキャルピング システムです。このインジケーターは、外国為替およびバイナリー オプションのトレーダーが使用できる完全な取引システムです。推奨される時間枠は M5 です。 システムは、トレンドの方向に正確な矢印シグナルを提供します。また、トップとボトムのシグナルとギャン マーケット レベルも提供します。 インジケーターは、プッシュ通知を含むすべてのタイプのアラートを提供します。 インジケータの購入後にご連絡ください。私の個人的な取引の推奨事項と素晴らしいボーナス指標を無料で共有します! 幸せで有益な取引をお祈りします!
このインジケーターを購入すると、プロ仕様のトレードマネージャーを無料で差し上げます。 まず第一に、このトレーディングシステムがノンリペイント、ノンリドロー、ノンラグのインジケーターであることを強調する価値がある。これにより、手動取引とロボット取引の両方に理想的なものになっています。 オンラインコース、マニュアル、プリセットのダウンロード。 「スマートトレンドトレーディングシステム MT5」は、新規および経験豊富なトレーダー向けにカスタマイズされた包括的なトレーディングソリューションです。10以上のプレミアムインジケーターを組み合わせ、7つ以上の堅実なトレーディング戦略を備えており、多様な市場状況に対応する多目的な選択肢となっています。 トレンドフォロー戦略:トレンドを効果的に乗り越えるための正確なエントリーとストップロス管理を提供します。 リバーサル戦略:潜在的なトレンドの反転を特定し、トレーダーがレンジ相場を活用できるようにします。 スキャルピング戦略:高速で正確なデイトレードおよび短期取引のために設計されています。 安定性:すべてのインジケーターはノンリペイント、ノンリドロー、ノ
Weis Wave with Alert
Trade The Volume Waves Single Member P.C.
4.82 (22)
Rental/Lifetime Package Options and Privileges' Rent Monthly Six Months   Yearly/Lifetime Weis Wave with Speed with Alert+Speed Index x x x Manual  x x x Quick Set up Video x x x Blog x x x Lifetime Updates x x x Setup and Training Material x x Rectangle Break Alert Tool      x Discord Access Channel "The SI traders" x   How to trade info visit:    http://www.tradethevolumewaves.com   ** If you purchase please contact me to setup your  : training Room and  complete manual access.  This is
作者のその他のプロダクト
Supreme Commander
Ramon Sobrevals Arce
4.13 (8)
The indicator of the indicators. The Most Powerful Technique to Determine Forex Trend Strength in 2023. We have perfected Supreme Commander that it calculates an average of the selected indicators (up to 16) and the selected timeframe (all) with the result of a single trend that indicates the potential of buying and selling.  It includes the following indicators: Accelerator/Decelerator oscillator Average Directional Movement Index Awesome oscillator; Bulls and Bears  Commodity Channel Index; De
After working during many months, with the help of Neural Networks, we have perfected the ultimate tool you are going to need for identifying key price levels (Supports and Resistances) and Supply and Demand zones. Perfectly suitable to trigger your trades, set up your future actions, decide your Take Profit and Stop Loss levels, and confirm the market direction. Price will always move between those levels, bouncing or breaking; from one zone to another, all the remaining movements are just mark
Immediately plots renko bars in an external/indicator window.  One of the distinctive advantages Renko charts offer is the fact that they are not time dependent. Therefore, the new Renko blocks are only traced when the price moves higher or lower by the specified number of points.  For example, a 10 pip (100 points) Renko chart would plot the blocks when price moves 10 pips higher in an uptrend or 10 pips lower in a downtrend. Renko charts removes "noises" from the Market and i t helps to identi
Do you need precision? Tick charts show each change in the ask or bid; The chart updates whenever either price changes. Study the markets more deeply, with surgical precision. Tick Chart Window saves all the received ticks and shows them into a seperate window. Get the best entry price in the Market.               trade with precision trade good  Spread Register In the comment section you will see the highest spread, the lowest spread and the average spread since the indicator was loaded.
FREE
Harmonic Papallons
Ramon Sobrevals Arce
3.33 (3)
Automatically scans the chart to find Harmonic Patterns, and give you the chance to enter early in good operations. Also if selected, it will alert you in advance when future patterns appears, showing you a projection of a posible future pattern. The main goal  for this algorithm is to determine with high precision the moment when a trend ends and a new one begins. Giving  you the best price within a reversal.   We have added the "Golden Trade", we define it as the perfect order: For those orde
Marker Bands
Ramon Sobrevals Arce
4 (1)
This indicator consists in two different algorithms, in order to profit all fast movements created during noises of the market. First of all, it plots normalized trend bands to can filter the possible trades. The normalized trend bands are calcualted using an exclusive mathematical algorithm to has both the correct trend and the fast adaptability to the change of trends. With those bands you can know when you are inside the trend, or when you are outside. The second alhorithm uses a private fo
This is a calculator that allows you to manage your trade risk in every trade. Decide in advance the risk you want to assume using Stop Loss or Take Profit; account percentage or specific amount of your currency.  You can also use this tool to can test faster your manual strategies, because Trade Risk Management can be perfectly used on backtesting    For new traders, this may become your favorite tool; allowing you to easily control the risk of your trades, and train your skills trading on Bac
This indicator is created by using an exclusive algorithm to indicate you Buy or Sell in an accurate way all the possibles reversals within a normalized trending bands. The main goal for this algorithm is to achieve fast profitable movements and aggressive retracement. Thanks to the normalized bands, using the noises of the market. We have added the "Golden Trade", we define it as the perfect order:   For those orders that had the perfect entry price. They were always in profit, or the final pr
Automatically scans the chart to find Harmonic Patterns, and give you the chance to enter early in good operations. Also if selected, it will alert you in advance when future patterns appears, showing you a projection of a posible future pattern. The main goal  for this algorithm is to determine with high precision the moment when a trend ends and a new one begins. Giving  you the best price within a reversal.   We have added the "Golden Trade", we define it as the perfect order:   For those ord
フィルタ:
レビューなし
レビューに返信