STL Trend Direction
- インディケータ
- バージョン: 1.0
- アクティベーション: 5

Hello!
Tired of constantly subscribing to other people's signals and earning pennies?
Want to manage your own trading?
Then you are on the right page!
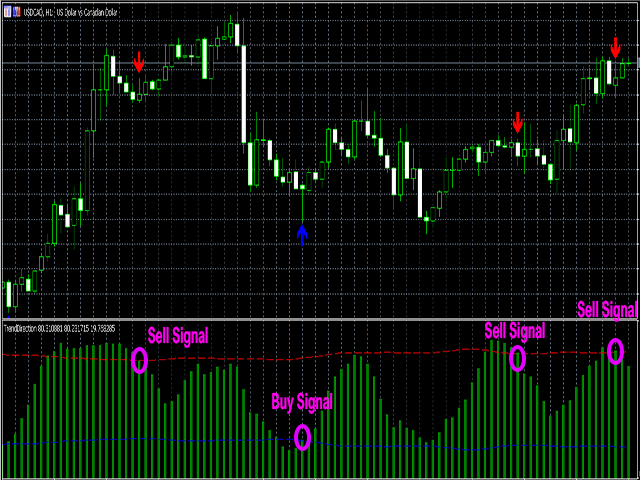
It's very simple ==> buy my indicator ==> put it on the chart ==> blue arrow - buy ==> red arrow - sell. Even an infant can do it!
A handy histogram to trace the market direction.
Are you still here? Then read the parameter descriptions and take a look at the screenshots:
- Stoch K period - period for calculating the% K oscillator line.
- Stoch D period - averaging period for calculating the% D oscillator line.
- Slowing - setting the oscillator. Deceleration value.
- Method - the method for calculating the moving average.
- Line Mode - the line for plotting the indicator.
- Alert - enable, disable Alert.
- Email - enable, disable sending messages to e-mail.
- Push - enable, disable sending messages to a mobile phone.
- Arrow size - the size of the arrows on the chart.
- Buy - the color of the buy arrows.
- Sell - the color of the sell arrows.
Don't forget to turn on the PUSH notification in your settings so you don't miss out on a good deal.
Visit us in the Telegram chat and on the Telegram channel, there are a lot of interesting things.
Chat on Telegram https://t.me/stlforex
Telegram channel https://t.me/stlexpertadvisers