Auto Levels

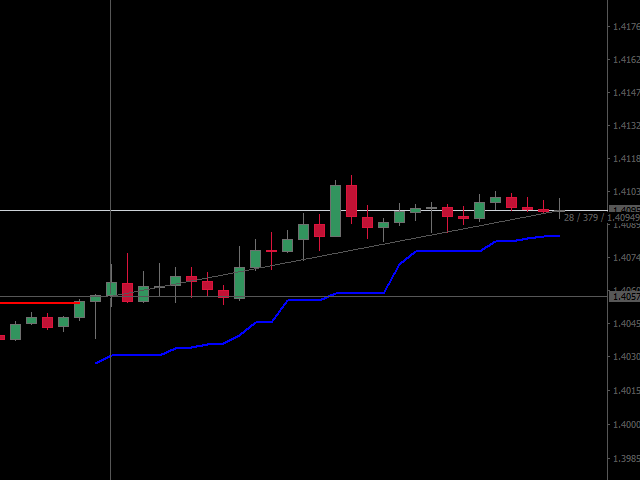
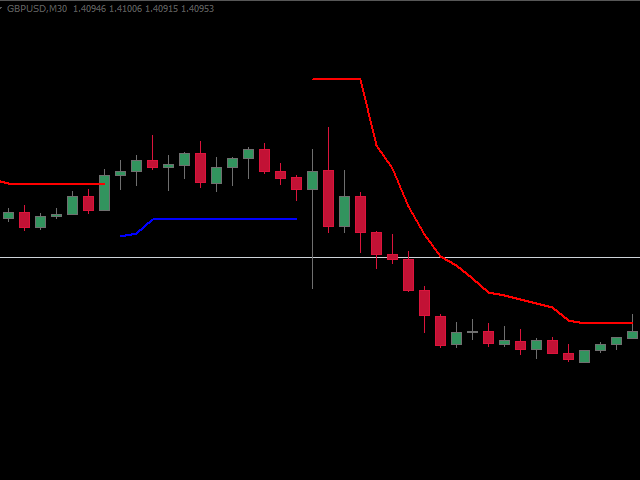
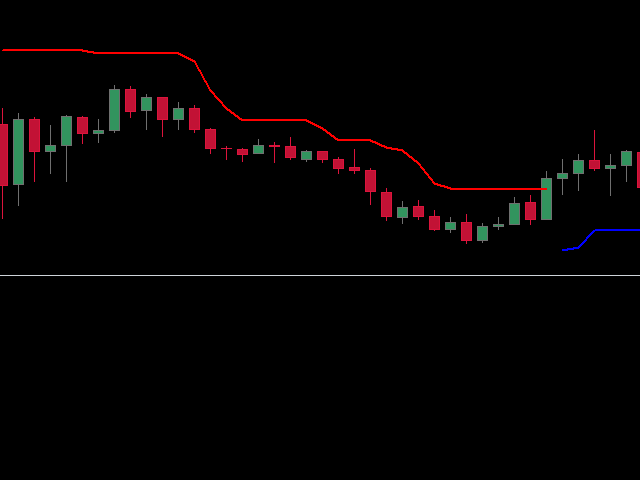
Auto Level this tool is able to determine the levels of support and resistance. search and display when the price has broken through the level and when it pushed off from it. the indicator can be useful if you use resistance support levels in your trading. or the highs and lows of the price, then it will greatly simplify your work and help you more quickly and more accurately determine the rebound or breakdown of the current trend or tendencies level. blue line bottom uptrend red line on top downtrend


おすすめのプロダクト
Overview Harmonic Patterns MT4 is a technical analysis indicator designed for the MetaTrader 5 platform. It identifies and displays harmonic price patterns, such as Butterfly, Cypher, Crab, Bat, Shark, and Gartley, in both bullish and bearish directions. The indicator calculates key price levels, including entry, stop loss, and three take-profit levels, to assist traders in analyzing market movements. Visual elements and customizable alerts enhance usability on the chart. Features Detects six ha
This is an arrow indicator without a future function,developed based on the most advanced profit trading algorithms.It has the most innovative and advanced dual trend analysis module, as well as the latest and highly effective market trend prediction algorithm.Trends are your friends, and following larger trends can earn the maximum profit in foreign exchange. This indicator helps traders identify current trends and track them. Someone once made a profit of 10 times in a week by relying on it.No
Introduction to X3 Chart Pattern Scanner X3 Cherart Pattern Scanner is the non-repainting and non-lagging indicator detecting X3 chart patterns including Harmonic pattern, Elliott Wave pattern, X3 patterns, and Japanese Candlestick patterns. Historical patterns match with signal patterns. Hence, you can readily develop the solid trading strategy in your chart. More importantly, this superb pattern scanner can detect the optimal pattern of its kind. In addition, you can switch on and off individu
Reversal Pattern Pro
Boonyapagorn Rodvattanajinda
Reversal Patterns Pro Reversal Patterns Pro is a Price Action (PA) analytical tool that scans the reversal patterns.  - Finds and marks the most dependable Japanese candlestick patterns in real-time. - Supports all time frames (Best for Scalping) - Doesn't repaint making it an exceptional indicator for Expert Advisors. Input parameters : - Support & Resistance Mode ( true or false ) for enabling advanced filtering - Donchian Period - RSI Period - RSI Oversold Level - RSI Overbought Level - Al
BONUS INDICATOR HERE :  https://linktr.ee/ARFXTools Trading Flow Using Fibo Eminence Signal 1️⃣ Wait for the Fibonacci to Auto-Draw The system automatically detects swings (from high to low or vice versa) Once the Fibonacci levels appear, the indicator sends an alert notification “Fibonacci detected! Zone is ready.” 2️⃣ Check the Entry Zone Look at the ENTRY LINE (blue zone) This is the recommended SELL entry area (if the Fibonacci is drawn from top to bottom) Wait for the price to enter
All Symbols   AND  All Time frames Scan                                                                                                                 Document Introduction   The ABCD is a basic harmonic pattern. The ABCD pattern is a visual, geometric chart pattern comprised of three consecutive price swings. It looks like a diagonal lightning bolt and can indicate an upcoming trading opportu
このインジケーターは、手動および自動的な方法で描かれる調和パターンを検出します。 ご自身のレビューを追加してください。 注意事項: インジケーターにはコントロールパネルがあり、各(チャートとタイムフレーム)の設定を保存します。スペースを確保するために最小化することができ、他の分析ツールと一緒に作業する際にインジケーターデータをすべて非表示にするために閉じるボタンを押すこともできます。 このインジケーターを使用して設定を変更し、移動平均線やボリンジャーバンドなどのインジケーターを追加する場合、このインジケーターは自動的に編集したテンプレートを保存し、必要なときにロードすることができます。 Windows 10を使用している場合は、MetaTraderアイコンを右クリックして > 互換性 > 高DPI設定の変更 > システム(強化)を選択して、最適な画面設定にしてください(これはHDデバイスで行う必要があります)。 このインジケーターは、チャート上で調和トレーディング理論を解釈したもので、チャート上の調和パターンを検出します。詳しく学びたい場合は、Scott Carneyの「ハーモニックト
Voenix
Lorentzos Roussos
4.58 (12)
高調波パターン スキャナーとトレーダー。いくつかのチャートパターンも 含まれているパターン: ABCDパターン ガートレーパターン バットパターン 暗号パターン 3ドライブパターン ブラックスワンパターン ホワイトスワンパターン カジモドパターンまたはオーバーアンダーパターン Altバットパターン 蝶のパターン 深いカニ柄 カニ柄 サメ柄 FiveOパターン 頭と肩のパターン 昇順の三角形のパターン ワンツースリーパターン そして8つのカスタムパターン Voenixは、マルチタイムフレームおよびマルチペアのハーモニックパターンスキャナーであり、25のチャートおよびフィボナッチパターンをサポートします。カスタムブロック光学アルゴリズムを利用し、再描画なしで、確認ステップに依存せずに可能なパターンを迅速に発見できます(ジグザグ計算とは異なります)。 )。 選択したパターンを自動的に交換したり、通知を送信したり、テーブルに収集して簡単にアクセスして評価したりできます。 取引には最大3つの利益目標があり、各目標で成約された注文のパーセンテージに関して分散があります。 簡単なステップトレーリン
これはほぼ間違いなく、MetaTraderプラットフォームで見つけることができる最も完全な調和価格形成自動認識インジケーターです。 19種類のパターンを検出し、フィボナッチプロジェクションをあなたと同じように真剣に受け止め、潜在的逆転ゾーン(PRZ)を表示し、適切なストップロスとテイクプロフィットレベルを見つけます。 [ インストールガイド | 更新ガイド | トラブルシューティング | よくある質問 | すべての製品 ] 19の異なる調和価格形成を検出します プライマリ、派生および補完フィボナッチ投影(PRZ)をプロットします 過去の価格行動を評価し、過去のすべてのパターンを表示します この指標は、独自の品質とパフォーマンスを分析します 適切なストップロスとテイクプロフィットのレベルを表示します ブレイクアウトを使用して適切な取引を通知します すべてのパターン比をグラフにプロットします 電子メール/音声/視覚アラートを実装します スコット・M・カーニーの本に着想を得て、この指標は最も純粋で急を要するトレーダーのニーズを満たすように設計されています。ただし、トレードを容易にする
Alpha Trend signは私たちの取引システムを検証し、取引信号を明確に提示し、信号がドリフトすることはありません。 主な機能: •市場が活況を示している地域に応じて、指標に基づいて現在の相場がトレンド相場に属しているか、それとも揺れ相場に属しているかを直感的に判断することができる。 そして、指標の指示矢印に基づいて市場に切り込み、緑の矢印は購入を提示し、赤の矢印は販売を提示する。 •小周期変動による頻繁な取引信号の発生を回避するために、5分以上の時間周期で取引を行うことを推奨します。 •最適な取引タイミングを逃さないために、シグナルプロンプトをオンにすることもできます。 •本指標はトレンド相場をよく予測するだけでなく、幅広振動相場でも利益を得ることができる。 •本指標は大道至簡の原則に基づいており、異なる段階のトレーダーが使用するのに適している。 注意事項: •Alpha Trend signには明確な入退場信号があり、損失を与えないように逆位相操作を提案しない。 •Alpha Trend signは特に成熟した指標であり、デルのチー
This is a trend indicator without redrawing Developed instead of the binary options strategy (by the color of the Martingale candlestick) Also works well in forex trading When to open trades (binary options) A signal will appear in the place with a candle signaling the current candle It is recommended to open a deal for one candle of the current timeframe M1 and M5 When a blue dot appears, open a deal up When a red dot appears, open a trade down. How to open trades on Forex. When a signal is rec
Advanced version of CyberZingFx Volume Plus, the ultimate MT4 indicator for traders seeking highly accurate buy and sell signals. With an additional strategy and price action dot signals that enhances its effectiveness, this indicator offers a superior trading experience for professionals and beginners alike. The CyberZingFx Volume Plus Advanced version combines the power of volume analysis and historical price data with an additional strategy, resulting in even more precise and reliable signals
Monster Harmonics Indicator is a harmonic pattern indicator. It recognizes Gartley, Bat, Crab, Butterfly, Cypher, White Swan, Black Swan, Shark and several other patterns. Projected patterns that are not yet completed are recognized, too. Monster even shows the PRZ (Potential Reversal Zone). Users can add their own user defined patterns to Monster. Besides the current pattern, Monster also shows all patterns in the symbols history. Monster will provide alerts for developing patterns. Introduced
The   Fibonacci Confluence Toolkit   is a technical analysis tool designed to help traders identify potential price reversal zones by combining key market signals and patterns. It highlights areas of interest where significant price action or reactions are anticipated, automatically applies Fibonacci retracement levels to outline potential pullback zones, and detects engulfing candle patterns. Its unique strength lies in its reliance solely on price patterns, eliminating the need for user-define
Trade with Gann on your side!! MASTER CIRCLE 360 CIRCLE CHART, originally created by Gann admitted that this is “The Mother of all charts”. It is one of the last studies that this great trader left for us. The numeric tab le is apparently quite simple like all the tables and is based on square numbers, the SQUARE OF 12 and is by evolution, one of the most important square numbers. Here we can find CYCLE, PRICE AND TIME thanks to angles and grades, to show past and future support and resistance.
The perfect tool for Scalng in the Forex markets You can trade both from signal to signal and using take profit  The algorithm does not use Zigzag!  No redrawing!  This is a channel instrument that uses a moving average as a filter. Moving Average  There are 2 parameters for the settings Ma Period = 5 period Moving Average  Channel 1.0 distance of channel lines from the chart Price Signal Filter - calculation of signal opening and filter There is a complete set of Alert There is a multi-timefram
Gartley Projection D
Oleksandr Medviediev
3.71 (7)
このインジケーターは、H.M.Gartley (「株式市場の利益」、1935 年) の開発に従って調和パターン (XABCD) を識別します。 D 点を透視投影の点として投影します (設定で ProjectionD_Mode = true を指定します)。 再描画はしません。 作業時間枠のバーが閉じるとき、特定されたパターン ポイントが Patterns_Fractal_Bars バーの間に移動していない場合、チャート上に (予想される価格変動の方向に) 矢印が表示されます。 この瞬間から、矢印はチャート上に永久に残ります。 連続した 2 ~ 3 つ以上の矢印 - これは市場状況の変化であり、再描画/再描画ではありません (時間枠を前後に切り替えてはなりません)。 注: 2 ~ 3 つ以上の矢印が連続している場合 - これは市況の変化であり、再描画ではありません。 パターンの総数は 85 です (Gartley-222 と Gartley-222WS を含む。完全なリストはコメント セクションにあります)。 識別されたすべてのパターンのうち、最後に識別されたパターンのみがベ
Chart Patterns Detect 15 patterns (Ascending Triangle, Descending Triangle, Rising Wedge, Falling Wedge, Bullish Flag, Bearish Flag, Bullish Rectangle, Bearish Rectangle Symmetrical triangle, Head and Shoulders, Inverted Head and Shoulders, Triple top, Triple Bottom, Double Top, Double Bottom) Use historical data to calculate the probability of each pattern to succeed (possibility to filter notification according to the chance of success) gives graphic indication about the invalidation level and
"The trend is your friend" is one of the best known sayings in investing, because capturing large trendy price movements can be extremely profitable. However, trading with the trend is often easier said than done, because many indicators are based on price reversals not trends. These aren't very effective at identifying trendy periods, or predicting whether trends will continue. We developed the Trendiness Index to help address this problem by indicating the strength and direction of price trend
Rainbow Price Visualizer v1.21 See where the market really breathes. Turns your MT4 chart into an ultra-precise heatmap that highlights price zones favored by big players. Why it matters 300 price levels at 0.2‑pip resolution — microscopic detail. 8 visual themes (Rainbow, Fire, Ocean…) for instant readibility. Smart opacity: low noise fades, real zones pop. Lightweight rendering with automatic cleanup. Fully customizable: saturation, opacity, resolution, history depth. Bands project into the f
Forex Gump Trendは、トレンドの方向を非常に効果的に決定するための普遍的な指標です。トレンドを正しく特定すれば、これは取引成功の95%です。これは、価格変動の方向に取引を開始し、その恩恵を受けることができるためです。 Forex Gump Trendインジケーターは、効率の高いトレーダーが現在のトレンドの方向とトレンドの反転ポイントを判断するのに役立ちます。トレンドの方向はチャート上で色付きの線で示され、トレンド反転ポイントは矢印で示されます。インジケーターには多くの設定があり、ほぼすべての時間枠とすべての通貨ペアで使用できます。 外国為替ガンプトレンドと取引する方法は? 取引戦略は、トレーダーの取引スタイルと彼が働く通貨ペアに依存します。しかし、グローバルに言えば、この指標を使用した取引戦略は、常にトレンドの方向に注文を開くことに基づいています。インジケーターは色付きの線でトレンドを示します。したがって、インジケーターが青い線を引いたときに買い取引を開き、インジケーターが赤い線を引いたときに売り取引を開きます。トレーダーの大多数がスキャルピング戦略を使用して取引
発見が困難で頻度が少ないため、分岐は最も信頼できる取引シナリオの1つです。このインジケーターは、お気に入りのオシレーターを使用して、通常の隠れた分岐点を自動的に見つけてスキャンします。 [ インストールガイド | 更新ガイド | トラブルシューティング | よくある質問 | すべての製品 ] 取引が簡単 通常の隠れた発散を見つけます 多くのよく知られている発振器をサポート ブレイクアウトに基づいて取引シグナルを実装します 適切なストップロスおよび利益レベルを表示します 設定可能なオシレーターパラメーター カスタマイズ可能な色とサイズ バー単位でサイズ別に分岐をフィルタリング パフォーマンス統計を実装します 電子メール/音声/視覚アラートを実装します 幅広い市場の見通しを提供するために、異なるオシレーターを使用して、干渉なしで同じチャートにインジケーターを何度もロードできます。このインジケーターは、次のオシレーターをサポートしています。 RSI CCI MACD オスマ 確率的 勢い 素晴らしい発振器 加速器発振器 ウィリアムズパーセントレンジ 相対活力指数 特に外国為替市場では、
QuantumEdge Trader v1.0 AI-Powered Precision Signals for Serious Traders QuantumEdge Trader is a smart and reliable indicator that delivers accurate BUY and SELL signals using advanced market analysis and trend detection. Designed for M1 to M60 timeframes, it's ideal for scalping and intraday strategies. --- Key Features: No Repaint – Signals never change after appearing Smart trend filters to reduce noise Adjustable sensitivity and alerts Perfect for XAUUSD, EURUSD, and m
Overview  Market Structure Analysis Indicator MT4 Structure Analysis Indicator   automatically identifies Market Structure based on Smart Money Concepts (SMC). It clearly displays Break of Structure (BoS), Change of Character (CHoCH), Higher Highs, Higher Lows, Lower Highs, and Lower Lows in real-time. Key Features Automatic Market Structure Detection   Break of Structure (BoS)   - Price breaks previous structure in trend direction   Change of Character (CHoCH)   - Trend reversal sig
これは、キャンドルの終値を予測する指標です。 このインジケータは、主にD1チャートでの使用を目的としていますが. この指標は、従来の外国為替取引とバイナリオプション取引の両方に適しています。 インジケーターは、スタンドアロンのトレーディングシステムとして使用することも、既存のトレーディングシステムへの追加として機能させることもできます。 このインジケーターは、現在のキャンドルを分析し、キャンドル自体の内部の特定の強度係数と、前のキャンドルのパラメーターを計算します。 したがって、この指標は、市場の動きのさらなる方向性と現在のキャンドルの終値を予測します。 この方法のおかげで、この指標は、短期の日中取引だけでなく、中期および長期の取引にも適しています。 インジケーターを使用すると、市場の状況の分析中にインジケーターが生成する潜在的な信号の数を設定できます。 インジケーターの設定には、このための特別なパラメーターがあります。 また、インジケーターは、チャート上のメッセージの形式で、電子メールで、およびPUSH通知の形式で、新しい信号について通知することができます。 購入後は必ず私に書いて
「Auto FIBO Pro」Crypto_Forex インジケーターは、取引の補助ツールとして最適です。 - インジケーターは、フィボナッチ レベルとローカル トレンド ライン (赤色) を自動的に計算してチャート上に配置します。 - フィボナッチ レベルは、価格が反転する可能性のある重要な領域を示します。 - 最も重要なレベルは、23.6%、38.2%、50%、61.8% です。 - リバーサル スキャルピングやゾーン グリッド取引に使用できます。 - Auto FIBO Pro インジケーターを使用して、現在のシステムを改善する機会も多数あります。 - Info Spread Swap Display があり、接続されている外国為替ペアの現在のスプレッドとスワップを表示します。 - ディスプレイには、アカウントの残高、エクイティ、マージンも表示されます。 - Info Spread Swap Display は、チャートのどのコーナーにも配置できます。 0 - 左上コーナー、1 - 右上、2 - 左下、3 - 右下。 高品質のトレーディングロボットとインジケーターをご覧にな
The indicator detects important peaks and troughs (extremes) on the chart. These points can be used to plot support/resistance levels and trend lines, as well as any other graphical analysis. These points can serve as reference points for setting trading orders. The indicator does not redraw . Settings: Size_History  - the size of the calculated history. Num_Candles_Right  - number of candles to the right of the peak or trough. Num_Candles_Left  - number of candles to the left of the peak or
Trendlines Chart Patterns Indicator (MT4) Automated Chart Patterns & Breakout Signals for MT4: Trade with Precision! The "Trendlines Chart Patterns Indicator" is an advanced trading tool for MetaTrader 4 (MT4) , meticulously designed to identify high-probability buy and sell signals based on dynamically forming, robust trend lines and popular chart patterns . This powerful forex indicator automates the complex process of identifying patterns like triangles, flags, ranges, ascending/descending tr
NEW YEAR SPECIAL DISCOUNT RUNNING NOW 40% DISCOUNT Price slashed from $149 to $89 until 3rd Jan 2025 Indicator captures the trend reversals with no-repaint Buy and Sell Arrow signals. CyberZingFx Trend Reversal Indicator - your go-to solution for accurate and reliable trend reversal signals. With its  advanced trading strategy , the indicator offers you Buy and Sell Arrow signals that do not repaint, making it a reliable tool for catching Swing Highs and Swing Lows in any market and any time fr
Smart ZigZag indicator is a ZigZag, for which the market is actually not accidental. This is not mere words, as this can be confirmed by displayed charts comparing Smart ZigZag and HZZ parameters. But before I describe the screenshots, let's examine a few details concerning Smart ZigZag. This indicator analyzes the chart and identifies certain activity horizons assigning numbers to them. This can be called ranking. For example, M1 EURUSD chart from 4.01.1999 to 3.12.2013 has the average segment
このプロダクトを購入した人は以下も購入しています
An exclusive indicator that utilizes an innovative algorithm to swiftly and accurately determine the market trend. The indicator automatically calculates opening, closing, and profit levels, providing detailed trading statistics. With these features, you can choose the most appropriate trading instrument for the current market conditions. Additionally, you can easily integrate your own arrow indicators into Scalper Inside Pro to quickly evaluate their statistics and profitability. Scalper Inside
現在20%OFF! 初心者やエキスパートトレーダーのためのベストソリューション! このダッシュボードソフトウェアは、28の通貨ペアで動作しています。それは私達の主要な指標(高度な通貨の強さ28と高度な通貨インパルス)の2に基づいています。それは全体の外国為替市場の大きい概観を与えます。それは、すべての(9)時間枠で28の外国為替ペアのための高度な通貨の強さの値、通貨の動きの速度と信号を示しています。チャート上で1つのインディケータを使用して市場全体を観察し、トレンドやスキャルピングの機会をピンポイントで見つけることができたら、あなたのトレードがどのように改善されるか想像してみてください。 このインディケータには、強い通貨と弱い通貨の識別、潜在的な取引の識別と確認がより簡単になるような機能が搭載されています。このインディケータは、通貨の強さや弱さが増加しているか減少しているか、また、すべての時間枠でどのように機能しているかをグラフィカルに表示します。 新機能として、現在の市場環境の変化に適応するダイナミックなマーケットフィボナッチレベルが追加され、すでに当社のAdvanced
GOLD Impulse with Alert
Bernhard Schweigert
4.64 (11)
このインディケータは、当社の2つの製品 Advanced Currency IMPULSE with ALERT  +   Currency Strength Exotics . のスーパーコンビネーションです。 このインジケーターは全ての時間枠で作動し、8つの主要通貨と1つのシンボルの強弱のインパルスをグラフで表示します。 このインジケータは、金、エキゾチックペア、商品、インデックス、先物など、あらゆるシンボルの通貨強度の加速度を表示することに特化されています。金、銀、原油、DAX、US30、MXN、TRY、CNHなどの通貨強度の加速度(インパルスまたは速度)を表示するために、任意のシンボルを9行目に追加できる、この種の最初のものです。 新しいアルゴリズムに基づいて構築され、潜在的な取引の特定と確認がさらに容易になりました。これは、通貨の強さや弱さが加速しているかどうかをグラフィカルに表示し、その加速の速度を測定するためです。加速すると物事は明らかに速く進みますが、これはFX市場でも同じです。つまり、反対方向に加速している通貨をペアリングすれば、潜在的に利益を生む取引を特定
Volatility Trend System - a trading system that gives signals for entries. The volatility system gives linear and point signals in the direction of the trend, as well as signals to exit it, without redrawing and delays. The trend indicator monitors the direction of the medium-term trend, shows the direction and its change. The signal indicator is based on changes in volatility and shows market entries. The indicator is equipped with several types of alerts. Can be applied to various trading ins
Miraculous Indicator – ガン・スクエア・オブ・ナインに基づく100%非リペイントのFXおよびバイナリーツール この動画では、FXおよびバイナリーオプションのトレーダー向けに特別に開発された、非常に正確で強力な取引ツールである Miraculous Indicator を紹介しています。このインジケーターがユニークなのは、伝説的な ガン・スクエア・オブ・ナイン と ガンの振動の法則 に基づいている点で、現代の取引で利用できる最も正確な予測ツールの一つとなっています。 Miraculous Indicatorは 完全に非リペイント であり、ローソク足が確定した後にシグナルが変化したり消えたりすることはありません。つまり、見たものがそのまま利用できます。これにより、トレーダーは自信を持ってエントリーおよびエグジットを行うための信頼性と一貫性のある根拠を得ることができます。 主な特徴: ガン・スクエア・オブ・ナインとガン理論に基づいて構築 100%非リペイントのシグナルシステム すべての時間枠(M1、M5、H1、H4、日足、週足)で機能 FXおよびバイナリーオプション取引
現在20%OFF! 初心者やエキスパートトレーダーに最適なソリューションです。 このインディケータは、エキゾチックペア・コモディティ・インデックス・先物など、あらゆるシンボルの通貨の強さを表示することに特化したインディケータです。金、銀、原油、DAX、US30、MXN、TRY、CNHなどの通貨の強さを表示するために、9行目にどのシンボルでも追加することができます。独自の機能を多数搭載し、新しい計算式を採用したため、ユニークで高品質、かつ手頃な価格のトレーディングツールとなっています。新しいトレンドやスキャルピングチャンスのトリガーポイントを正確に把握することができるため、あなたのトレードがどのように改善されるか想像してみてください。 ユーザーマニュアル:ここをクリック   https://www.mql5.com/en/blogs/post/708876 すべての時間枠に対応します。あなたはすぐにトレンドを見ることができるようになります! 新しいアルゴリズムに基づいて設計されているため、潜在的な取引の特定と確認がより簡単になります。これは、8つの主要通貨と1つのシンボルの強弱
Dynamic Forex28 Navigator - 次世代の Forex 取引ツール。 現在 49% オフ。 Dynamic Forex28 Navigator は、長年人気のインジケーターを進化させたもので、3 つの機能を 1 つにまとめています。 Advanced Currency Strength28 インジケーター (レビュー 695 件)  + Advanced Currency IMPULSE with ALERT (レビュー 520 件) + CS28 コンボ シグナル (ボーナス)。 インジケーターの詳細 https://www.mql5.com/en/blogs/post/758844 次世代の Strength インジケーターが提供するもの  オリジナルで気に入っていたすべての機能が、新機能と精度の向上によって強化されました。 主な機能: 独自の通貨強度計算式。 すべての時間枠でスムーズかつ正確な強度ライン。 トレンドの特定と正確なエントリーに最適です。 ダイナミックマーケットフィボナッチレベル (マーケットフィボナッチ)。 このインジケーターに固有
PUMPING STATION – あなた専用の「オールインワン」戦略 PUMPING STATIONは、あなたのトレードをより楽しく、そして効果的に変えてくれる革新的なFXインジケーターです。ただの補助ツールではなく、強力なアルゴリズムを備えた本格的なトレーディングシステムで、より安定したトレードのスタートをサポートします。 この商品をご購入いただくと、以下の特典を無料でお付けします: 専用セットファイル:自動設定による最大パフォーマンスを実現。 ステップバイステップのビデオマニュアル:PUMPING STATION戦略の使い方を学べます。 Pumping Utility:PUMPING STATION専用の半自動トレードボットで、より快適かつシンプルな運用を可能にします。 ※ご購入後すぐにご連絡ください。追加リソースへのアクセスを提供いたします。 PUMPING STATIONの仕組み: トレンド管理:市場のトレンド方向を即座に判断。トレンドはあなたの最高の味方です。 エントリーサイン:チャート上の矢印で、取引のタイミングと方向を明確に示します。 明確な目標設定:インジケーターが自
トレンドラインプロ   市場の真の方向転換点を理解するのに役立ちます。この指標は、真のトレンド反転と主要プレーヤーが再び参入するポイントを示します。 分かりますか     BOSライン   複雑な設定や不要なノイズなしに、より長い時間足でのトレンドの変化と重要なレベルを把握できます。シグナルは再描画されず、バーが閉じた後もチャート上に残ります。 インジケーターが示す内容: 本当の変化   トレンド(BOSライン) 一度シグナルが現れたら、それは有効です!これは、リペイント機能を持つインジケーターとの重要な違いです。リペイント機能を持つインジケーターは、シグナルを発した後、それを変更し、資金の損失につながる可能性があります。これにより、より高い確率と精度で市場に参入できます。また、矢印が現れた後、目標値(利益確定)に達するか、反転シグナルが現れるまで、ローソク足の色を変更する機能もあります。 繰り返しエントリ       主要プレーヤーの補充 エントリーポイントを探す際の視覚的な明瞭性を向上させるため、最適な市場エントリーポイントが検索されるBUY/SELLゾーンを最初に表示するモジュ
現在20%OFF! このダッシュボードは、複数のシンボルと最大9つのタイムフレームで動作するソフトウェアの非常に強力な部分です。 このソフトは、弊社のメインインジケーター(ベストレビュー:Advanced Supply Demand)をベースにしています。    Advanced Supply Demand ダッシュボードは、素晴らしい概要を提供します。それは示しています。  ゾーン強度評価を含むフィルタリングされた需給値。 ゾーン内/ゾーンへのPips距離。 ネストされたゾーンがハイライトされます。 選択されたシンボルの4種類のアラートを全ての(9)時間枠で提供します。 それはあなたの個人的なニーズに合わせて高度に設定可能です。 あなたの利益! すべてのトレーダーにとって最も重要な質問です。 市場に参入するのに最適なレベルはどこか? 成功のチャンスとリスク/リターンを得るために、強力な供給/需要ゾーン内またはその近くで取引を開始します。 損切りの最適な位置はどこですか? 最も安全なのは、強力な供給/需要ゾーンの下/上にストップを置くことです。 最適な利益
F-16 Plane Indicatorをご紹介します。これは、取引体験を革新するために設計された最先端のMT4ツールです。F-16戦闘機の無類のスピードと精度に触発され、このインジケーターは高度なアルゴリズムと最新技術を組み合わせ、金融市場で比類のないパフォーマンスを提供します。 F-16 Plane Indicatorを使用すると、リアルタイムの分析と高精度な取引シグナルの生成が可能で、競争相手を圧倒します。ダイナミックな機能により、さまざまな資産クラスで利益を見つけることができ、自信を持って的確な決定を行うことができます。 使いやすいインターフェースを備えたF-16 Plane Indicatorは、人気のあるMetaTrader 4プラットフォームとシームレスに統合され、スムーズで効率的な取引プロセスを実現します。初心者のトレーダーでも経験豊富なプロフェッショナルでも、このインジケーターは独自の取引スタイルと好みに合わせて簡単にカスタマイズすることができます。 F-16 Plane Indicatorのパワーを体感し、市場のトレンドを精密かつ敏捷にナビゲートします。高度なチャー
Friends, we present to your attention our new Forex Gump Laser indicator. Since there are no designers in our team, but mainly mathematicians, financiers, programmers and traders, we did not make any special changes in the indicator design. In appearance, it resembles the usual Forex Gump. On the other hand, Forex Gump has become not just the name of an indicator, it is a brand. And we try to preserve the corporate identity in all its varieties. The whole essence of the indicator in its operatio
SHOGUN Trade - 16年間無調整の衝撃。戦略的市場構造と損小利大の極意 開発者も戦慄した「16年間」の真実 まず、添付した画像(バックテスト結果)をご覧ください。これはUSDJPY H1における、**2010年1月1日から2026年1月1日までの「丸16年間」**の検証結果です。 これはEA(自動売買)の販売ではありません。しかし、あえてこのグラフを提示させてください。「この結果、すごくないですか?」と。 特筆すべきは、この16年間、 一切のパラメーター調整(カーブフィッティング)を行っていない という点です。 リーマンショック後の混乱、アベノミクス、チャイナショック、ブレグジット、コロナショック、そして未曾有の歴史的円安――。市場のルールが何度も書き換わった激動の16年間を、このシステムは「無調整」のまま、見事な右肩上がりで突破しました。 圧倒的な3つの優位性 1. 「コツコツドカン」の真逆を行く設計(損小利大) 多くのトレーダーが資金を失う原因は、小さな利益を積み上げ、一度の負けで全てを失うことにあります。SHOGUN Tradeは、負けを最小限に抑え、トレン
Meravith
Ivan Stefanov
5 (1)
このインジケーターは、各ポイントのボリュームを分析し、そのボリュームに対する市場の疲労レベルを計算します。 インジケーターは3本のラインで構成されています: 強気のボリューム疲労ライン 弱気のボリューム疲労ライン 市場のトレンドを示すライン。このラインは、市場が強気か弱気かに応じて色が変わります。 任意の開始点から市場を分析できます。一度ボリューム疲労ラインに達したら、次の分析を開始するための新しいポイントを設定してください。 トレンドや修正を分析できます。良いアプローチは、トレンドラインに達したときや、トップやボトムがヒットしたときにインジケーターを移動させることです。 トレンドラインとボリューム疲労ラインの距離が大きいほど、その方向のボリュームは大きくなります。 トレンドラインはオーダーを開く場所として使用でき、疲労ラインは利益を取るために使用されます。 このシステムは非常にユニークですが、非常に直感的でもあります。 市場には同様の製品はありません。 使用に制限はありません。すべての市場およびすべての時間枠で適用できます。 重要:MetaTrader4のテスターで確認する際は、紫色
事前に指標   市場の反転レベルとゾーンを決定し 、価格がそのレベルに戻るのを待って、新しいトレンドの終わりではなく、始まりにエントリーできるようにします。 彼は示す   反転レベル   市場が方向転換を確認し、さらなる動きを形成する場所。 このインジケーターは再描画なしで動作し、あらゆる金融商品に最適化されており、       トレンドラインプロ   インジケータ。 すべての機器に対応する可逆構造スキャナー すべての取引商品を自動的に追跡し、すべての R 反転パターンを即座に識別して、LOGIC AI 信号がすでに存在する場所やその他の有用な情報を表示します。 Logic AI – エントリーポイントを表示するアシスタント 市場参入の最適なタイミングを判断するインテリジェントなシグナル。TPSproSYSTEMアルゴリズムを使用し、価格動向、トレンド、主要参加者の活動を分析します。 LOGIC AI が表示されるということは、市場状況が十分に整い、高い成功確率で取引の決定を下せる状態であることを意味します。 (R1-PRO)モードは、トレンドプロインジケーターからのトレンドの変化
このインジケーターは実践的なトレードに最適な自動波動分析のインジケーターです! 場合... 注:   Tang Lun (Tang Zhong Shuo Zen) の命名規則の影響で、私は波のグレーディングに西洋の名前を使用することに慣れていません。基本的な波を ペン 、二次波のバンドを セグメント と名付けました。同時に、 セグメント にはトレンドの方向が指定されます (この命名方法は将来のノートで使用されます。最初に言っておきます)。ただし、アルゴリズムは曲がりくねった理論とはほとんど関係がないため、付けるべきではありません。これは、私の市場分析 によって要約された、絶えず変化する複雑な運用ルール を反映しています。 バンドは標準化され、人によって異なることがないよう定義されており、市場参入を厳密に分析する上で重要な役割を果たす人為的な干渉の描画方法が排除されています。 このインジケーターを使用することは、取引インターフェイスの美しさを改善することと同等であり、元の K ライン取引を放棄し、取引の新しいレベルに連れて行きます。また、宣伝の観点から顧客の認識も向上します。 イ
Gold Channel is a volatility-based indicator, developed with a specific timing algorithm for the XAUUSD pair, which consists of finding possible corrections in the market. This indicator shows two outer lines, an inner line (retracement line) and an arrow sign, where the theory of the channel is to help identify overbought and oversold conditions in the market. The market price will generally fall between the boundaries of the channel. If prices touch or move outside the channel it is a tradi
Adaptive Volatility Range [AVR] is a powerful tool for identifying key trend reversal points. AVR accurately reflects the Average True Range (ATR) of volatility, taking into account the Volume-Weighted Average Price (VWAP). The indicator adapts to any market volatility by calculating the average volatility over a specific period, ensuring a stable rate of profitable trades. You receive not just an indicator but a professional automated trading system , AVR-EA . Advantages: Automated Trading Sys
これはMT4のインジケーターで、再描画なしで取引に参入するための正確なシグナルを提供します。 外国為替、暗号通貨、金属、株式、インデックスなど、あらゆる金融資産に適用できます。かなり正確な見積もりを提供し、取引を開始して終了するのに最適な時期を教えてくれます。1つのシグナルを処理しただけでインジケーターの元が取れた例の 動画 (6:22)をご覧ください。Entry PointsPro インジケーターの助けを借りたほとんどのトレーダーの最初の1週間の結果が改善しています。 Telegramグループ に登録してください。Entry Points Proインジケーターのメリットは次の通りです。 再描画のないエントリーシグナル 再描画されるインジケーターでは一度表示されたシグナルが削除されて大きな金銭的損失につながることがありますが、これと異なり、表示されて確認されたシグナルは消えることがありません。 エラーなしの取引開始 インジケーターアルゴリズムによって取引を開始する(資産を売買する)理想的な瞬間を見つけることができます。それを使用するすべてのトレーダーの成功率が向上します。 あら
Hidden Cycles
Lev Vladimirovic Marushkin
5 (1)
The Only 100% Universal Tool! Stop trading against nature! This is your chance to secure the only indicator rooted in the absolute laws that govern the entire universe. Most tools guess—this one reveals the truth. Buy another toy or buy the truth. Your choice... Based on Universal Laws — NOT Some Guy’s Algorithm: Let the market adjust to the Hidden Cycles Geometry — not the other way around. Most indicators are based on a man-made formula. They often lag, fail over time, or need constant re-o
ご紹介   クォンタム トレンド スナイパー インジケーターは 、トレンド反転を特定して取引する方法を変革する画期的な MQL5 インジケーターです。 13年以上の取引経験を持つ経験豊富なトレーダーのチームによって開発されました。     クォンタムトレンドスナイパーインジケーター   は、非常に高い精度でトレンドの反転を識別する革新的な方法で、あなたのトレーディングの旅を新たな高みに押し上げるように設計されています。 ***Quantum Trend Sniper Indicatorを購入すると、Quantum Breakout Indicatorを無料で入手できます!*** クォンタム ブレイクアウト インジケーターは、トレンドの反転を特定するとアラートを発し、矢印を示し、3 つのテイクプロフィットレベルを提案します。 初心者トレーダーにもプロのトレーダーにも適しています。 量子EAチャネル:       ここをクリック MT5のバージョン:       ここをクリック 推奨事項: 期間: すべての時間枠。最良の結果を得るには、M15、M30、H1 のタイム
PROFESSIONAL FOOTPRINT CHART INDICATOR A Footprint Chart is an advanced order flow visualization tool that displays the volume traded at each price level within a candlestick. Unlike traditional candlestick charts that only show open, high, low, and close prices, footprint charts reveal the  battle between buyers and sellers  at every price level. KEY CONCEPT:   Footprint charts show WHERE volume occurred, not just HOW MUCH volume occurred. This is critical for understanding institutional activ
ご紹介     Quantum Breakout PRO は 、ブレイクアウト ゾーンの取引方法を変革する画期的な MQL5 インジケーターです。 13年以上の取引経験を持つ経験豊富なトレーダーのチームによって開発された Quantum Breakout PROは 、革新的でダイナミックなブレイクアウトゾーン戦略により、あなたの取引の旅を新たな高みに押し上げるように設計されています。 クォンタム ブレイクアウト インジケーターは、5 つの利益ターゲット ゾーンを備えたブレイクアウト ゾーン上のシグナル矢印と、ブレイクアウト ボックスに基づいたストップロスの提案を提供します。 初心者トレーダーにもプロのトレーダーにも適しています。 量子EAチャネル:       ここをクリック MT5バージョン:   ここをクリック 重要!購入後、インストールマニュアルを受け取るためにプライベートメッセージを送ってください。 推奨事項: 時間枠: M15 通貨ペア: GBPJPY、EURJPY、USDJPY、NZDUSD、XAUUSD アカウントの種類: ECN、Raw、またはスプレッドが非
The Super Arrow Indicator provides non-repainting buy and sell signals with exceptional accuracy. Key Features No repainting – confirmed signals remain fixed Clear visual arrows: green for buy, red for sell Real-time alerts via pop-up, sound, and optional email Clean chart view with no unnecessary clutter Works on all markets: Forex, gold, oil, indices, crypto Adjustable Parameters TimeFrame Default: "current time frame" Function: Sets the time frame for indicator calculation Options: Can be set
OrderFlow Absorption – MT4用プロフェッショナル・デルタ&アブソープションシグナルインジケーター OrderFlow Absorptionで本物のオーダーフロー分析の力を解き放ちましょう。MetaTrader 4向けの究極のデルタヒストグラム&アブソープションシグナルインジケーターです。あらゆる価格変動の裏側で何が起きているのかを知りたいトレーダーのために設計されており、市場を動かす隠れた買い/売り圧力や吸収イベントを明らかにします。 特徴 デルタヒストグラムの可視化:   買い圧力・売り圧力を色分けされたヒストグラムで即座に表示。 アブソープションシグナル検出:   高度なロジックで強気・弱気の吸収イベントを特定し、反転の兆しを早期に通知。 チャートマーカー:   吸収シグナルをチャート上に直接マークし、視覚的に分かりやすく表示。 ポップアップアラート:   新しい吸収シグナルが出現した際にリアルタイムで通知。 カスタマイズ可能な閾値:   弱いシグナルを除外し、高確率のセットアップに集中。 リソース管理:   大きなチャートでも高速に動作する効率的な計算。
現在26%OFF! このインディケータは、当社のメインインディケータ( Advanced Currency Strength 28   &  Advanced Currency IMPULSE with ALERT )の両方のスーパーコンビネーションです。28の外国為替ペアのTICK-UNITSとアラートシグナルの通貨強度の値を示しています。11種類のTick-Unitが使用可能です。1、2、3、4、5、6、10、12、15、20、30秒の11種類です。サブウィンドウのTick-Unitバーは、秒単位のタイマーに1ティック以上含まれる場合に表示され、左側にシフトされます。 たった1枚のチャートで、28のFXペアをスキャルピングできます。スキャルピングのチャンスとなるトリガーポイントを正確に把握することで、スキャルピングが上達することを想像してみてください。 1分足よりも短い期間で動作する市場初の通貨強度インジケーターです! このインジケータは、素早いインとアウトを行い、小さなピップを切り取ることを望む高速スキャルパーのためのものです。 ユーザーマニュアル: ここをクリック h
Elliott Wave Trend was designed for the scientific wave counting. This tool focuses to get rid of the vagueness of the classic Elliott Wave Counting using the guideline from the template and pattern approach. In doing so, firstly Elliott Wave Trend offers the template for your wave counting. Secondly, it offers Wave Structural Score to assist to identify accurate wave formation. It offers both impulse wave Structural Score and corrective wave Structure Score. Structural Score is the rating to sh
The Nihilist 5.0 Indicator includes Forexalien and Nihilist Easy Trend trading strategies and systems. It is composed of an MTF Dashboard where you can analyze the different input possibilities of each strategy at a glance. It has an alert system with different types of configurable filters. You can also configure which TF you want to be notified on your Metatrader 4 platform and Mobile application The indicator has the option to view how could be a TP and SL by using ATR or fixed points, even w
Current event:  https://c.mql5.com/1/326/A2SR2025_NoMusic.gif A. A2SR とは何ですか ?   * 先行テクニカル指標です (塗り直しなし、ラグなし)。 -- ガイダンス : -- https://www.mql5.com/en/blogs/post/734748/page4#comment_16532516 -- そして https://www.mql5.com/en/users/yohana/blog A2SR には、サポート (需要) とレジスタンス (供給) のレベルを決定する特別な手法があります。 ネットで見かける通常の方法とは異なり、A2SR は実際の SR レベルを決定する独自のコンセプトを持っています。 元の手法はインターネットから取得されたものではなく、インターネット上で公開されたこともありません。 A2SR は、取引スタイルに応じて SR レベルを自動選択します。 時間枠を変更しても、SR レベルはその位置にとどまります。 実際のSRは、使用する時間枠から取得されるわけではないため. A2SR
回帰取引を意味する専門的かつ定量的なアプローチを実装する独自の指標。これは、価格が予測可能かつ測定可能な方法で迂回して平均に戻るという事実を利用しており、非定量的な取引戦略を大幅に上回る明確な出入りルールを可能にします。 [ Installation Guide | Update Guide | Troubleshooting | FAQ | All Products ] 明確な取引シグナル 驚くほど簡単に取引できます カスタマイズ可能な色とサイズ パフォーマンス統計を実装します ほとんどの取引戦略を上回ります 適切なSLおよびTPレベルを表示します 電子メール/音声/視覚アラートを実装します 使い方 インディケータは、より高い時間枠からの完全にカスタマイズ可能な移動平均の周りの標準偏差を測定し、トレンドフォローアプローチを使用して正確に取引を見つけます。取引は、現在のチャートの価格アクションに飛び込むことによって見つけられ、価格が選択したより高い時間枠から計算された平均価格帯に戻ったときに閉じられます。それがコード化される方法のために、指標は高ボラティリティと強いトレンドの市場か
作者のその他のプロダクト
Sniper MACD
Yaroslav Varankin
4.35 (17)
いくつかの方法で改良されたスナイパーMACDインジケーター。 追加のフィルタがあります 最大の結果を得るために数回平滑化される 市場および現在の価格条件に関する情報をより正確に表示するために、ボリュームインジケータも追加されます 短期的な期間に設定されているので、m1からm30までの期間に指標を使用することをお勧めします eur.usd - eur.jpyのような非常に揮発性の高い通貨ペアで取引することをお勧めします あなたの注意と落札していただきありがとうございます。 ----------------------------------------------------------------------------------------------------------------------------- いくつかの方法で改良されたスナイパーMACDインジケーター。 追加のフィルタがあります 最大の結果を得るために数回平滑化される 市場および現在の価格条件に関する情報をより正確に表示するために、ボリュームインジケータも追加されます 短期的な期間に設定されているので、m1から
FREE
RVI Sniper Alert
Yaroslav Varankin
4.5 (4)
これが究極のRVIインジケータです。 警告矢印を追加 潜在的な抵抗レベルを特定することができます 読み値を改善するための2つの追加フィルタ それはさらに良好な結果を示すために平滑化される m1からm30までの短い時間枠で構成されていました ひどく悪くはありません スクリーンショットmacdのように、このインジケータを追加のフィルタとともに使用することをお勧めします これが究極のRVIインジケータです。 警告矢印を追加 潜在的な抵抗レベルを特定することができます 読み値を改善するための2つの追加フィルタ それはさらに良好な結果を示すために平滑化される m1からm30までの短い時間枠で構成されていました ひどく悪くはありません スクリーンショットmacdのように、このインジケータを追加のフィルタとともに使用することをお勧めします
FREE
Revolution Martingale is an indicator designed for trading binary options on the M5 timeframe. Features: M5 Timeframe: It is recommended to use the indicator on the M5 timeframe for optimal trading. Trade Entry: Trades should only be opened on the first candle after a signal appears. Signals: A blue diamond indicates a buying opportunity for upward movement, while a red diamond indicates a buying opportunity for downward movement. Configured for Effective Binary Options Trading: The indicator i
FREE
Mega Alert Level Indicator: A Simple Yet Valuable Tool The Mega Alert Level indicator provides sound, informational, push, and email notifications when the price of a currency pair touches or approaches standard support and resistance levels, as well as any other objects on the chart you select. Features: Notifications: Customize notifications to your preference—choose between Email, Popup, or Push. All settings are displayed in the upper right corner of the chart. Ease of Use: Simply attach th
FREE
Scalping Binary Option Pro is an arrow indicator that is completely free from repainting . Although it may work incorrectly in strategy testers, its signals remain relevant for real trading. Signals: A red arrow pointing down indicates a selling opportunity, while a green arrow pointing up indicates a buying opportunity. Settings: All you need to adjust are the colors of the signal arrows and the sound alert for signal notifications. Usage Recommendations: It is best to use the indicator on hig
Almas Wall Street is a professional arrow indicator with no repainting. Signals appear simultaneously with the formation of a candle. Trading Guidelines: Enter a trade for at least 2 candles or on the next candle after the signal for 1 candle. Screenshot 5 . A red arrow pointing down suggests considering sales, while a blue arrow suggests buying. All you need to configure are the colors of the signal arrows. It is recommended to apply this indicator in scalping on timeframes M1-M5. Signals occur
Brilliant Wall Street is a professional arrow indicator.  It is based on a mathematical calculation.  thanks to a special calculation algorithm that was developed by the best specialists  he is not late, moreover, he gives advanced signals.  -----------almost complete absence of redrawing------------.  signals appear with the advent of the candle.  It is recommended to enter a trade for at least 1-2 candles on the next candle, but you can also use a signal...  The red down arrow indicates that
This is a dial indicator for trading from the level of support resistance  --- complete lack of redrawing ---  He is able to determine the levels of support resistance  Finds the best entry points and shows them with arrows.  If a trend is forming, the indicator will always notify with a arrow signal.  buy signal blue arrow for sale red arrow  This signaling tool can also be used on a sideways market.  The main thing is that it is volatile.!!!!!!  Good percentage of correct indicator predictio
I n the tester does not work, see how it works in the video; sorry for the inconvenience. UTB is done for real-time work quotation when trading. indicator draws resistance support levels Also, when a level appears, an arrow appears where to open a deal. You will not miss any desired level approach. The indicator showed good results on all graphs and time frames. recommended settings step 1800 p.s traders selling from wall street also use resistance support levels in their analytics how do tra
Esta es una de las modificaciones de los canales Keltner. Ayuda a identificar puntos de entrada y salida lógicos. Ayuda a determinar un posible movimiento de precios. Crea canales equidistantes que se convierten en niveles de soporte y resistencia dinámicos. Facilita enormemente el análisis del mercado visual. El indicador es un multi-tiempo multi-tiempo muestra buenos resultados.
trading indicator, which automatically recognizes equal levels of support and resistance and otorova content and resistance and poison indicator uses elder system can be applied to any financial instruments and on any timeframes. the same indicator draws to. it is perfect for scalping as its essence is to trade in the channel. The indicator has many parameters that allow it to be conveniently customized. indicator settings filter - it filters the market noise that is, we get more accurate channe
The Bad Boys indicator is a arrow indicator percentage (of positive trades) of correct forecasts of the indicator, even during news releases, the indicator was tested on a real account and showed a good result of correct forecasts. Settings allow you to customize the color of the arrows. volatility period indicator period the number of bars for which the market analysis will be carried out price is the method when a signal will appear when opening when closing a candle, etc. volatility allows yo
Dream Wall Street   It represents the visualization of support resistance levels. the indicator marks the levels that are formed on a candle whose tick volume exceeds the average volume; it is perfect as it is without filters for scalping by level it can also be used as an addition to an existing trading system. The indicator can be used as a filter. It is already set up to configure anything for you. Settings allow you to customize the light levels
The Divergent Accuracy indicator is designed to identify discrepancies on the price chart of a currency pair. The Divergent Accuracy indicator recognizes bullish and bearish divergences, and can also output a signal that a divergence has been detected... In addition to identifying divergences, the indicator works with overbought and oversold levels, and also shows arrows to enter the market...
The premium loudness indicator draws on the chart of a currency pair based on data on the price level in the back period in the input parameters of the indicator in the form of a histogram. The width of the histogram at this level means, conditionally, the number of transactions conducted on it If the broker provides real volume data, Cannot be received For example, the range H1 can be specified as H1, H4, D1, W1, MN1. For M1, it is recommended to use periodic settings for M5 values.
Premium Volume Lite The Premium Volume Lite indicator plots the distribution of deals according to price levels in the form of a histogram on a chart of a currency pair. The width of the histogram at this level means, conditionally, the number of transactions carried out on it. If the broker provides data on real volume, the indicator can show the distribution over it. Ranges can be equal only to standard timeframes not lower than the current one. о periods value is current then the indicator wi
The Invisible Sniper arrow indicator is built on the use of candlestick analysis. The indicator finds the “Absorption” reversal candlestick patterns on the price chart and, depending on the figure, bullish or bearish absorption, gives a signal to enter in the form of blue arrows to buy, red to sell. in the indicator Invisible Sniper implemented sound and text alert..
Big Scalper Pro комбинированный осциллятор, отображающий на ценовом графике  Сигналы на вход отображаются в виде стрелок соответствующего цвета, а также дублируются текстовым сообщением. есть звуковые и текстовые алерты push уведомления уведомления на email все это можно включить и выключить в настройках индикатора настройки период это период г л авного индикатора в период это период дополнительного индикатора волатильности
Dawn In Trading indicator is a new ray of light in trading! This indicator has been tested on a real chart in real trading; All statistics about this indicator from real trading on the market! From the screenshots you can see the profitability of quality and the number of signals of this tool, you can also check it in the tester! As soon as a blue arrow appears, open a deal to increase, when a red arrow appears, open a deal to fall! Signals appear when you open a new candle and do not redraw, t
It is possible to trade on any basic asset, but the experts holding testing give preference to currency pair USD/JPY, EUR/USD. Optimum time for work is considered European, the American session. with the standard settings which are already perfected to an ideal At emergence of a blue arrow under a candle the option UP is acquired. At emergence of a red arrow the option DOWN is acquired. It should be noted one feature of the indicator: the signal is formed on the current bar, but it is worth
boss ! Trading opportunities can be used in any underlying asset, but experts in conducting tests prefer the currency pair USD / JPY. The most favorable time for work is the European, American session. When the blue arrow appears, a red option under the candle is acquired UP. When the red arrow appears, the option DOWN is acquired. It is recommended to avoid trading during strong news releases
This indicator was tested on the basis of real statistics for all market indicators according to indicators for 3 months of trading. trade forecasts for usd / jpy on the m30 time frame were received on our statistics! if you have any questions, please contact us in private messages or in discussions under this indicator and we will figure it out and help any questions will arise personal messages or in discussions under this indicator As soon as the blue points appear, we open a deal to increa
The indicator is designed for opening trades for a long period. he is set up to get as many points from each trade as possible. he uses the scalping method... you can trade on any currency pairs indicator is already  you can trade at any time of the day but the preferred time of trading during the European American session. currency pairs eur / jpy, eur / usd currency pairs with high volatility then the results are much better.
Venom
Yaroslav Varankin
Venom indicator is a new type of indicator for scalping with high accuracy of correct predictions in the indicator you can select the indicator signal does not redraw, does not disappear, you can trust it 100% When a red blue arrow appears under the candlestick, an UP option is purchased. When red arrows appear, the DOWN option is purchased. the indicator is based on our new development, if there is an order with a large amount that opens in the direction we need, according to the analysis of th
the indicator showed excellent results in the scalping trade, and the same excellent results in the trading of exact instruments led to the fact that of these indicators showed themselves perfectly during the exit from the news with an  during low volatility,  This instrument has been tested for more than 1 month. What can we say about the number? It is reliable, accurate, at any time of trading. Atom Pro Maximum, this indicator showed excellent results in scalping trading. The accuracy of this
can recognize candlestick patterns he also recognizes the lows and highs of the price for a certain time. MTF works on all currency pairs in futures and sulfur, cryptocurrency does not redraw. his work can be seen in the test. you can trade at any time of the day but the preferred trading time during the European American session ----------------------------------------------------------------------------------------------------------------------------------------------------------
Multi-timeframe indicator perfectly determines when there will be a rollback from the level ideal for binary options. of correct true signals Forex Stop Loss trading can be dragged behind the line thereby moving the deal to breakeven there is a signal in the indicator. The indicator showed excellent results during testing. Test in the test and make sure it is accurate. For any questions, suggestions, please always communicate with you.
multi-timeframe indicator. Ideal for both the Forex market and binary options. Good accuracy of this tool the indicator showed excellent results during testing. test it in a tester and make sure it is accurate.... complete lack of redrawing. You can choose absolutely any instrument. the indicator will provide many profitable and accurate signals. advantages of the indicator: advanced signals. high signal accuracy. frequency of occurrence of signals.
Revolution Martingale Pro indicator for binary options! at the time of opening and the appearance of the signal! Blue diamond is shopping up. A red diamond is an option down. The indicator is already set to trade in binary options. ----------- protection is set against hitting on (steps - martingale knees) protection of several minuses under the row. ------------------------------------------- (Redrawing possible)
indicator for binary options! open a deal only for 1 - candle The indicator is already set to trade in binary options. The indicator is ideal for trading on martingale since he very accurately combines what the next candle will be if you are trading in a martingale money management, this is the indicator that you were looking for; it is just created for you and your trading style p.s it is much better than relying on the color of the candle as some not very experienced traders do (therefore, the
フィルタ:
レビューなし
レビューに返信