Bitcoin Manager MT4
- インディケータ
- バージョン: 3.60
- アクティベーション: 5

Description
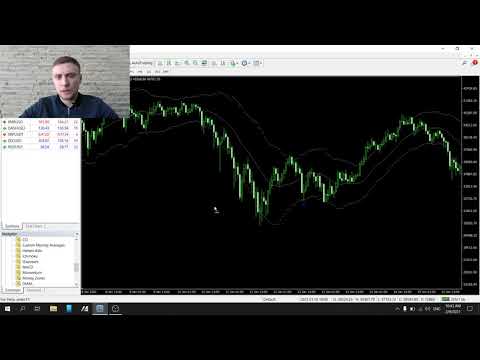
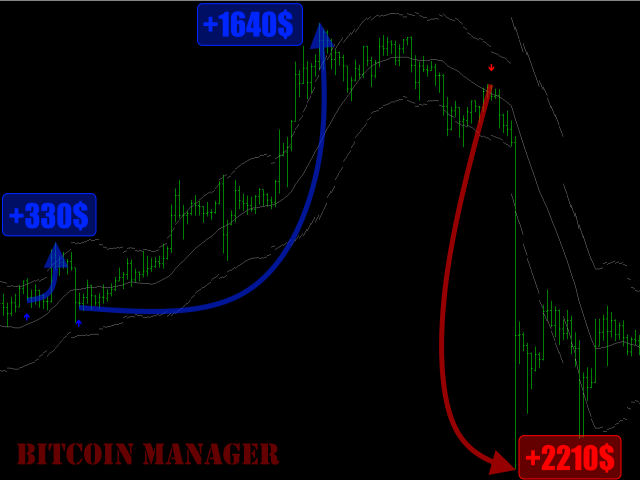
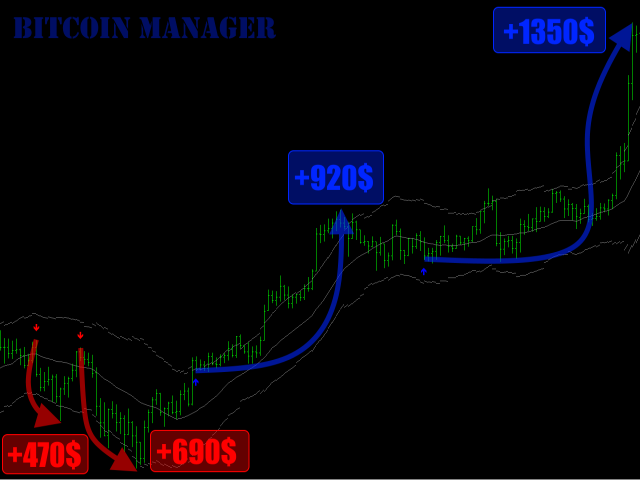
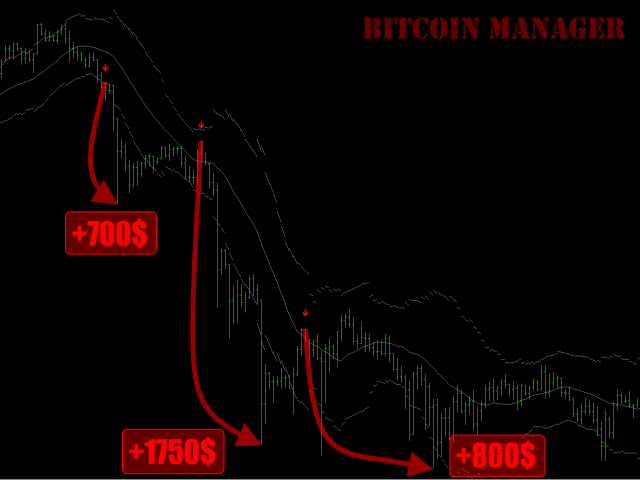
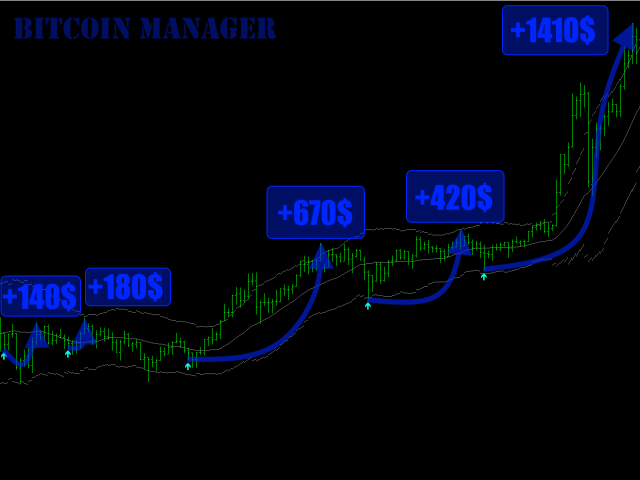
Bitcoin Manager is the best indicator for trading Bitcoin cryptocurrency. It is calculated based on the price deviation from the moving average line channel. Ascending and descending arrows indicate potential points and levels for opening buy and sell positions.
How to use?
We strongly recommend using this indicator on the H1 timeframe. An up arrow indicates a buy level. Down Arrow - Sell Level.
Parameters
Maximum History Bars - maximum count of history bars to calculate.
_GRAPHICS_SETTINGS_ - graphics settings .
Buy Arrows Color - color of Buy arrows.
Sell Arrows Color - color of Sell arrows.
Channel Color - color of channel.
Channel Color - color of channel.
_NOTIFICATIONS_SETTINGS_ - notifications settings.
Alert Notification - allow alert notifications.
Push Notification - allow push notifications.
E-Mail Notification - allow e-mail notifications.