Money Zones
- インディケータ
- バージョン: 12.300
- アクティベーション: 5

Description
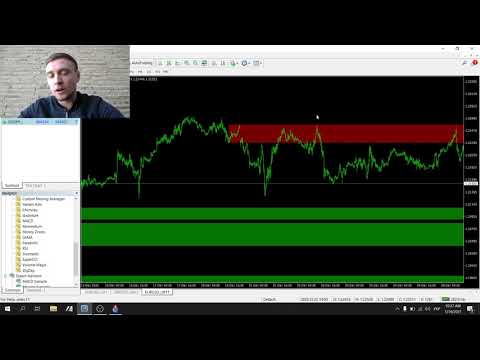
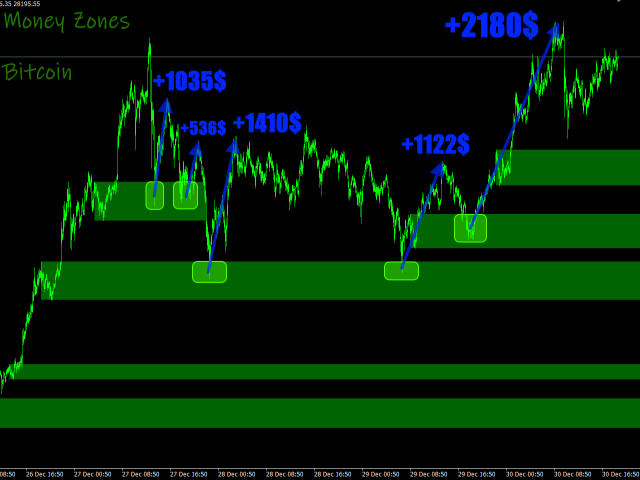
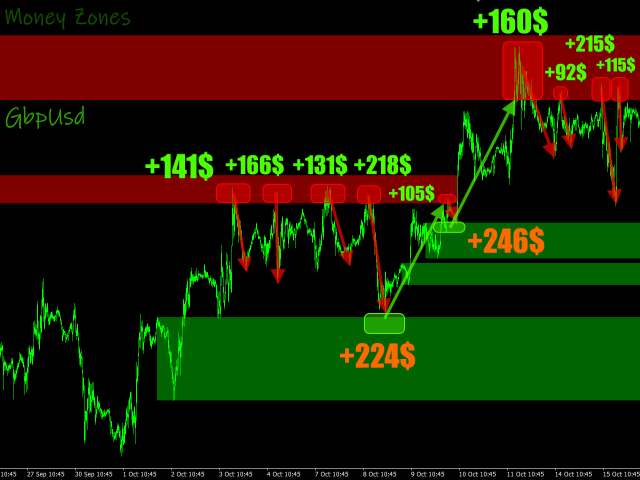
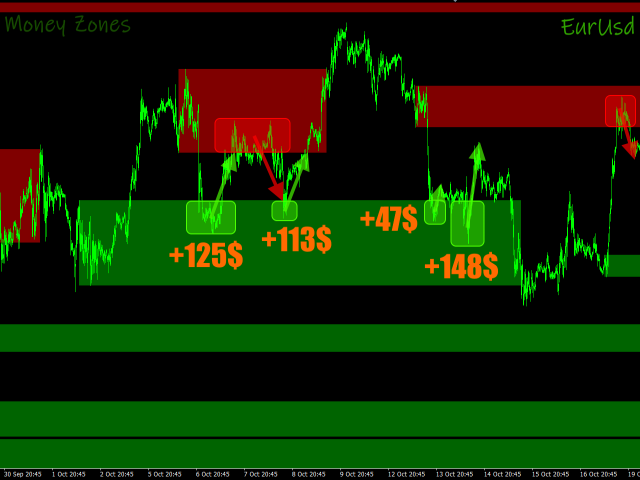
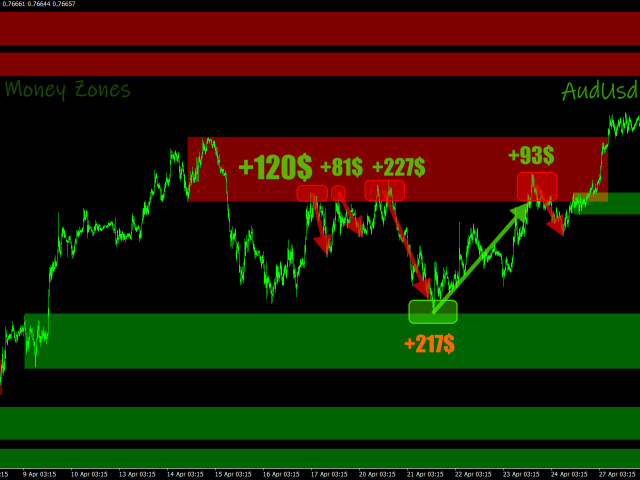
Money Zones is an indicator that determines accumulation/distribution zones in the market. Green zones make it possible to look for buy entry points or sell exit points. Red zones, on the contrary, define the opportunity for selling or closing buys. The indicator has the ability to define money zones for two timeframes simultaneously on the same chart.
How to use?
Use this indicator to identify market zones as support/resistance zones to determine the best conditions for market entry and exit points.
Parameters
_INDICATOR_SETTINGS_ - indicator settings. Maximum History Bars - maximum count of history bars to calculate.
Average True Range Period - period of ATR indicator.
Fast Moving Period - period of the fast moving average.
Slow Moving Period - period of the slow moving average.
Movings Difference - minimum difference between moving averages.
Zones Boost Impulse - impulse value of zones boost.
Zones Reinforce Type - type of zone reinforce.
Zones Reinforce Correction - correction value of zone reinforce.
Zones Break Correction - correction value of zone break.
Zones Reinforce Correction - correction value of zone reinforce.
Zones Break Correction - correction value of zone break.
_GRAPHICS_SETTINGS_ - graphics settings .
Timeframe #1 - timeframe #1.
Timeframe #2 - timeframe #2.
TF1 Buy Zones Color - color of buy-zones of Timeframe #1.
TF1 Sell Zones Color - color of sell-zones of Timeframe #1.
TF2 Buy Zones Color - color of buy-zones of Timeframe #2.
TF2 Sell Zones Color - color of sell-zones of Timeframe #2.
_NOTIFICATIONS_SETTINGS_ - notifications settings.
Alert Notification - allow alert notifications.
Push Notification - allow push notifications.
E-Mail Notification - allow e-mail notifications.