The xBrat Algo

Think of an Experienced Traders’ Brain as a blueprint for a trading algorithm.

Then the desire to keep charts as clutter free as possible. What you see below is a blueprint of Paul Bratby’s thought process but even he admits, he is getting too old to focus on all of these!

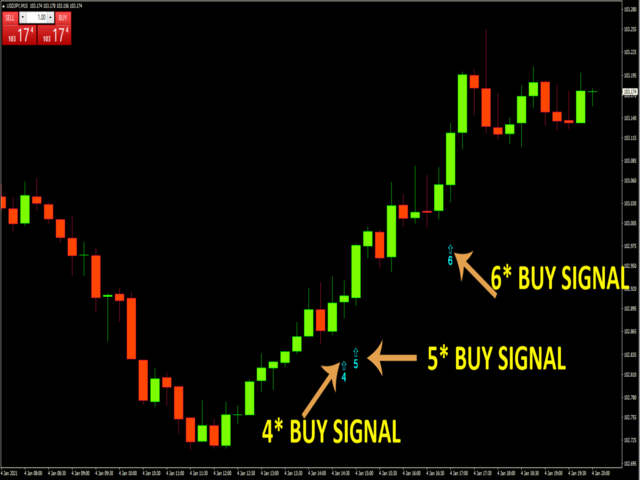
• 9 Decision Points before Paul considers grading the trade a 3* trade
• Then another special Decision Point will make it a 4* trade
• Another for 5* trade
• And Finally, a total of 12 Decision Points being correct before he grades a trade 6* trade

So, to make his most successful trading strategy easier for him to use and then in turn for traders of all levels to use. He sat down with his developer to talk through his thought process, what he measures, how he grades the trades with different indicators and then asked the question.

Can you include of these “Decision Points” as an Algorithm, but leave them off the chart? And only print the signal with my Star* rating of the potential trade?

The answer was “Yes” and the XBrat Algo was developed.

Then over 150 Hours of manually back testing by Paul to ensure his ultimate strategy was being represented by the Algo was conducted. A few tweaks, as Paul is a perfectionist and it was ready to release.

This is best used with Heikin Ashi Candles.

You can find HA Candles in your Navigator and drag it across to your chart


We also have a Signals Group on Discord relaying xBrat Algo signals to your desktop or phone, you can sign up here
www.paulbratby.com/signals 


Check out our YouTube xBrat Algo playlist with new videos added regularly!
https://www.youtube.com/playlist?list=PLCXAre1NKAiiXrP6smjAn8Y4st6ydJFwq

Using xBrat Algo on ALL Charts!

https://www.youtube.com/watch?v=Mkd8AAruSZM&list=PLCXAre1NKAiiXrP6smjAn8Y4st6ydJFwq


Trade Management with xBrat Algo

https://www.youtube.com/watch?v=M1g_fwVK61s&list=PLCXAre1NKAiiXrP6smjAn8Y4st6ydJFwq


おすすめのプロダクト
Please contact me at telegram  https://t.me/smartforex7 After purchasing SmartForex Indicator then Use This Indicator...................... SMART EXIT PROFIT LINE Indicator is very Helpful with SmartForex Indicator ........................................ SMART EXIT PROFIT LINE Indicator Attach with SmartForex Indicator after then Red Line Show Exit buy Profit , Green Line show Exit Sell Profit................
FREE
This EA has been developed, tested and traded live on NASDAQ M15 TF. Everything is ready for immediate use on real account. Very SIMPLE STRATEGY with only FEW PARAMETERS. Strategy is based on EXPANSION ON THE DAILY CHART. It enters if volatility raise after some time of consolidation. It uses STOP pending orders with ATR STOP LOSS. To catch the profits is a TRAILING PROFIT function in the strategy.  EA has been backtested on more than 10-year long tick data with 99% quality of modeling and verif
クイックラインツール:トレンドラインと長方形をプロットするための便利な指標 クイックラインツールは、テクニカル分析のための迅速かつ効果的なツールを必要とするトレーダーのために設計されたMetaTrader4のための強力で直感的な指標 この指標を使用すると、トレンドライン、サポート/抵抗レベル(AP/DW)、および長方形を簡単に作成して、チャートレイアウトプロセスを最適化できます。 この指標は、分析の精度と速度を向上させようとしている初心者とプロのトレーダーの両方にとって理想的です。 主な利点 直感的なインターフェイス:"ショー"機能をサポートするユーザーフレンドリーなボタンパネルを介してすべての機能を制御します。|気を散らすものを最小限に抑えるために「非表示にします。 設定の柔軟性:カスタマイズ可能な色、ラインスタイルと太さだけでなく、あなたの取引スタイルに適応するためのボタンのサイズと位置。 マルチタイムフレームのサポート:トレンドラインと長方形は現在の時間枠と下の時間枠に表示され、AP/DWラインとキーボタンはすべての時間枠に表示さ 安定した配置:
このユニークな自動トレンドラインドローイングインジケーターはすべての時間枠で機能し、短期トレンドの反転だけでなく、市場でより強い資産を示す短期トレンドブレイクアウトを簡単に取引するのに役立ちます。 それはあなたが激しいスイングのために早く入ることをユニークに可能にします。 入力には次のものが含まれます。 -マックスキャンドルはトレンドラインを振り返る -線の種類と色 -外側のバンドまでの最大距離とバンド期間 -確認キャンドルまたは価格が閉じたときにピボットからトレンドラインを自動再描画するオプション低低または高高(ダブルボトム低および高サポート)および再描画の最大キャンドル数。 -改行の4つのオプション: 1)価格がラインを超えたときに削除する 2)削除しないでください 3)ろうそくがラインを超えて閉じたときに削除する 4)トレンドに逆らって閉じるときに削除する
KFX Symbol Changer
Peter Kariuki Thande
4 (1)
KFX SMA: Symbol Changer + Moving Average (3x) + ATR + RSI + Candle Timer. This indicator allows you to create a Symbol list and change between symbols of the current chart or Timeframe by selecting the appropriate button. On Chart there are three(3) multi timeframe Moving Averages shown (selected by you), ATR Value MTF ( selected by you -  helps with setting SL and TP), RSI Value MTF (selected by you) and a Candle Timer.   Features: - Symbol Changer : Change Symbol and Timeframe of Chart.   (s
FREE
Oscillator helps determine the direction of the market Shows the direction of the price movement and is painted in the appropriate color. Allows you to conduct trend and counter trend trading It works on all timeframes, on any currency pairs, metals and cryptocurrency Can be used when working with binary options Distinctive features Does not redraw; Simple and clear settings; It works on all timeframes and on all symbols; Suitable for trading currencies, metals, options and cryptocurrency (Bitco
The indicator sends messages to e-mail and mobile terminal when the price approaches the horizontal levels and trend lines that are drawn using the handy panel! The levels and trend lines are deleted and placed to the chart using one click on the panel, and they can be dragged on the chart by mouse! It is possible to set the interval between messages in the settings, the interval is applied to each object separately! Indicator Settings ===*** Main settings ***=== - below is the list of the main
DailyHighLow
Komi Eyram F Kahoho
5 (1)
インジケーターを評価して、可視性向上にご協力いただければ幸いです。 DailyHighLow インジケーターは、MetaTrader 4 (MT4) プラットフォーム用に設計されており、トレーダーが日々の価格変動を監視するのに役立ちます。このインジケーターは、指定した期間の最高値と最低値に基づいて自動的にトレンドラインを描画し、正確な市場情報を視覚的に提供します。 主な特徴: トレンドラインのカスタマイズ: トレーダーの好みに合わせて、トレンドラインの色、スタイル、幅を調整できます。トレンドラインには、ブレイクとノンブレイクの両方の設定が可能です。 動的な更新: トレンドラインは最新の市場データに基づいて自動的に調整され、ブレイクの状況を示す視覚的なマーカーが用意されています。 柔軟なパラメータ設定: 表示する日数の設定、ブレイク後のラインの終了時間、および高値と安値のトレンドラインの外観をカスタマイズできます。 明確な視覚効果: ブレイクラインとノンブレイクラインを異なる色とスタイルで区別し、市場の主要レベルを迅速に識別できます。 このインジケーターは、トレンドラインを明確にカスタマ
FREE
Contact me after payment to send you the User-Manual PDF File. This indicator gives a signal when the probability of starting a trend is high. To calculate entry points, it uses a combination of some indicators like "Moving Average", "ADX", RSI with support and resistance points. This indicator is a trend follower and it doesn't determine that TP because it is not necessary, it uses the stop-loss trailing system (Of course, the indicator determines the SL, but you have to move it yourself becau
MQLTA Candle Timer
MQL4 Trading Automation
5 (1)
MQLTA Candle Timer is an indicator that can show you the details about a symbol/pair and alert you before the close of a candle. Used in swing trading and not only, it can help your strategies knowing and be ready before the close of a candle. How does it work Simply add the indicator to the chart and set the notifications options. You can load a minimalistic interface or a full interface. The alert will be sent once per candle. Parameters All the parameters, that you can see in the picture, a
FREE
Space X    it is a Secure Automated Software for trade Forex market and indices. The architecture is a Fully Automatic Autonomous Robot Expert capable of independently analyzing the market and making trading decisions        Space X   It is an advanced and professional trading system. This is a FULL configurable system.     Space X       is a professional system, Ready to personalized your profile.                                         You can download the demo and test it yourself.      
NAM Divergences
NAM TECH GROUP, CORP.
5 (1)
MT4マルチタイムフレームの発散と売られ過ぎ/売られ過ぎの検出インジケーター。 特徴 -チャートコントロールパネルで完全にカスタマイズ可能で、完全な相互作用を提供します。 -必要な場所でコントロールパネルを表示および非表示にします。 -資本化されていない発散に関するリアルタイムの情報。 -売られ過ぎ/売られ過ぎの状況に関するリアルタイム情報。 -定期的な発散に関するリアルタイムの情報。 -隠れた発散に関するリアルタイム情報。 -発散検出に使用できる発振器:AO、RSI、CCI、MACD、STOCH、RMI、TDI、RSIOMA。 -通知サービス(画面アラート|プッシュ通知)。 概要 発散取引を使用すると、弱体化傾向や勢いの逆転を見つけるのに役立ちます。トレンドが続くためのシグナルとして使用できる場合もあります。私たちのツールは、チャートを可能な限りクリーンに保つために、表示と非表示の可能性を備えた驚くほど快適で直感的なコントロールパネルで、すべての時間枠で同時に発散検出を提供します。 選択した履歴期間に、買われ過ぎと売られ過ぎの状況、通常の相違、隠れた相違
Anemone
Sean Christian Hammond
人工知能(AI)を用いて、生物の目に見える行動パターンを傾向分析に取り込むために作成。 カオス理論は移動平均と出会う。 イソギンチャクに餌を与えるフィルターは、その蔓を伸ばして栄養の海に出し、自分自身を豊かにします。 私は過度に長い説明であなたの時間を無駄にしません、概念はこれらの用語で理解できます。 そのカスタマイズ可能な期間回転移動平均は、あなたが指定した時間入力で、単純、指数、加重、平滑化の間で切り替わります。 ローテーションはセミカオスであり、市場自体によって注入されたランダム性です。 これらのMAを積み重ねると、イソギンチャクのフィルターが巻きひげを環境に伸ばして餌を摂るような効果が得られます。
Moving Average Trend Scanner is a multi symbol multi timeframe triple MA crossover dashboard that helps traders to monitor, and identify potential market trends from one chart. This panel scans 3 moving averages in up to 28 configurable instruments and 9 timeframes for triple moving average alignment and moving average crossover  with a deep scan feature to scan all market watch symbols (up to 1000 instruments!). Download Demo here  (Scans only M1 and W1) Settings description here MT5 version
Vanguard Gold Sentinel: Robust H1 Trend-Following Engine Product Description: Vanguard Gold Sentinel is a high-precision algorithmic trading system designed exclusively for XAUUSD (Gold) on the 1-hour (H1) timeframe . Unlike generic EAs, this system has been subjected to rigorous robustness testing—including exhaustive Walk Forward analysis—to ensure its adaptability across shifting market cycles from 2015 to 2026. At its core, Sentinel is engineered to capture institutional trends by combining
Strong: A Powerful Forex Bot for Multi-Currency Trading Strong is an automated tool for trading on the Forex market, utilizing modern technologies and algorithms. It is designed for traders who aim to improve the efficiency of their trading and reduce risks in a constantly changing market. Key Features of Strong Multi-Profile Trading: Strong supports a wide range of currency pairs, including both major and exotic assets. This allows traders to diversify their portfolios and adapt strategies to
This indicator calculates the strength of the major currencies (EUR, USD, CAD, GBP, CHF, NZD, USD, JPY) and shows the top 4 strongest currency pairs that are currently in a high probability trend for the day or for the week. Usage The indicator displays 8 currency pairs with a trend direction (e.g. "EURUSD-DOWN") and ranked according to strength, with 1 being ths strongest. There will be 4 pairs for intraday and 4 pairs for intraweek If a currency pair is present in the top 4 intraday, it is in
This automated VOLUME SCALPING INDICATOR can be utilized to manage trades and identify potential areas of support and resistance for both buying and selling. It is designed to identify zones for Sell/Buy trades based on the volume analysis and can be effectively used in conjunction with other indicators, such as order block indicators, and more. Currently designed for MT4, it will later be adapted to function on MT5. We also offer the opportunity to customize the robot according to your trading
FREE
Hedging Lots Repeat
Luis Mariano Vazquez Marcos
ADX Forex Trading Strategy (Hedging Lots Repeat) I use this robot every day on my real accounts. This Forex trading robot has been developed by MRBEAST as a tool to facilitate day trading. Please note that using this robot involves certain risks and does not guarantee consistent profits in the forex market. The trading robot is based on algorithms and strategies that I have designed, which have been created using my knowledge and experience in the field of trading. However, past performance d
Description I think, almost all traders dream about non-lagging MA. I have realized that dream in my indicator. It allows forecasting future MA values! The indicator can be used in four different ways: The first one - forecast for the desired amount of bars. Thus, you are able to evaluate future price behavior. The second one - generating non-lagging "averages". That can be implemented by moving MA back by the half of the averaging period and setting the forecast the necessary amount of bars ahe
FREE
MetaTrader 5用スマートピボットポイント — スマートな取引のための明確なレベル スマートピボットポイントは、MetaTrader 5用のプロフェッショナルインジケーターです。チャート上に主要な取引レベルを自動計算し、表示します。混沌とした価格変動を、明確な構造化されたマップに変換し、サポート、レジスタンス、価格バランス、そして潜在的なターゲットゾーンをハイライトします。明瞭性を重視するトレーダーのために設計されたこのツールは、FX、仮想通貨(ビットコイン、イーサリアム)、株価指数、株式、コモディティ(XAUUSD)など、あらゆる市場で機能します。 このインジケーターは、計算時間を節約し、分析に客観性をもたらす、信頼できる分析アシスタントです。市場シグナルを提供したり、代わりに意思決定を行うわけではありませんが、情報に基づいた独自の取引判断のための高品質な情報基盤を提供します。 主な機能とメリット すぐに使える価格座標システム:もう手動でレベルを描く必要はありません。中心レベル(バランス)、サポート、レジスタンス、買いターゲット、売りターゲットの5本の明確なラインがチャ
Introducing the Donchian Channels indicator for MQL4, a powerful technical analysis tool designed to boost your trading success. This indicator consists of four lines that represent the upper and lower boundaries of price movement over a specified period. With the Donchian Channels indicator, you can easily identify potential breakouts and reversals in the market. The upper line shows the highest high of the specified period, while the lower line represents the lowest low. The space between thes
The EA uses scalping strategy at night, trading consists of three algorithms and each algorithm works in its own time interval. The EA uses many smart filters to adapt to almost any economic situation. Pending orders are used for the least slippage when trading scalping. The adviser is safe and does not require any settings from the user, just install it on the chart and you are ready. The EA sets a protective stop order, so the trader does not have to worry that the robot will allow significant
ZoneDominator AI
Mohammad Ziad Abdelwahed Alkahlah
ZoneDominator AI — Adaptive Multi-Timeframe Support & Resistance Indicator Overview ZoneDominator AI is an advanced analytical indicator that continuously scans all timeframes to locate the most accurate and relevant Support & Resistance zones. It uses a unique combination of ATR volatility, Moving Averages, Price Action, and higher-timeframe confirmation to adapt in real time to market structure. You can choose your preferred trading style — Scalping, Intraday, or Swing — and the indicat
フィボナッチ・トレンド・マーカー (Fibonacci Trend Marker) は、現在のローソク足が過去のローソク足の高値-安値(High-Low、HL)範囲に対してどのように振る舞うかを、フィボナッチ・リトレースメントレベルを用いて分析するトレンド指標です。トレンドの強さを視覚的に追跡し、ローソク足の色の変化を通じてトレンドの弱まりや反転の可能性を示します。 特徴: トレンド重視のトレーダーのために設計されており、フィボナッチレベルに基づいてトレンドの変化を素早く検出します。 市場のボラティリティが十分で、3~5本のローソク足が明確な動きを形成する場合、あらゆる時間枠で有効です。 ローソク足のサイズはチャートのスケールに自動的に適応し、ズーム時にも正確な表示を保証します。 現在のローソク足をリアルタイムで分析することでトレンド変化に高い感度を持ち、M1やM5の時間枠でのスキャルピングに最適です。 取引方法: エントリー: 前の閉じたローソク足の色が変化した後にポジションを開きます。例えば、赤いローソク足の後に青で閉じた場合、上昇トレンドのシグナルとなり、買い(Buy)の取引
R Var 移動平均インジケーターは、根っからのトレンド フォロワー向けに設計されたトレンド フォロー インジケーターです。 これは、株式トレーダーや商品トレーダーの間で非常に人気のある外国為替取引指標であり、その人気は、本物のお金を稼ぐシグナルをユーザーに配信する能力に由来しています. インジケーターは、シエナ ライン上に配置された緑と赤のドットで構成されます。 緑色の点は強気のシグナルを示し、赤色の点は弱気のシグナルを示しています。 基本的な取引シグナル 買いシグナル: インディケータのシエナラインの点が緑色に変わったらロング。 売りシグナル: インジケーターのシエナ ライン上のドットが赤に変わったらショートします。 買い取引を終了する: 強気トレンドが進行している間にインジケーターのシエナ ラインに赤い点が表示された場合は、すべての買い注文を閉じます。 売りトレードを終了する: 弱気トレンドが進行中に、R Var 移動平均インジケーターのシエナ ラインに緑色の点が表示された場合は、すべての売り注文を閉じます。 チップ R Var 移動平均インジケーターを使用する場合は、
FREE
Breakout Box
Claus Dietrich
4.33 (24)
BREAKOUT-SESSION-BOX LONDON EU US ASIA Open watch the expectation of a volatile movement above or under the opening range We take the high of the range as Entry for a long trade and SL will be the low of the range and vice versa the low of the range as Entry for a short trade and the high for SL The size of the range is the distance to the TP (Take Profit) The range of the opening hours should not be larger than about 1/3 of the average daily range 4 breakout examples are already predefined: A
FREE
I  recommend you to read the   product's blog  (manual) from start to end so that it is clear from the beginning what the indicator offers. This multi time frame and multi symbol indicator scans for engulfing and tweezer formations. The indicator can also be used in single chart mode. Combined with your own rules and techniques, this indicator will allow you to create (or enhance) your own powerful system. Features Can monitor all symbols visible in your Market Watch window at the same time. Ap
This Expert Advisor uses ATR as CORE indicator for GRID operative.ATR measures intrinsec volatility. Using ATR on a GRID, you will give enought space between lines considering current volatility. On this EA, you can set ATR period and timeframe parameters, and also you can set a ATR multiplier factor, to increase margin between each GRID level. In the same way, you can also configure the number of GRID levels (up and down) as well as the color of the drawn lines. In addition, it has a start/en
Octet   指標は多通貨であり、56の通貨ペアを同時に分析します。すべての通貨ペアが市場の概要にあり、それらの相場がロードされていることが重要です。 インディケータは、他の7つの通貨に対する特定の通貨の上昇または下降を線の形で示します。指標値はパーセンテージで表されます。 インジケーター設定の説明 Type_Calculation-通貨の成長または下降のパーセンテージを計算するための3つのオプション プレフィックス-通貨ペアの指定にプレフィックスがある場合に使用されます。例:EURUSD.fxp、設定Prefix = .fxp Show_AUD-他の7つの通貨と比較したAUD通貨の合計計算値を表示します Show_EUR-他の7つの通貨と比較したEUR通貨の合計計算値を表示します Show_GBP-他の7つの通貨と比較したGBP通貨の計算値の合計を表示します Show_NZD-他の7つの通貨と比較したNZD通貨の合計計算値を表示します Show_CAD-他の7つの通貨と比較したCAD通貨の合計計算値を表示します Show_CHF-他の7つの通貨と比較したCHF通貨の合計計算値を表
このプロダクトを購入した人は以下も購入しています
Neuro Poseidon is a new indicator by Daria Rezueva. It combines precise trading signals with adaptive TP/SL levels - creating best possible trades as a result! Message me and get  Neuro Poseidon Assistant  as a gift to automize your trading process! What makes it stand out? 1. Proven profitability on all assets and timeframes 2. Only confirmed BUY and SELL signals present on the chart 3. Adaptive TP & SL levels generated by the software for each trade 4. Easy to understand - suitable for all
Dynamic Forex28 Navigator - 次世代の Forex 取引ツール。 現在 49% オフ。 Dynamic Forex28 Navigator は、長年人気のインジケーターを進化させたもので、3 つの機能を 1 つにまとめています。 Advanced Currency Strength28 インジケーター (レビュー 695 件)  + Advanced Currency IMPULSE with ALERT (レビュー 520 件) + CS28 コンボ シグナル (ボーナス)。 インジケーターの詳細 https://www.mql5.com/en/blogs/post/758844 次世代の Strength インジケーターが提供するもの  オリジナルで気に入っていたすべての機能が、新機能と精度の向上によって強化されました。 主な機能: 独自の通貨強度計算式。 すべての時間枠でスムーズかつ正確な強度ライン。 トレンドの特定と正確なエントリーに最適です。 ダイナミックマーケットフィボナッチレベル (マーケットフィボナッチ)。 このインジケーターに固有
このインジケーターは実践的なトレードに最適な自動波動分析のインジケーターです! 場合... 注:   Tang Lun (Tang Zhong Shuo Zen) の命名規則の影響で、私は波のグレーディングに西洋の名前を使用することに慣れていません。基本的な波を ペン 、二次波のバンドを セグメント と名付けました。同時に、 セグメント にはトレンドの方向が指定されます (この命名方法は将来のノートで使用されます。最初に言っておきます)。ただし、アルゴリズムは曲がりくねった理論とはほとんど関係がないため、付けるべきではありません。これは、私の市場分析 によって要約された、絶えず変化する複雑な運用ルール を反映しています。 バンドは標準化され、人によって異なることがないよう定義されており、市場参入を厳密に分析する上で重要な役割を果たす人為的な干渉の描画方法が排除されています。 このインジケーターを使用することは、取引インターフェイスの美しさを改善することと同等であり、元の K ライン取引を放棄し、取引の新しいレベルに連れて行きます。また、宣伝の観点から顧客の認識も向上します。 イ
多くの矢印インジケーターは、シグナルだけを表示して、その後の判断はすべてトレーダー任せです。KT Alpha Hunter Arrows は、最初から完成されたトレードプランを提供します。 各シグナル矢印が表示されると、エントリーライン、ストップロス、4つのテイクプロフィット水準、そして現在の銘柄と時間足を今トレードする価値があるかを示すリアルタイムのエッジ判定が、チャート上にまとめて描画されます。付属の Trade Manager EA は、手動でエントリーした後の管理をサポートし、相場が荒れて感情が揺れやすい場面でも、トレードの規律を保ちやすくします。リペイントなし。確定足のみでシグナルを表示。Forex、ゴールド、指数、その他あなたが取引するあらゆる銘柄向けに設計されています。 主な機能 リペイントしない買い・売り矢印。シグナルは足が確定した後にのみ表示されます。 各シグナルにエントリーライン、構造的なストップロス、4つのテイクプロフィット水準を表示。 Edge Dashboard が、現在のチャート上で買いと売りのセットアップを個別に評価。 判定システム:No Edge、Ma
Scalper Inside PRO Scalper Inside PRO は、MetaTrader 4 向けの短期トレンドおよびスキャルピング用インジケーターです。独自アルゴリズムを用いて、市場の方向性と主要なターゲットレベルを素早く検出します。エントリー、イグジット、複数の利確ターゲットを自動計算し、詳細なパフォーマンス統計を表示することで、さまざまな銘柄やストラテジーがどのように機能してきたかを確認できます。これにより、現在のマーケットコンディションに最も適した取引銘柄を選択するのに役立ちます。さらに、Scalper Inside PRO には、お使いの矢印インジケーターを簡単に接続でき、その統計と過去のパフォーマンスを素早く評価できます。 本インジケーターは、あらゆる銘柄と時間足で動作し(短期トレードには M5 を推奨)、複数の内蔵ストラテジーを備えています。そのため、単体のスキャルピングツールとしても、トレーディングシステム内の強力な分析コンポーネントとしても活用できます。 主な機能 独自アルゴリズム(Next‑Generation Trend Detection Algor
Price & Time Market Structure Indicator A professional market structure tool that analyzes waves through both price and time — not price alone. Main Description NeoWave PRO is a professional market structure indicator for MetaTrader 4 designed for traders who want to move beyond traditional one-dimensional wave tools such as ZigZag, swing indicators, and basic high/low systems. Most wave indicators analyze only one thing: Price. But a real market wave is not only a price movement. A true wave de
Current event:  https://c.mql5.com/1/326/A2SR2025_NoMusic.gif A. A2SR とは何ですか ?   * 先行テクニカル指標です (塗り直しなし、ラグなし)。 -- ガイダンス : -- https://www.mql5.com/en/blogs/post/734748/page4#comment_16532516 -- そして https://www.mql5.com/en/users/yohana/blog A2SR には、サポート (需要) とレジスタンス (供給) のレベルを決定する特別な手法があります。 ネットで見かける通常の方法とは異なり、A2SR は実際の SR レベルを決定する独自のコンセプトを持っています。 元の手法はインターネットから取得されたものではなく、インターネット上で公開されたこともありません。 A2SR は、取引スタイルに応じて SR レベルを自動選択します。 時間枠を変更しても、SR レベルはその位置にとどまります。 実際のSRは、使用する時間枠から取得されるわけではないため. A2SR
MetaBands M4
Vahidreza Heidar Gholami
3.5 (6)
MetaBandsは、強力でユニークなアルゴリズムを使用してチャンネルを描画し、トレンドを検出して、トレーダーに取引の入出ポイントを提供することができます。チャンネル指標に加えて、強力なトレンド指標でもあります。入力パラメータを使用して新しいチャンネルを作成するために、異なるタイプのチャンネルを統合することができます。MetaBandsは、市場のイベントについてユーザーに通知するために、すべてのタイプのアラートを使用します。 特徴 ほとんどのチャンネルアルゴリズムをサポート 強力なトレンド検出アルゴリズム 異なるタイプのチャンネルを統合する能力 マルチタイムフレームおよびマルチカレンシー(シグナルマトリックス) すべてのタイプのアラート機能(サウンド、画面フラッシャー、プッシュ通知、メール、ポップアップ、矢印) 再描画しない トレンド検出 MetaBandsは、チャネル内を振動する青いラインを使用してトレンドを検出します。ラインがチャネルの上部バンドに達すると、下降トレンドの開始を示し、下部バンドに達すると上昇トレンドの開始を示します。青いラインが中心ラインに近づくと、市場はコンソリ
この製品は 2026 年の市場向けに更新され、最新の MT5 ビルドに最適化されています。 価格更新のお知らせ: Smart Trend Trading System は現在 $99 で提供されています。 次の 30 件の購入 後、価格は $199 に上がります。 特別オファー: Smart Trend Trading System を購入後、私にプライベートメッセージを送ることで、 Smart Universal EA を無料 で受け取り、Smart Trend のシグナルを自動売買に変えることができます。 Smart Trend Trading System は、リペイントなし、再描画なし、遅延なしの完全なトレーディングシステムです。よりクリーンなシグナル、より明確なトレンド方向、そしてより整理された取引方法を求めるトレーダー向けに作られています。 Online course , manual and download presets . このシステムは、トレンド検出、反転ゾーン、Smart Cloud、トレーリングストップロジック、サポートとレジスタンス、ローソク足の色分け、ア
Advanced Supply Demand
Bernhard Schweigert
4.91 (300)
現在40%オフ 初心者にもエキスパートトレーダーにも最適なソリューション このインジケーターは独自の機能と新しい公式を多数内蔵しており、ユニークで高品質かつ手頃な取引ツールです。このアップデートでは、2つの時間枠ゾーンを表示できるようになります。より長いTFだけでなく、チャートTFとより長いTF(ネストゾーンを表示)の両方を表示できます。すべてのSupply Demandトレーダーの皆さんのお気に召すはずです。:) 重要情報の公開 Advanced Supply Demandの可能性を最大化するには、 https://www.mql5.com/ja/blogs/post/720245 にアクセスしてください。   エントリーまたはターゲットの正確なトリガーポイントを正確に特定できれば取引がどのように改善されるか想像してみてください。新しい基盤となるアルゴリズムに基づいて構築されているため、買い手と売り手の間の潜在的な不均衡をさらに簡単に特定できます。これは、最も強い需要と供給のゾーンと、過去のパフォーマンス(古いゾーンを表示)がグラフィカルに表現されるためです。これらの機能は、最適な
IQ FX Gann Levels a precision trading indicator based on W.D. Gann’s square root methods . It plots real-time, non-repainting support and resistance levels to help traders confidently spot intraday and scalping opportunities with high accuracy. William Delbert Gann (W.D. Gann) was an exceptional market analyst, whose trading technique was based on a complex blend of mathematics, geometry, astrology, and ancient mathematics which proved to be extremely accurate. Setup & Guide:  Download  MT5 Ver
スイングトレーディング は、トレンドの方向のスイングと可能な反転スイングを検出するように設計された最初のインジケーターです。トレーディングの文献で広く説明されているベースラインスイングトレーディングアプローチを使用します。インディケータは、いくつかの価格と時間のベクトルを調査して、全体的なトレンドの方向を追跡し、市場が売られ過ぎまたは買われ過ぎて修正の準備ができている状況を検出します。 [ インストールガイド | 更新ガイド | トラブルシューティング | よくある質問 | すべての製品 ] むち打ちを起こさずに市場スイングの利益 インジケーターは常にトレンドの方向を表示します 色付きの価格帯は機会のベースラインを表します 色付きのダッシュは、可能な反転スイングを表します この指標は、独自の品質とパフォーマンスを分析します 複数時間枠のダッシュボードを実装します カスタマイズ可能なトレンドおよびスイング期間 電子メール/サウンド/プッシュアラートを実装します インジケータは再描画またはバックペインティングではありません Swing Tradingとは Swing Tradingは
「 Dynamic Scalper System 」インジケーターは、トレンド波の中でスキャルピング取引を行う手法のために設計されています。 主要通貨ペアと金でテスト済みで、他の取引商品との互換性があります。 トレンドに沿った短期的なポジションオープンのシグナルを提供し、追加の価格変動サポートも提供します。 インジケーターの原理 大きな矢印はトレンドの方向を決定します。 トレンド波の中では、小さな矢印の形でスキャルピングシグナルを生成するアルゴリズムが機能します。 赤い矢印は強気方向、青い矢印は弱気方向です。 トレンドの方向には敏感な価格変動ラインが描かれ、小さな矢印のシグナルと連動します。 シグナルは次のように機能します。適切なタイミングでラインが現れるとエントリーシグナルが形成され、ラインが開いている間はポジションが保持され、完了すると取引が終了します。 推奨される動作時間枠はM1~H4です。 矢印は現在のローソク足に形成され、次のローソク足が開いている場合は、前のローソク足の矢印は再描画されません。 入力パラメータ Trend Wave Period - トレンド方向
M30/H1/H4スイング版もあります M5/M15では取りきれない大きな波を狙いたい方へ。 Gold Signal Swing Pro(M30/H1/H4対応)を販売中。 1トレードで$20〜$80+の値幅を狙う。 https://www.mql5.com/en/market/product/177643 KURAMA GOLD SIGNAL PRO(MT4版)— 7層フィルター・自動TP/SL・品質スコア搭載 XAUUSD完全トレードシステム リペイントなし。リドローなし。ラグなし。すべてのサインは確定後に変わりません。見たままが結果です。 特典:買い切りライセンスをご購入いただいた方に、AI Zone Radar($59相当)+PDFマニュアルを無料プレゼント。購入後にMQL5でメッセージをお送りください。 AI Zone Radar: https://www.mql5.com/en/market/product/175834 トレーダーから信頼されています:ゴールドトレーダーのコミュニ
MonsterDash Harmonic Indicator is a harmonic pattern dashboard. It recognizes all major patterns. MonsterDash is a dashboard that displays all detected patterns for all symbols and (almost) all timeframes in sortable and scrollable format. Users can add their own user defined patterns . MonsterDash can open and update charts with the pattern found. Settings MonsterDash's default settings are good enough most of the time. Feel free to fine tune them to your needs. The color settings are for thos
地震計マーケット クエイク検出器。 Description in English : https://www.mql5.com/en/market/product/113869?source=Site+Market+Product+Page#description How to use the Seismograph : https://www.mql5.com/en/market/product/113869#!tab=comments&page=2&comment=52806941 Create an EA : https://www.mql5.com/en/market/product/113869#!tab=comments&page=3&comment=52816509 どのような取引方法であれ、流動性の低い市場への参入は避けたいものです。 地震計は、市場が上昇する前に市場に参入する適切なタイミングに役立ちます。 しかし、忙しいはずの市場時間帯にエントリーするようにしたにもかかわらず、流動性の低い市場に閉じ込められてしまう人が多いのが実情です。 数時間待った後、
現在40%オフ 初心者やエキスパートトレーダーに最適なソリューション! このインジケーターは、独自の機能と新しい計算式を取り入れた、ユニークで高品質、かつ手頃な価格のトレーディングツールです。たった1枚のチャートで28の為替ペアの通貨強度を読み取ることができます。新しいトレンドやスキャルピングチャンスの引き金となるポイントを正確に特定することができるので、あなたのトレードがどのように改善されるか想像してみてください。 ユーザーマニュアルはこちら  https://www.mql5.com/en/blogs/post/697384 これが最初の1本、オリジナルだ! 価値のないクローンを買わないでください。 特別な サブウィンドウの矢印で強い通貨の勢いを表示 GAPがあなたのトレードを導く! 基準通貨や気配値が売られすぎ・買われすぎのゾーン(外相フィボナッチレベル)にあるとき、個別チャートのメインウィンドウに警告表示。 通貨がレンジの外側から反落した場合、プルバック/リバーサルのアラート。 クロスパターンの特別なアラート 複数の時間枠を選択可能で、トレンドを素早く確認できます
Enigmera
Ivan Stefanov
5 (8)
ENIGMERA: 市場の中心 重要:MQL5.comのデモはStrategy Testerで実行されており、Enigmeraの機能を完全には反映していない場合があります。詳細については、説明、スクリーンショット、ビデオをご確認ください。質問があれば、遠慮なくメッセージを送ってください! インジケーターのコードは完全に書き直されました。バージョン3.0は新機能を追加し、インジケーターの開始以来蓄積されたバグを修正しました。 紹介 このインジケーターとトレーディングシステムは、金融市場への注目すべきアプローチです。ENIGMERAはフラクタルサイクルを使用して、サポートとレジスタンスのレベルを正確に計算します。真の蓄積フェーズを示し、方向と目標を提供します。トレンドでも修正でも機能するシステムです。 動作方法 インジケーターのほとんどの機能は、チャートの左側にあるボタンで制御され、市場の状況に迅速に対応できるようになっています。 ボタン ON/OFF – インジケーター全体を表示または非表示にします。 Channel – サポートチャネルを有効にし、許容範囲の偏差を示します。 Dev
Introduction to Fractal Pattern Scanner Fractal Indicator refers to the technical indicator that makes use of the fractal geometry found in the financial market. Fractal Pattern Scanner is the advanced Fractal Indicator that brings the latest trading technology after the extensive research and development work in the fractal geometry in the financial market. The most important feature in Fractal Pattern Scanner is the ability to measure the turning point probability as well as the trend probabi
トレンドラインプロ   市場の真の方向転換点を理解するのに役立ちます。この指標は、真のトレンド反転と主要プレーヤーが再び参入するポイントを示します。 分かりますか     BOSライン   複雑な設定や不要なノイズなしに、より長い時間足でのトレンドの変化と重要なレベルを把握できます。シグナルは再描画されず、バーが閉じた後もチャート上に残ります。 VERSION MT 5     -     RFI LEVELS PRO インジケーター と組み合わせることで、その潜在能力を最大限に発揮します。 インジケーターが示す内容: 本当の変化   トレンド(BOSライン) 一度シグナルが現れたら、それは有効です!これは、リペイント機能を持つインジケーターとの重要な違いです。リペイント機能を持つインジケーターは、シグナルを発した後、それを変更し、資金の損失につながる可能性があります。これにより、より高い確率と精度で市場に参入できます。また、矢印が現れた後、目標値(利益確定)に達するか、反転シグナルが現れるまで、ローソク足の色を変更する機能もあります。 繰り返しエントリ       主要プレーヤーの
The Propfolio Master Suite is the ultimate all-in-one analytical workstation for professional traders. Combining the power of the Beat The Market Maker (BTMM) methodology, Smart Money Concepts (SND/Liquidity), and Advanced Volume Profile, this suite replaces multiple different indicators with one optimized engine. Monitor up to 14 pairs simultaneously from a single chart, instantly identify market cycles, and seamlessly map institutional footprints with the click of a button. The Command Center
このインジケーターは、反転ポイントと価格戻りゾーンを正確に表示します。     主要プレーヤー 。新たなトレンドが形成される場所を把握し、最大限の精度で意思決定を行い、すべての取引をコントロールします。 TREND LINES PRO インジケーターと組み合わせることで、その潜在能力を最大限に発揮します。 VERSION MT5 インジケーターが示す内容: 新しいトレンドの始まりに活性化する反転構造と反転レベル。 リスクと報酬の比率を最小限に抑えた利益 確定 と 損失停止の レベルの表示     RR 1:2   。 インテリジェントな削減ロジックによるストップロス。 指定されたインジケーターから 2 つのトレンド タイプの反転パターンを表示します。 指標: トレンドを追う   TREND LINES PRO   (世界的なトレンドの変化) TREND PRO   (クイックトレンド変更) シンプルで効果的   スキャナー   リアルタイムトレンド(新機能)。 マルチタイムフレームのインストゥルメント フィルタリング。 画面   利益     LOGIC AI信号の後。 当日プラス方
Gold Venamax   - これは最高の株式テクニカル指標です。 指標アルゴリズムは資産の価格変動を分析し、ボラティリティと潜在的なエントリーゾーンを反映します。 インジケーターの機能: これは、快適で収益性の高い取引のためのマジックとトレンド矢印の 2 つのブロックを備えたスーパー インジケーターです。 チャート上にブロックを切り替えるための赤いボタンが表示されます。 マジックはインジケーター設定で設定されているため、異なるブロックを表示する 2 つのチャートにインジケーターをインストールできます。 Gold Venamax は、異なる矢印バッファー (GV と SD) を備えた 2 つのチャートに配置できます。 これを行うには、設定で異なる Magic を選択する必要があります。たとえば、あるマジック = 999、別のマジック = 666 を選択します。次に、チャート上の赤いボタンで矢印バッファを選択できます。 インジケーター設定の各矢印バッファー (GV および SD) には、快適で収益性の高い取引のための個別の矢印フィルターがあります (UseFiltrGV = tru
Trend Breakout Arrows Indicator The Trend Breakout Arrows Indicator is a momentum-based signal tool designed to identify potential bullish and bearish breakout opportunities. It displays clear arrow signals directly on the price chart, helping traders quickly recognize possible trend changes and continuation setups. Up Arrow (Buy Signal) A magenta up arrow appears below a candle when bullish momentum begins to strengthen. This signal indicates that buying pressure may be overtaking selling press
RelicusRoad Pro: 定量的市場オペレーティングシステム 【期間限定】無制限アクセス 70% OFF - 2,000人超のトレーダーと共に なぜ多くのトレーダーは「完璧な」インジケーターを使っても失敗するのでしょうか? それは、文脈を無視して 単一の概念 だけでトレードしているからです。文脈のないシグナルは単なるギャンブルです。勝ち続けるには、 根拠の重なり(コンフルエンス) が必要です。 RelicusRoad Proは単なる矢印インジケーターではありません。完全な 定量的市場エコシステム です。独自のボラティリティモデリングを用いて、価格が推移する「適正価値の道(Fair Value Road)」をマッピングし、ノイズと真の構造的ブレイクを判別します。 推測はやめましょう。機関投資家レベルの「ロード・ロジック」でトレードを。 コアエンジン:「Road」アルゴリズム システムの中心となる Road Algo は、市場環境にリアルタイムで適応するダイナミックなボラティリティチャネルです。 安全ライン(平衡点) と、価格が数学的に反転しやすい 拡張レベル を投影します。 Si
これはほぼ間違いなく、MetaTraderプラットフォームで見つけることができる最も完全な調和価格形成自動認識インジケーターです。 19種類のパターンを検出し、フィボナッチプロジェクションをあなたと同じように真剣に受け止め、潜在的逆転ゾーン(PRZ)を表示し、適切なストップロスとテイクプロフィットレベルを見つけます。 [ インストールガイド | 更新ガイド | トラブルシューティング | よくある質問 | すべての製品 ] 19の異なる調和価格形成を検出します プライマリ、派生および補完フィボナッチ投影(PRZ)をプロットします 過去の価格行動を評価し、過去のすべてのパターンを表示します この指標は、独自の品質とパフォーマンスを分析します 適切なストップロスとテイクプロフィットのレベルを表示します ブレイクアウトを使用して適切な取引を通知します すべてのパターン比をグラフにプロットします 電子メール/音声/視覚アラートを実装します スコット・M・カーニーの本に着想を得て、この指標は最も純粋で急を要するトレーダーのニーズを満たすように設計されています。ただし、トレードを容易にする
FX Power: 通貨の強弱を分析して、より賢い取引を実現 概要 FX Power は主要通貨と金の実際の強弱をあらゆる市場状況で理解するための必須ツールです。強い通貨を買い、弱い通貨を売ることで、 FX Power は取引の意思決定を簡素化し、高い確率の取引機会を見出します。トレンドを追従する場合でも、極端なデルタ値を使用して反転を予測する場合でも、このツールはあなたの取引スタイルに完全に適応します。ただ取引するだけではなく、 FX Power で賢く取引をしましょう。 1. なぜ FX Power がトレーダーにとって非常に有益なのか 通貨と金のリアルタイム強弱分析 • FX Power は主要通貨と金の相対的な強弱を計算し、マーケットダイナミクスに関する明確な洞察を提供します。 • どの資産がリードしているか、または後れを取っているかを監視して、取引するペアを賢く選びましょう。 マルチタイムフレームの包括的なビュー • 短期、中期、長期のタイムフレームで通貨と金の強弱を追跡し、マーケットトレンドに基づいて取引戦略を調整できます。 • スキャルピングからスイングトレード
NAM Order Blocks
NAM TECH GROUP, CORP.
3.67 (3)
MT4マルチタイムフレームオーダーブロック検出インジケーター。 特徴 -チャートコントロールパネルで完全にカスタマイズ可能で、完全な相互作用を提供します。 -必要な場所でコントロールパネルを表示および非表示にします。 -複数の時間枠でOBを検出します。 -表示するOBの数量を選択します。 -さまざまなOBユーザーインターフェイス。 -OBのさまざまなフィルター。 -OB近接アラート。 -ADRの高線と低線。 -通知サービス(画面アラート|プッシュ通知)。 概要 注文ブロックは、金融機関や銀行からの注文収集を示す市場行動です。著名な金融機関と中央銀行が外国為替市場を牽引しています。したがって、トレーダーは市場で何をしているのかを知る必要があります。市場が注文ブロックを構築するとき、それは投資決定のほとんどが行われる範囲のように動きます。 注文の構築が完了すると、市場は上向きと下向きの両方に向かって急激に動きます。注文ブロック取引戦略の重要な用語は、機関投資家が行っていることを含むことです。それらは主要な価格ドライバーであるため、機関投資家の取引を含むあらゆる戦
この製品は 2026 年の市場向けに更新され、最新の MT5 ビルドに最適化されています。 価格更新のお知らせ: Smart Price Action Concepts は現在 $200 で提供されています。 次の 30 件の購入 後、価格は $299 に上がります。 特別オファー: 購入後、私にプライベートメッセージを送ることで、 無料ボーナス + ギフト を受け取ることができます。 まず、このトレーディングツールはリペイントなし、再描画なし、遅延なしのインジケーターであり、プロフェッショナルな取引に最適であることを強調しておきます。 Online course , and manual Smart Price Action Concepts Indicator は、初心者から経験豊富なトレーダーまで使える非常に強力なツールです。20 種類以上の便利なインジケーターを 1 つにまとめ、Inner Circle Trader Analysis や Smart Money Concepts Trading Strategies などの高度な取引アイデアを組み合わせています。このインジケ
SEE THE TREND ON EVERY TIME FRAME. INTELLIGENT INDICATOR READS PRICE ACTION TO SPOT TRUE MARKET CYCLES AND TREND. This advanced multi-currency and multi-time frame indicator, reads trend in real-time so you always know the trends of the markets you want to trade.  ​Trend-Viewer Pro has been specifically designed to read the trend of every time frame and every market , simultaneously, making it much easier for you to find markets with time frame correlation , so you can focus on the best markets
作者のその他のプロダクト
False Breakout Stochastic to be used with our Elliott Wave Indicator as part of the overall strategy on trading the 5th wave. As we cannot upload multiple files, we have listed this separately. False Breakout Stochastic is best used as a confirmation tool rather than the sole signal indicator The Elliott Wave Indicator Suite is designed around a simple but effective Swing Trading Strategy. The Indicator Suite is great for Stocks, Futures and Forex trading on multiple timeframes You can find the
FREE
5/35 Oscillator to be used with our Elliott Wave Indicator as part of the overall strategy on trading the 5th wave. The Elliott Wave Indicator Suite is designed around a simple but effective Swing Trading Strategy. The Indicator Suite is great for Stocks, Futures and Forex trading on multiple timeframes You can find the main Elliott Wave Indicator here  https://www.mql5.com/en/market/product/44034
FREE
Elliott Wave Indicator Perfect for trading Stocks, Futures, Forex & Crypto The Elliott Wave Indicator Suite is designed around a simple but effective Swing Trading strategy. The Indicator Suite is great for Stocks, Futures and Forex trading on multiple time-frames. By subscribing to this indicator, you will get: Automatic Elliott Wave Count Elliott Wave Isolation High Probability Pull Back Zones Special 5-35 Oscillator 6/4 Moving Average High and Low's for trade entry and management Automate
Roller Coaster Perfect for trading Stocks, Futures, Commodities and Currencies The Roller Coaster is a Stochastic MACD Cross with Special EMA Points of Control for both Long and Short Trades. Our algorithm works everything out behind the scenes, keeping your chart clean. Read more about the inner workings here ==>  https://www.mql5.com/en/blogs/post/734074 With the lease of our indicator, you will have access to: Entry Price Stop Loss Price Trade Management using  Stochastic/MACD Cross Traili
With the purchase of the   Auto-Harmonic Pattern Recognition Trading Software for MT4 , you will have access to: The Auto Harmonic Pattern recognition software is designed to take the heavy lifting out of a traders Harmonic trading strategy. The Software automatically Identifies and Projects Harmonic Pattern Completion Zones for the 6 most trade-able Harmonic Patterns.  If the Pattern Completes in the projected zone, then there is a high probability of the resulting trade being successful. Pleas
フィルタ:
レビューなし
レビューに返信