• 概要
  • レビュー
  • コメント

Buy Sell Magic

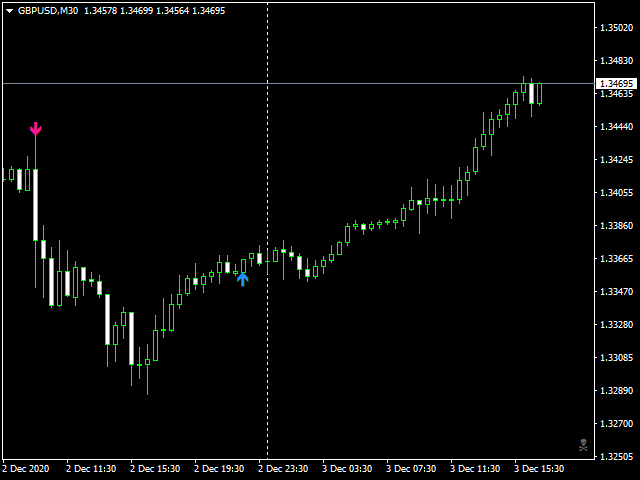
Trend reversal indicator, no repainting.
Clean and light rendering
There is no alternative buy-sell signal without taking into account the trend.
Noise filtering capability.
Works with all pairs.

Ideal for beginners and experienced traders
It is best used on timeframes above the M30, from the beginning of the London session to America.

It should be remembered that there are no indicators that are not wrong. Any strategy requires confirmation of its signals. When building your own system, it is recommended to use several indicators. Also, do not forget about Money management. You should never risk more than 2% of your capital on a single trade. Such an approach will protect the trader from ruin and allow him to earn stable income.
Good luck!
おすすめのプロダクト
This indicator compares the pips of the current day with the average of pips made in the previous three days. The "Percentage today range" is red if today's figure is less than the range of the previous three days, but turns green when the percentage exceeds 100%. When the range exceeds 100% there are good trading opportunities because we are in the presence of increased volatility of the past three days. Best use with Banks Day Levels indicator. Parameters settings corner (indicator display p
Gann Line indicator is usually used in combination with other Gann’s techniques, some say this is a key point in its success. The Gann line is interpreted as trend indicator, a series of higher highs and higher lows in it's trend are considered bullish, and a series of lower lows and lower highs are bearish. As with other technical indicators, for better results Gann Line should be used in combination with other technical concepts as Gann Fan, fibo, swings, supports and resistance, etc. When rev
This indicator may or may not be within your interest but I call it Cosmic Dream. When I backtested the indicator, colored level zones appear on your chart. It can work on any currency pair you want. There are 5 level zones. 5 are red and 5 are green. The purpose of this indicator is to let traders see the number of level zones. The interval of the zones is 50 at best. In terms of zone width, the number is 10. It can utilized for any direction. The colors will be visible as long as the indicator
This is a fully multitimeframe version of the ATR Channel standard indicator, which works for any combination of timeframes. The indicator allows viewing price channels from different timeframes in one window, and they will always be displayed in a correct time scale. You can create and set of intervals and freely switch to a higher or lower one. Please note: in the " From Median Price " display mode, it is easy to identify reversal points at intersections of levels from higher timeframes by lev
Spread Pulse   インジケーターは、トレーダーにチャート上の現在のスプレッドに関する情報を提供する効果的なツールです。 スプレッドとは、商品の購入価格と販売価格の差です。 インジケーターは、チャート上に表示されるテキストの形式で表示されます。 これにより、トレーダーは現在のスプレッドを簡単に追跡できます。 Spread Pulse インジケーターの主な利点の 1 つは、その色の視覚化です。 見開きサイズに応じて文字色が変わります。 デフォルトでは、スプレッドが小さい場合、テキストは緑色になります。これは、スプレッドが低く、取引がより収益性が高い可能性があることを意味します。 ただし、スプレッドが高くなると、インジケーターのテキストが自動的に赤に変わります。 さらに、ユーザーは高スプレッドと低スプレッドに関連する色をカスタマイズできます。 情報を読みやすくするためにフォント サイズを変更することもできます。 Spread Pulse インジケーターは、経験レベルや取引戦略に関係なく、あらゆるトレーダーにとって理想的です。 現在のスプレッドに関する情報に素早く
This is a correlation hedge type indicator which helps trade the obscure relationship between crude oil and natural gas markets. Which is overall an unknown trading concept to most traders, yet a very impressive one. The usual market risk is mittigated through the smooth trend of hedge tading, as well as the leading signals the indicator provides! Pros: low risk trading, normal profits, no need to be right about either market Cons:  requires large capital ----------------------------------
インジケータMTFクリスタリウム矢印は、半自動取引システムであります. これは、すべての通貨ペアで動作します。  インジケータは、三つのルールを使用しています:1)我々は唯一のトレンドで取引、2)"誰もが販売しているときに購入し、誰もが買うときに販売する"、3)価格  インジケータMTF矢印は、内蔵の指標を使用して、複数の時間枠全体のクリスタリウムフィルタルール。 トレンドは、選択した時間間隔で一致した場合、インジケータは、市場に参入するための矢印を与えます。 それからあなた自身の決定をする。 購入する-緑の矢印、売る-赤い矢印。 指標では、ロットを変更したり、EAの取引時間とシャットダウン時間を設定することができます。 また、作業期間と時間フィルタを変更することができます。 ビープ音が鳴ってる  推薦された働く期間D1。 フィルタH1とH4。  設定: TF働く期間(推薦されたD1) Cci_cperiodcomment CCIレベルアップ CCIレベルDn CCI価格 SARステップ SAR最大値 TFのFilter1–(推薦されたH1
Decent Trading Tools, The ones that separate the Winners from the Losers, do not have to be expensive. This is the second out of a series of two indicators from the magic series. This indicator is Magic Correlation , this is the Middle Indicator in the screenshot. The indicator plots up to 30 instruments and visualizes events like: Time, Start, End and Duration of the events. Underlying Correlation. Trend Strength. Front Runners and Laggards. Directions. Patterns. What normally remains hidden be
Black series MT4 - The indicator is designed for trading on binary options with Timeframe M1-M5-M15 Multicurrency (Works on cryptocurrency and currency pairs) The signal appears when the candle opens Up to 90% correct signals There is no signal redrawing at all Can be used with other indicators. Good for scalping! In Settings there is: -Indicator working methods -I Allert Arrow color Red signal down Blue signal up Also watch the video how the indicator works and signals
Candles length indicator is, as the name suggests, an indicator that displays the body size of each candle. The nominal size is placed below each bearish candle and below each bullish candle. How to install the Candles length Indicator on your Metatrader 4 trading plaftform? Download the indicator Copy and paste the Candle Body Size Indicator files into following folder of your Metatrader 4 (MT4) platform: MQL4 > Indicators. You can gain access to the folders this way: File > Open Data Folder
Gold Buster M1 System - XAUUSDペアのM1チャートのプロの取引システムです。しかし、このシステムはもともと金の取引専用に開発されたという事実にもかかわらず、このシステムは他のいくつかの通貨ペアでも使用できます。購入後、XAUUSDに加えてシステムで使用できるトレーディングペアのリストを提供します。これにより、このシステムを使用する可能性が広がります。 システム内のすべてのインジケーターは繰り返されません! このシステムは、3つのインジケーターのセットです。市場の強さを視覚的に表示するトレンドインジケーター、矢印インジケーター、ボリュームインジケーターです。購入後、すぐにトレンドインジケーターをダウンロードできます。残りの2つのインジケーターはシステム全体の一部であるため、無料で提供します。また、チャートにインジケーターをロードするために使用できるテンプレートを提供します。さらに、私のシステムとの取引方法を教え、私の推奨事項を共有します。あなたを待っている素晴らしいボーナスもあります! 購入後すぐにご連絡ください!
Fibonacci retracement is one of the most reliable and used technical analysis tools for trading. It uses the so called “golden ratio” to predict certain levels of support (price movement reverses from downward to upward) and resistance (price movement reverses from upward to downward) which is a mathematical pattern seen through out nature and even the universe. Because so many traders make use of this trading strategy and watch these price levels, more often than not the Fibonacci levels become
Nas100 killer V2 (See video of how we test the indicator live) 1000% non-repaint indicator appears on current candlestick. Timeframes: M5, M15, M30, H1, H4. Works on pairs such as (NAS100, US30, SPX500, and Gold) The indicator is strictly for scalping do not hold trades for too long. Orange arrows look for selling opportunities. Light Blue arrows look for buying opportunities. 
This is a trend indicator without redrawing Developed instead of the binary options strategy (by the color of the Martingale candlestick) Also works well in forex trading When to open trades (binary options) A signal will appear in the place with a candle signaling the current candle It is recommended to open a deal for one candle of the current timeframe M1 and M5 When a blue dot appears, open a deal up When a red dot appears, open a trade down. How to open trades on Forex. When a signal is rec
The most effective signals generated by Ichimoku strategies. Ichimoku Trade Alarm is a supplement for Ichimoku Trade Panel and it shows the signals that Expert Advisor reacts to. Visualization of signals:  Price / Kijun sen cross - the candle body must be between Min_Candlestick_Body and Max_Candlestick_Body. The candle must close above / below Kijun sen, minimum in 1/3 of its body. Open candle must be located above / below Kijun sen. Chinkou span must be under the price of 26 periods in advan
Gold Venamax   - これは最高の株式テクニカル指標です。 指標アルゴリズムは資産の価格変動を分析し、ボラティリティと潜在的なエントリーゾーンを反映します。 インジケーターの機能: これは、快適で収益性の高い取引のためのマジックとトレンド矢印の 2 つのブロックを備えたスーパー インジケーターです。 チャート上にブロックを切り替えるための赤いボタンが表示されます。 マジックはインジケーター設定で設定されているため、異なるブロックを表示する 2 つのチャートにインジケーターをインストールできます。 Gold Venamax は、異なる矢印バッファー (GV と SF) を備えた 2 つのチャートに配置できます。 これを行うには、設定で異なる Magic を選択する必要があります。たとえば、あるマジック = 999、別のマジック = 666 を選択します。次に、チャート上の赤いボタンで矢印バッファを選択できます。 入力するのに最適な信号 = 両方のバッファ (GV および SF) の信号矢印 + 3 本すべての MA ライン (赤または青) の方向に従います。
The indicator creates 2 dot lines representing an upper and lower bands and the main indicator aqua line as the price power. If the main line is swimming inside the bands, then you should wait and watch before entering the market. When the main line jumps out or in the bands, then you should make a long or a short position.
Renegade The indicator generates arrows (red and blue by default). The indicator is installed in the usual way on any trading symbol with any time interval. It is an auxiliary tool that is used for technical analysis of the price movement chart in the Forex market. Novice traders have difficulties both with finding an indicator and with its application. Their reason is the lack of technical awareness of ordinary users and the lack of basic knowledge about good trading programs. In Forex trans
GoldTrend MT4 - is  a leading indicator for Gold on MetaTrader 4 - In Update version has been added new ability on USD pairs     ( AUDUSD, EURUSD, GBPUSD, NZDUSD, USDCAD, USDCHF, USDJPY ) - very easy to use , even for beginners - Stoploss and Take Profit provided - no repaint, no redraw and no lagging  When you decide to enter the global market ,  then there is a technical skill you absolutely must have, - which is all about trends . Why - GoldTrend is different from others : Not onl
Based on Trend Following Strategy, QCAFE SUITE was built to get more accurate signal for Traders to decide whether to enter trades, included in the SUITE is QCAFE+ filter to eliminate false signals.  The Signals are generated based on formula of Hull Moving Average ( HMA ) to minimize the lag of a traditional moving average - developed by Alan Hull in 2005 Setting: Limited Bars of back test Fast Period Low Period  Fast/Low period to generate Buy/Sell signal Based MA Period B ased Moving Averag
PABT Pattern Indicator - it's classical system one of the signal patterns. Indicator logic - the Hi & Lo of the bar is fully within the range of the preceding bar, look to trade them as pullback in trend. In the way if indicator found PABT pattern it's drawing two lines and arrow what showing trend way.  - First line - it's entry point and drawing at: 1. On the high of signal bar or on middle of the signal bar (depending from indicator mode) for buy; 2. On the low of signal bar or on middle of t
Avatar01
Ahmed Essam Ahmed Mohammed Mousa
The avatar indicator is one of the most powerful current indicators in the forex and binary options market. The indicator works on all pairs and all time frames, and the indicator has certain conditions in order to avoid loss and achieve 95% profits from it. The conditions are: Avoid volatility markets Avoid flat and casual markets I work in the trend markets, the market is moving in a trend, and you are able to determine the direction of the trend, where is it Make time for yourself to work in,
Flag Pattern Indicator - Your Guide to Flagging Profitable Trade Setups Welcome to the world of precision trading with the "Flag Pattern Indicator." Designed for MetaTrader, this powerful tool is your go-to solution for identifying one of the most reliable and versatile chart patterns in technical analysis: the flag pattern. Whether you're a seasoned trader or just starting, this indicator simplifies the process of spotting flag patterns, giving you an edge in your trading decisions. Key Feature
This indicator displays the signals of a highly effective oscillator -  Laguerre Osc 2 AM   - on the price chart. The presented indicator uses the Laguerre filter to build an oscillator. The indicator has the possibility of double additional smoothing, which can be useful for small values ​​of the Gamma parameter. The indicator gives three types of signals: Exit of the oscillator from the overbought / oversold zone; The oscillator crossing the middle of the value between the overbought/oversold
FREE
This is a real time , non-repainting , currency strength indicator with 'every'   tick-level accuracy .   Why wait 5 minutes, 30 minutes, or an hour to see which currency is the strongest or weakest when you can witness the currency appetite of market participants in real time.   The Real Currency Strength Indicator (CSI) uses the most precise method in calculating a currency’s performance, tailored to your specific trading style .   View all eight major currencies (EUR, GBP, AUD, NZD, USD, CAD,
Turtle fast movement
Abdallah Moustafa Hamdy Ahm Abdelrazek
This trend following system was designed by   Dennis Gartman   and   Bill Eckhart , and relies on breakouts of historical highs and lows to take and close trades: it is the complete opposite to the "buy low and sell high" approach. This trend following system was taught to a group of average and normal individuals, and almost everyone turned into a profitable trader. The main rule is   "Trade an N-day breakout and take profits when an M-day high or low is breached (N must me above M)" . Exampl
VR Cub
Vladimir Pastushak
VR Cub は、質の高いエントリーポイントを獲得するためのインジケーターです。このインジケーターは、数学的計算を容易にし、ポジションへのエントリーポイントの検索を簡素化するために開発されました。このインジケーターが作成されたトレーディング戦略は、長年にわたってその有効性が証明されてきました。取引戦略のシンプルさはその大きな利点であり、初心者のトレーダーでもうまく取引することができます。 VR Cub はポジション開始ポイントとテイクプロフィットとストップロスのターゲットレベルを計算し、効率と使いやすさを大幅に向上させます。取引の簡単なルールを理解するには、以下の戦略を使用した取引のスクリーンショットを見てください。 設定、設定ファイル、デモ版、説明書、問題解決方法は、以下から入手できます。 [ブログ] レビューを読んだり書いたりすることができます。 [リンク] のバージョン [MetaTrader 5] エントリーポイントの計算ルール ポジションをオープンする エントリーポイントを計算するには、VR Cub ツールを最後の高値から最後の安値までストレッチする必要があります。
ProZZcom
Uladzimir Izerski
4 (2)
Control over the indicator is performed by changing only one parameter directly on the chart. Innovative and precise algorithm for plotting the ZigZag peaks. The "ProZZcom" indicator plots a graphical layout, which allows to quickly find the points for accurate entries and for placing short stop orders. It also predicts a possible flat in the early stages, shows the trend direction and correction in the wave, draws the round levels, draws the Fibonacci level lines. The indicator works on any ins
The indicator detects divergence signals - the divergences between the price peaks and the MACD oscillator values. The signals are displayed as arrows in the additional window and are maintained by the messages in a pop-up window, e-mails and push-notifications. The conditions which formed the signal are displayed by lines on the chart and in the indicator window. Indicator Parameters MacdFast - fast MACD line period MacdSlow - slow MACD line period MacdSignal - MACD signal line period MacdPri
The Two Moving Averages indicator concurrently displays two Moving Averages with default settings in the main chart window: Green and Red lines that represent a short-term trend. You can change the moving average settings and colors. However, these parameters have been configured so that to allow trading on all timeframes. Take a look at how the Moving Averages lines can be used in a profitable multi-currency Trading Strategy on all time frames, that is also suitable for trading in your mobile t
このプロダクトを購入した人は以下も購入しています
Gann Made Easy は、ミスター・ギャンの理論を使用した取引の最良の原則に基づいた、プロフェッショナルで使いやすい外国為替取引システムです。 W・D・ガン。このインジケーターは、ストップロスとテイクプロフィットレベルを含む正確な買いと売りのシグナルを提供します。 PUSH通知を利用して外出先でも取引可能です。 購入後はご連絡ください!私の取引のヒントと素晴らしいボーナスインジケーターを無料で共有します! おそらく、ギャンの取引手法についてはすでに何度も聞いたことがあるでしょう。通常、ギャンの理論は初心者のトレーダーだけでなく、すでにある程度の取引経験がある人にとっても非常に複雑なものです。なぜなら、ギャンの取引手法は理論的にはそれほど簡単に適用できるものではないからです。私はその知識を磨き、最良の原則を私の外国為替インジケーターに組み込むために数年を費やしました。 このインジケーターは非常に簡単に適用できます。必要なのは、それをチャートに添付し、簡単な取引推奨事項に従うだけです。このインジケーターは常に市場分析の仕事を行い、取引の機会を探します。適切なエントリーポイントを検出
まず第一に、この取引インジケーターは再描画されず、再描画されず、遅延しないことを強調する価値があります。これにより、手動取引とロボット取引の両方に理想的なものになります。 アトミックアナリストは、価格の強さとモメンタムを利用して市場でより良いエッジを見つけるためのPA価格アクションインジケーターです。ノイズや誤ったシグナルを除去し、取引ポテンシャルを高めるための高度なフィルターを備えています。複雑なインジケーターの複数のレイヤーを使用して、アトミックアナリストはチャートをスキャンし、複雑な数学的計算をシンプルなシグナルと色に変換します。これにより、どのような初心者トレーダーでも理解して使用し、一貫した取引の決定を行うことができます。 「アトミックアナリスト」は、新規および経験豊富なトレーダー向けにカスタマイズされた包括的な取引ソリューションです。プレミアムインジケーターとトップノッチの機能を1つの取引戦略に組み合わせ、すべてのタイプのトレーダーにとって汎用性のある選択肢にします。 デイリートレーディングとスキャルピング戦略:高速で正確なデイトレーディングおよび短期トレード
現在26%オフ 初心者やエキスパートトレーダーに最適なソリューション! このインジケーターは、独自の機能と新しい計算式を取り入れた、ユニークで高品質、かつ手頃な価格のトレーディングツールです。たった1枚のチャートで28の為替ペアの通貨強度を読み取ることができます。新しいトレンドやスキャルピングチャンスの引き金となるポイントを正確に特定することができるので、あなたのトレードがどのように改善されるか想像してみてください。 ユーザーマニュアルはこちら  https://www.mql5.com/en/blogs/post/697384 これが最初の1本、オリジナルだ! 価値のないクローンを買わないでください。 特別な サブウィンドウの矢印で強い通貨の勢いを表示 GAPがあなたのトレードを導く! 基準通貨や気配値が売られすぎ・買われすぎのゾーン(外相フィボナッチレベル)にあるとき、個別チャートのメインウィンドウに警告表示。 通貨がレンジの外側から反落した場合、プルバック/リバーサルのアラート。 クロスパターンの特別なアラート 複数の時間枠を選択可能で、トレンドを素早く
まず第一に、この取引ツールはノンリペイント、ノンリドロー、ノンラグの指標であり、プロの取引に理想的ですことを強調する価値があります。 スマートプライスアクションコンセプトインジケーターは、新米から経験豊富なトレーダーまで、非常 に強力なツールです。Inner Circle Trader AnalysisやSmart Money Concepts Trading Strategiesなど、20以上の有用な指標を1つに組み合わせています。このインジケーターはスマートマネーコンセプトに焦点を当て、大手機関の取引方法を提供し、彼らの動きを予測するのに役立ちます。 特に、流動性分析に優れており、機関がどのように取引しているかを理解しやすくしています。市場のトレンドを予測し、価格の動きを慎重に分析するのに優れています。機関の戦略とトレードを合わせることで、市場の動向についてより正確な予測ができます。このインジケーターは多目的であり、市場構造を分析し、重要な注文ブロックを特定し、さまざまなパターンを認識するのに優れています。 このインジケーターはBOSやCHoCHなどのパターンの識
Scalper Vault は、スキャルピングを成功させるために必要なすべてを提供するプロフェッショナルなスキャルピング システムです。このインジケーターは、外国為替およびバイナリー オプションのトレーダーが使用できる完全な取引システムです。推奨される時間枠は M5 です。 システムは、トレンドの方向に正確な矢印シグナルを提供します。また、トップとボトムのシグナルとギャン マーケット レベルも提供します。 インジケーターは、プッシュ通知を含むすべてのタイプのアラートを提供します。 インジケータの購入後にご連絡ください。私の個人的な取引の推奨事項と素晴らしいボーナス指標を無料で共有します! 幸せで有益な取引をお祈りします!
TPSpro TRENDPRO  - is a trend indicator that automatically analyzes the market and provides information about the trend and each of its changes, as well as giving signals for entering trades without redrawing! The indicator uses each candle, analyzing them separately. referring to different impulses - up or down impulse. Exact entry points into transactions for currencies, crypto, metals, stocks, indices!  -  Version MT5               DETAILED DESCRIPTION        /       TRADING SETUPS           
Trend Screener
STE S.S.COMPANY
4.83 (86)
トレンドインジケーター、1つのツールに組み込まれたすべての重要なトレンド機能を備えたトレンドトレーディングとフィルタリングのための画期的なユニークなソリューション! これは、すべてのシンボル/商品(外国為替、商品、暗号通貨、インデックス、株式)で使用できる100%再描画されていないマルチタイムフレームおよびマルチ通貨インジケーターです。 トレンドスクリーナーは、チャート内のドットで矢印トレンドシグナルを提供するインジケーターに続く効率的なインジケーターです。 トレンド分析インジケーターで使用できる機能: 1.トレンドスキャナー。 2.最大利益分析を備えたトレンドライン。 3.トレンド通貨強度メーター。 4.アラート付きのトレンド反転ドット。 5.アラート付きの強いトレンドドット。 6.トレンド矢印 毎日の分析例、毎日のシグナルパフォーマンス...など、トレンドスクリーナーインジケーターを使用して、ここで見つけることができます: ここをクリックしてください 期間限定オファー:トレンドスクリーナーインジケーターは、50ドルと生涯でのみご利用いただけます。 (元の価格125 $) MQ
現在20%OFF! 初心者やエキスパートトレーダーのためのベストソリューション! このダッシュボードソフトウェアは、28の通貨ペアで動作しています。それは私達の主要な指標(高度な通貨の強さ28と高度な通貨インパルス)の2に基づいています。それは全体の外国為替市場の大きい概観を与えます。それは、すべての(9)時間枠で28の外国為替ペアのための高度な通貨の強さの値、通貨の動きの速度と信号を示しています。チャート上で1つのインディケータを使用して市場全体を観察し、トレンドやスキャルピングの機会をピンポイントで見つけることができたら、あなたのトレードがどのように改善されるか想像してみてください。 このインディケータには、強い通貨と弱い通貨の識別、潜在的な取引の識別と確認がより簡単になるような機能が搭載されています。このインディケータは、通貨の強さや弱さが増加しているか減少しているか、また、すべての時間枠でどのように機能しているかをグラフィカルに表示します。 新機能として、現在の市場環境の変化に適応するダイナミックなマーケットフィボナッチレベルが追加され、すでに当社のAdvan
SALE NOW! Limited Time Offer! An exclusive indicator that utilizes an innovative algorithm to swiftly and accurately determine the market trend. The indicator automatically calculates opening, closing, and profit levels, providing detailed trading statistics. With these features, you can choose the most appropriate trading instrument for the current market conditions. Additionally, you can easily integrate your own arrow indicators into Scalper Inside Pro to quickly evaluate their statistics and
ブレーカートレーダーになり、価格が反転すると市場構造からの利益が変化します。 注文ブロックブレーカーインジケーターは、トレンドまたは価格の動きが枯渇に近づいており、逆転の準備ができていることを識別します。通常、反転または大規模なプルバックが発生しようとしているときに発生する市場構造の変化について警告します。 この指標は、ブレイクアウトと価格の勢いを識別する独自の計算を使用します。使い果たされる可能性のあるポイントの近くで新しい高値が形成されるたびに、インディケーターはその高値の作成を担当する最後の注文ブロックを描きます。次に、移動する価格とともに注文ブロックを追跡します。その後、価格が反対方向にシフトし、その注文ブロックを突破すると、新しい市場構造を作成し、トレンドまたは大きな後退の可能性のある反転の開始を警告します。 注文ブロックは、高値/安値が作成される前の最後の反対色のろうそくであり、価格がこれらの重要な領域を下抜けすると、トレンドの短期的ま​​たは長期的な反転の兆候です。 特徴 重要な枯渇点での市場構造の変化を警告します 価格が使い果たされるレベルに近づくと、
A key element in trading is zones or levels from which decisions to buy or sell a trading instrument are made. Despite attempts by major players to conceal their presence in the market, they inevitably leave traces. Our task was to learn how to identify these traces and interpret them correctly. Reversal First Impulse levels (RFI)   -  Version MT5                INSTRUCTIONS                 RUS                 ENG                                       R ecommended to use with an indicator   -  
ご紹介   クォンタム トレンド スナイパー インジケーターは 、トレンド反転を特定して取引する方法を変革する画期的な MQL5 インジケーターです。 13年以上の取引経験を持つ経験豊富なトレーダーのチームによって開発されました。     クォンタムトレンドスナイパーインジケーター   は、非常に高い精度でトレンドの反転を識別する革新的な方法で、あなたのトレーディングの旅を新たな高みに押し上げるように設計されています。 ***Quantum Trend Sniper Indicatorを購入すると、Quantum Breakout Indicatorを無料で入手できます!*** クォンタム ブレイクアウト インジケーターは、トレンドの反転を特定するとアラートを発し、矢印を示し、3 つのテイクプロフィットレベルを提案します。 初心者トレーダーにもプロのトレーダーにも適しています。 量子EAチャネル:       ここをクリック MT5のバージョン:       ここをクリック 推奨事項: 期間: すべての時間枠。最良の結果を得るには、
ご紹介     Quantum Breakout PRO は 、ブレイクアウト ゾーンの取引方法を変革する画期的な MQL5 インジケーターです。 13年以上の取引経験を持つ経験豊富なトレーダーのチームによって開発された Quantum Breakout PROは 、革新的でダイナミックなブレイクアウトゾーン戦略により、あなたの取引の旅を新たな高みに押し上げるように設計されています。 クォンタム ブレイクアウト インジケーターは、5 つの利益ターゲット ゾーンを備えたブレイクアウト ゾーン上のシグナル矢印と、ブレイクアウト ボックスに基づいたストップロスの提案を提供します。 初心者トレーダーにもプロのトレーダーにも適しています。 量子EAチャネル:       ここをクリック MT5バージョン:   ここをクリック 重要!購入後、インストールマニュアルを受け取るためにプライベートメッセージを送ってください。 推奨事項: 時間枠: M15 通貨ペア: GBPJPY、EURJPY、USDJPY、NZDUSD、XAUUSD アカウントの種類: ECN、Raw、また
Advanced Supply Demand
Bernhard Schweigert
4.92 (310)
現在33%オフ 初心者にもエキスパートトレーダーにも最適なソリューション このインジケーターは独自の機能と新しい公式を多数内蔵しており、ユニークで高品質かつ手頃な取引ツールです。このアップデートでは、2つの時間枠ゾーンを表示できるようになります。より長いTFだけでなく、チャートTFとより長いTF(ネストゾーンを表示)の両方を表示できます。すべてのSupply Demandトレーダーの皆さんのお気に召すはずです。:) 重要情報の公開 Advanced Supply Demandの可能性を最大化するには、 https://www.mql5.com/ja/blogs/post/720245 にアクセスしてください。   エントリーまたはターゲットの正確なトリガーポイントを正確に特定できれば取引がどのように改善されるか想像してみてください。新しい基盤となるアルゴリズムに基づいて構築されているため、買い手と売り手の間の潜在的な不均衡をさらに簡単に特定できます。これは、最も強い需要と供給のゾーンと、過去のパフォーマンス(古いゾーンを表示)がグラフィカルに表現されるためです。これらの機能は、最適
カスタムMT4インジケーターで外国為替取引を成功させるための秘密を発見してください! 外国為替市場で成功を達成し、リスクを最小限に抑えながら一貫して利益を得る方法を疑問に思ったことはありますか? これがあなたが探している答えです! 取引へのアプローチに革命をもたらす独自のMT4インジケーターを導入できるようにします。 ユニークな汎用性 私たちのインジケータは、RenkoとRangeBarのろうそくのフォーメーションを好むユーザー向けに特別に設計されています。 これらのチャートタイプは多くの経験豊富なトレーダーに好まれていることを理解しています。そのため、私たちのインジケーターはそれらとシームレスに統合され、比類のない市場分析を提供します。 クリアトレンドシグナル 複雑な分析を忘れてください! 私たちのインジケーターは、鮮やかな色と明確なドット構造を利用して、市場の動向を明確に示しています。 赤と青の点は、価格の動きの方向性について疑いの余地がなく、取引の迅速な意思決定を可能にします。 HH/HL HL/LL戦略とのアライメント HH/HLおよびHL/LL構
驚異的なFXインジケーター「Miraculous」をご紹介します。完璧な結果を得るための1時間足を含むすべてのタイムフレームで効果的に機能する、最強の強力な特殊MT4フォレックスインジケーターです。 すべてのタイムフレームで優れた結果を提供する最高のFXインジケーターを探し続けるのに疲れましたか?これ以上探す必要はありません!「Miraculous」フォレックスインジケーターをご紹介します。このインジケーターは、トレーディングの経験を変革し、収益を新たなレベルに引き上げるために設計されました。 先進のテクノロジーと長年にわたる緻密な開発に基づいて構築された「Miraculous」フォレックスインジケーターは、FX市場における力と正確さの頂点となります。この素晴らしいツールは、すべてのレベルのトレーダーのニーズを満たすように設計されており、一貫した収益性を追求する上で比類のない優位性を提供します。 「Miraculous」フォレックスインジケーターの他との違いは、その非常に適応性にあります。デイトレーダー、スウィングトレーダーであろうと、長期ポジションを好む方であろうと、このインジケータ
Break & Retest is unstoppable when combined with our other divergence indicator. After purchase, send us a message and you could get this  2nd indicator  for  FREE  as a  BONUS! ‍You can visually backtest Break & Retest to see how it behaved in the past!    Manual guide:   Click here $59  for the first 25 copies ( 4  left)! Next price is $120 .  After many months of hard work and dedication, we are extremely proud to present you our  Break and Retest price action indicator crea
これはMT4のインジケーターで、再描画なしで取引に参入するための正確なシグナルを提供します。 外国為替、暗号通貨、金属、株式、インデックスなど、あらゆる金融資産に適用できます。かなり正確な見積もりを提供し、取引を開始して終了するのに最適な時期を教えてくれます。1つのシグナルを処理しただけでインジケーターの元が取れた例の 動画 (6:22)をご覧ください。Entry PointsPro インジケーターの助けを借りたほとんどのトレーダーの最初の1週間の結果が改善しています。 Telegramグループ に登録してください。Entry Points Proインジケーターのメリットは次の通りです。 再描画のないエントリーシグナル 再描画されるインジケーターでは一度表示されたシグナルが削除されて大きな金銭的損失につながることがありますが、これと異なり、表示されて確認されたシグナルは消えることがありません。 エラーなしの取引開始 インジケーターアルゴリズムによって取引を開始する(資産を売買する)理想的な瞬間を見つけることができます。それを使用するすべてのトレーダーの成功率が向上します。
通貨強さウィザードは、取引を成功させるためのオールインワン ソリューションを提供する非常に強力な指標です。このインジケーターは、複数の時間枠のすべての通貨のデータを使用して、このまたはその外国為替ペアのパワーを計算します。このデータは、使いやすい通貨インデックスと通貨パワーラインの形式で表され、特定の通貨のパワーを確認するために使用できます。 必要なのは、取引したいチャートにインジケーターを接続することだけです。インジケーターは、取引する通貨の実際の強さを示します。このインジケーターは、トレンドに合わせて取引するときに有利に利用できる売買高の圧力の極値も示します。このインジケーターには、フィボナッチに基づく可能なターゲットも表示されます。 このインジケーターは、PUSH 通知を含むあらゆるタイプのアラートを提供します。 購入後ご連絡下さい。私の取引のヒントをあなたと共有し、素晴らしいボーナスインジケーターを無料で提供します! 幸せで有益な取引をお祈りします。
TrendMaestro
Stefano Frisetti
5 (2)
note: this indicator is for METATRADER4, if you want the version for METATRADER5 this is the link: TRENDMAESTRO recognizes a new TREND in the bud, he never makes mistakes. The certainty of identifying a new TREND is priceless. DESCRIPTION TRENDMAESTRO identifies a new TREND in the bud, this indicator examines the volatility, volumes and momentum to identify the moment in which there is an explosion of one or more of these data and therefore the moment in which prices have strong probability of f
TrendDecoder Premium
Christophe, Pa Trouillas
5 (3)
レンジと次の動きを特定    |  トレンドの最も早いシグナルと強さを得る   |  反転の前に明確な出口を得る   |  価格がテストするフィボ・レベルを見つける。 非リペイント、非遅延インディケータ - マニュアルおよび自動売買に最適 - すべての資産、すべての時間単位に対応 期間限定キャンペーン   >> 50%OFF 購入後、 推奨セッティングについては、このチャンネルで私に連絡してください。 MT5 バージョン: ここをクリック BladeSCALPER   と   PowerZONES   を使った完全な方法を入手する どのようなものですか? TrendDECODERは、トレンド監視をシンプルかつ簡単にするための複数のイノベーションを集約したものです。 Projective TrendLine (投影トレンドライン) - 今後のトレンドのスピードリファレンス。 RealTime TrendLine vs. Projective TrendLine (リアルタイムトレンドライン vs. Projective TrendLine) - 市場が同じ方
複数通貨と複数フレームの売買に関するアラート。 自動トレーリングストップとリスク報酬で利益を獲得! インジケーターが市場をスキャンして分析するため、何もする必要はありません。 1 つのチャートですべての通貨を取引しましょう!   購入後、コメントを残して私に連絡してください。トレードアシスタントEAをお送りします。 このインジケーターはいくつかのオシレーターと付属のフィルターを使用して、最良の確認されたエントリーポイントを見つけますので、それについて心配する必要はありません。 警告が表示され、監視することを選択したすべての時間枠と通貨のボタンが描画されます。 ボタンを押すだけでチャートに移動し、取引を開始できます。 このインジケーターは、すべての基本通貨と市場監視通貨の強さパネルも描画します (設定で調整可能)。これにより、すべてのペアの通貨と選択されたより高い時間枠が表示されます。 インジケーターウィンドウ: チャート通貨のトレンドフィルターとマルチタイムフレームトレンドパネルを備えた特別なMACDヒストグラム! すべての通貨と時間枠の取引アラートを提供し、
mql5と Telegramの モーニング・ブリーフィングで、詳細とスクリーンショットを含む毎日のマーケット・アップデートをご覧 ください! FX Power MT4 NGは 、長年の人気を誇る通貨強度計FX Powerの次世代モデルです。 この次世代ストレングスメーターは何を提供するのでしょうか?初代FXパワーの魅力すべて プラス GOLD/XAUの強さ分析 より正確な計算結果 個別に設定可能な分析期間 カスタマイズ可能な計算上限値により、さらに優れたパフォーマンスを実現 もっと見たい人のための特別なマルチインスタンス設定 すべてのチャートでお好みの色を無限に設定可能 数え切れないほどの通知オプションにより、重要なことを見逃すことはありません。 Windows 11とmacOSのスタイルで角を丸くした新しいデザイン 魔法のように動くインジケーターパネル FXパワーの主な機能 すべての主要通貨の強さの完全な履歴 すべての時間枠における通貨の強さの履歴 すべてのブローカーとチャートで同一の計算結果 100%信頼できるリアルタイム計算 -> リペイントなし ドロップダウン・リストから
This indicator is unstoppable when combined with our other indicator called Katana. After purchase, send us a message and you could get Katana for FREE as a BONUS After purchase, send us a private message for your instructions.  MT5 version: click here 3 copies left available at $45. Next price is $99. Don't miss this great deal!  The Trend Forecasting indicator is a very unique & easy tool that is able to make prediction about future price movement based on the signals generated
Price Action Entry Alerts
Stephen Sanjeeve Sahayam
5 (3)
このインジケーターは、売買圧力についてすべてのバーをスクリーニングし、最大量の 4 種類のローソク足パターンを特定します。次に、これらのローソク足はいくつかの線形フィルターを使用してフィルター処理され、買いまたは売りのシグナルが表示されます。シグナルは、より高い時間枠の方向と組み合わせて、取引量が多い時間帯に取引される場合に最も効果的に機能します。すべてのフィルターはカスタマイズ可能で、独立して動作します。ボタンをクリックするだけで単一方向の信号を表示できます。 このインジケーターには、意思決定プロセスに役立つ最も重要な価格アクションとスマート マネーの概念も組み込まれています。 シグナルとトレードに関する教育をすべて 1 つのツールにまとめました。 特徴: 信号は再描画されません。 飲み込むキャンドル、拒否キャンドル、拡張範囲キャンドル、ピンバーを識別します。 有効なシグナルごとに複数のエントリー、ストップロス、複数のテイクプロフィットレベルを表示します。 大容量セッションでフィルタリングします。 サポート/レジスタンスレベルとローソク足の構造でフィルターします。 MACD ヒ
現在31%オフ! 初心者やエキスパートトレーダーに最適なソリューション! このインジケータは、独自の機能と秘密の数式を組み込んだ、ユニークで高品質かつ手頃な価格のトレーディングツールです。たった1枚のチャートで28の通貨ペアのアラートを表示します。新しいトレンドやスキャルピングチャンスの引き金となるポイントを正確に把握することができるので、あなたのトレードがどのように改善されるか想像してみてください! 新しい基本的なアルゴリズムに基づいて構築されているため、潜在的な取引の特定と確認がより簡単になります。これは、通貨の強さや弱さが加速しているかどうかをグラフィカルに表示し、その加速のスピードを測定するためです。加速すると物事は明らかに速く進みますが、これはFX市場でも同じです。つまり、反対方向に加速している通貨をペアにすれば、利益を生む可能性のある取引を特定することができるのです。 通貨の勢いを示す縦の線と矢印は、あなたの取引の指針となるでしょう。 ダイナミックマーケットフィボナッチ23レベルはアラートトリガーとして使用され、市場の動きに適応します。もしインパルスが黄色
FX Volume
Daniel Stein
4.6 (35)
mql5と Telegramの モーニング・ブリーフィングで、詳細とスクリーンショットを含む毎日のマーケット・アップデートをご覧 ください! FX Volumeは、ブローカーの視点から市場のセンチメントをリアルに洞察する、最初で唯一の出来高インジケーターです。 ブローカーのような機関投資家が外国為替市場でどのようなポジションをとっているか、COTレポートよりもはるかに速く、素晴らしい洞察を提供します。 この情報をチャート上で直接見ることは、あなたの取引にとって真のゲームチェンジャーであり、画期的なソリューションです。 以下のようなユニークなマーケットデータ洞察から利益を得てください。 比率は 、通貨のロングポジションとショートポジションの比率をパーセントで表示します。 比率の変化は 、選択した期間内のロング比率とその変化率を表示します。 Volumes Totalは 、通貨の取引量(ロングとショート)の合計をロット単位で表示します。 Volumes Long :全通貨のロングポジションの取引量を表示します。 Volumes(ショート )は、全通貨のショートポジションの取引量を表示
Thise indicator is up down v6  comes with tradingwiev version. purchased people, after installed on terminal ,contact me on mql5  to get BONUS  TradingView version. up-down indicator is no repaint and works all pairs and lower than weekly time frames charts. it is suitable also 1 m charts for all pairs. and hold long way to signal. dont gives too many signals. when red histogram cross trigger line that is up signal.and price probably will down when blue histogram cross trigger line that is dow
支持線と抵抗線、そしてローソク足のギャップをチャート上に自動的に表示するため、価格が次に向かう可能性のある場所や反転する可能性のある場所を確認することができます。 このインジケーターは、私のウェブサイト(The Market Structure Trader)で教えているポジショントレード手法の一部として使用するように設計されており、ターゲットとエントリーの可能性のための重要な情報を表示します。 このインジケーターには、2つのコア機能と4つの追加機能があります: コア機能1 - 日足、週足、月足のサポートラインとレジスタンスラインの自動表示 このインジケーターは、直近2日間、最大6週間前、数ヶ月前のサポートレベルとレジスタンスレベルを自動的に引き込みます。これらのレベルの見た目は完全にカスタマイズすることができ、いくつ表示されるかを表示することもできます。これらの重要な水準は、しばしば主要な支持線と抵抗線として機能し、価格が転換して引き戻されたり反転したりする場所です。また、価格が向かうターゲットでもあるため、価格が転換する前に、取引に利用できる潜在的な距離を素早く確認するこ
How to use Pair Trading Station Pair Trading Station is recommended for H1 time frame and you can use it for any currency pairs. To generate buy and sell signal, follow few steps below to apply Pair Trading Station to your MetaTrader terminal. When you load Pair Trading Station on your chart, Pair Trading station will assess available historical data in your MetaTrader platforms for each currency pair. On your chart, the amount of historical data available will be displayed for each currency pai
作者のその他のプロダクト
The technical indicator is a more advanced version of the relative strength index (RSI) that applies moving average convergence-divergence (MACD) principles to a double-smoothed RSI (DS RSI) indicator. The indicator is derived by computing the difference between a double-smoothed RSI and a simple moving average (SMA) of the DS RSI. The indicator's intent is to provide more accurate buy and sell signals than the standard RSI calculation.  The MACD is derived by subtracting the 12-period expone
FREE
Alert TIME LINE indicator warns that the price has reached a specified time level. Drag the indicator onto the chart, press the SET TIME LINE button, move the line that appears to the desired time, when the chart reaches the specified time, an alert will be triggered. This indicator is used as an auxiliary tool when trading time zones, using the free TIME LINE Forex System , see the results and screenshots below. You can get the system for free in the technical support chat https://t.me/C
FREE
Forex trend has always been a friend of traders, and trend indicators help determine the trend and make the right decisions. Most of the trading systems developed by trading gurus are based on the trend. It is best used on timeframes above the M30, from the beginning of the London session to America. It should be remembered that there are no indicators that are not wrong. Any strategy requires confirmation of its signals. When building your own system, it is recommended to use several indic
フィルタ:
レビューなし
レビューに返信