TrendBox Indicator
- インディケータ
- バージョン: 1.0

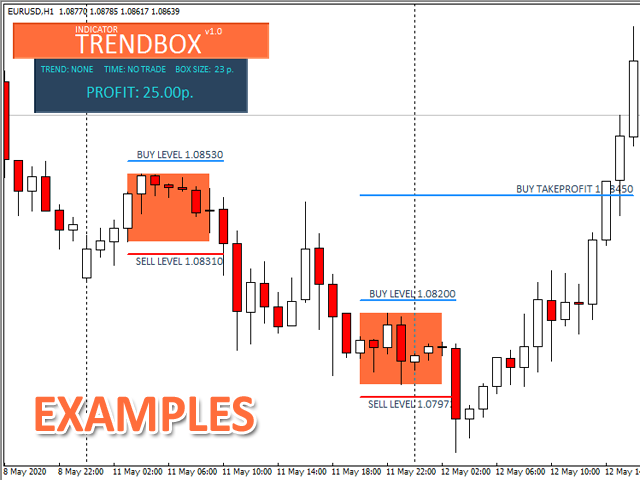
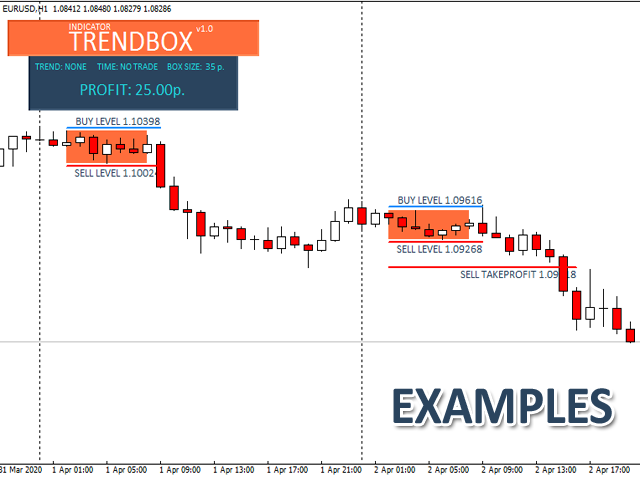
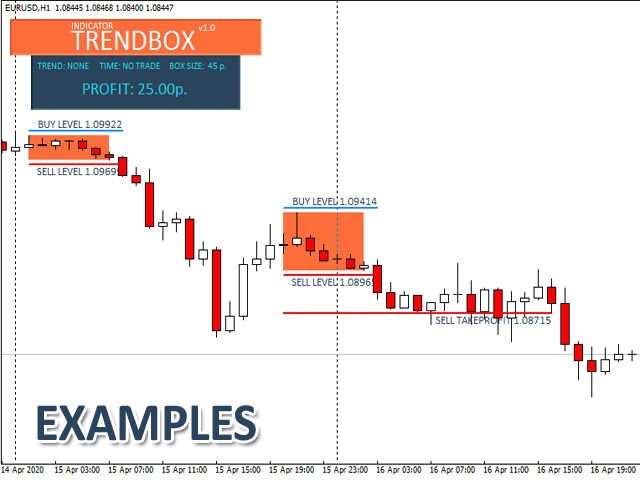
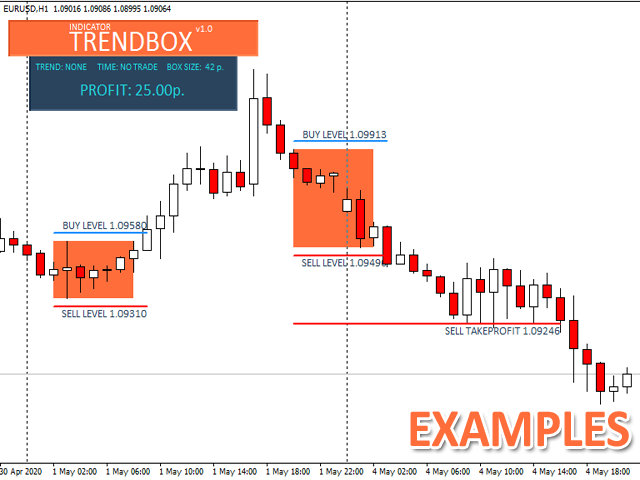
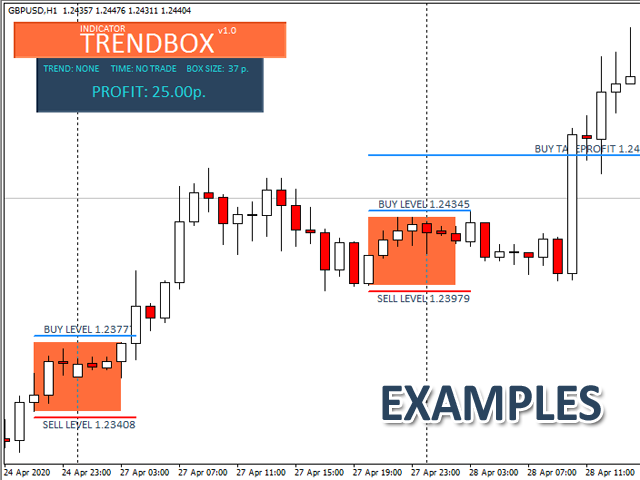
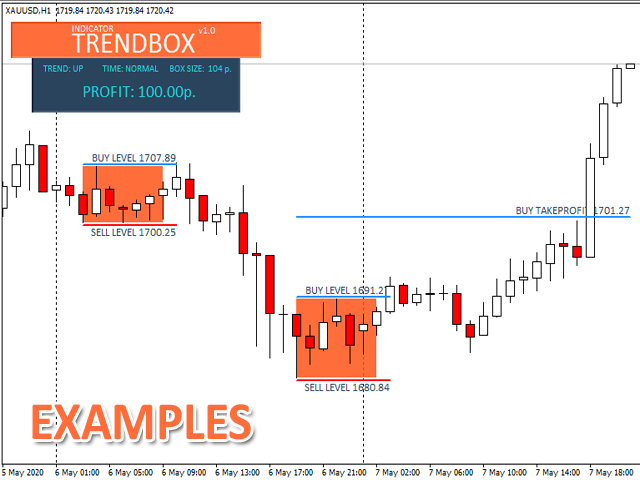
The indicator looks for consolidation (flat) in the market at a certain time, builds a box-channel and marks levels indented from it for a breakdawn. After crossing one of the levels, the indicator marks the zone for take profit and calculates the corresponding profit or loss in the direction of this entry on the panel. Thus, the indicator, adjusting to the market, finds a flat area of the market, with the beginning of a trend movement to enter it.
Version for MT5: https://www.mql5.com/en/market/product/58380
Benefits:
- a unique search system for consolidation (flat) by adjusting to the market;
- does not redraw;
- can be used on any timeframe and currency pair;
- flexible settings for more accurate results;
- a complete system of alerts from messages, mail to PUSH notifications.
Main parameters of the indicator:
| TakeProfit | - | takeprofit level |
| Buffer | - | indent in points from the formed box-channel |
| BarsAnalyze | - | number of analyzed bars |
| MaxDelta | - | maximum channel box size |
| StartHour | - | hour of the beginning of the analysis of the trade to set the box-channel |
| StopHour | - | trading analysis end hour |
| Alerts | - | enabling the alert system in case of level breakout |
| AlertMessage | - | breakdown alert |
| SoundMessage | - | sound message |
| EmailMessage | - | message about level breakdown to the mail specified in the terminal |
| PushMessage | - | PUSH message to mobile phone |
All values in points are indicated in 4-digit format, 5-digit translation is carried out automatically.
The indicator can be used as a separate trading system, or as an addition to an existing one.
On the screenshots below you can see examples of using the indicator on the chart.


Pretty cool indicator. Good work! Thanks for sharing.