My chat is open to all of you... for any suggestions you may have regarding the indicators I have already uploaded or anything new you would like to have. I love trading, I love programming, so if I have time, I will help you all wherever I can.
Noize Absorption Index - is the manual trading system that measures the difference of pressure between bears forces and bulls forces. Green line - is a noize free index that showing curent situation. Zero value of index shows totally choppy/flat market.Values above zero level shows how powerfull bullish wave is and values below zero measures bearish forces.Up arrow appears on bearish market when it's ready to reverse, dn arrow appears on weak bullish market, as a result of reverse expectation.
Fit line supports to extrapolation next movement of market, support for buy/sell decision. Indicator using spline algorithm to extrapolation. You can change number of spline with parameter "PointsNumber" and number of extrapolation point with "ExtrapolateBars". Eextrapolation points will be save into csv format, with prefix in parameter "PointsPrefix", and store in folder File of Data Folder.
** All Symbols x All Timeframes scan just by pressing scanner button ** Discount: The price is $50$, But now it is just $39, Limited time offer is active.
*** Contact me to send you instruction and add you in "Trend Reversal group" for sharing or seeing experiences with other users. Introduction: Trendlines are the most famous technical analysis in trading . Trendlines continually form on the charts of markets across all the different timeframes providing huge opportunities for traders
Visual CrossPulse Dynamics: Trade with the Market's True Rhythm Unlock a new level of market insight with Visual CrossPulse Dynamics, a sophisticated trading indicator designed to adapt to ever-changing volatility and reveal the true direction of the trend. Are you tired of indicators that lag in fast-moving markets or give false signals during consolidation? The Visual CrossPulse Dynamics indicator solves this problem by using an advanced, adaptive algorithm that intelligently adjusts to the m
MySNR & OCL Combined: The Ultimate Malaysian Support & Resistance Line Price Action Indicator Tired of drawing levels manually or guessing where the price will react inside a thick, messy zone? Now you can save time and trade with absolute confidence. Unlike traditional tools that plot broad and ambiguous zones, MySNR & OCL Combined is an advanced analytical tool engineered to automatically plot exact, pinpoint price action lines. Specifically designed to simplify the highly effective Mal
CosmiCLab SMC FIBO CosmiCLab SMC FIBO is a professional trading indicator designed for traders who use Smart Money Concepts (SMC), market structure analysis and Fibonacci retracement levels. The indicator automatically detects market swings and builds Fibonacci levels based on the latest impulse movement.
It also identifies market structure changes such as BOS (Break of Structure) and CHOCH (Change of Character), helping traders understand the current market direction. CosmiCLab SMC FIBO also pr
Max Min Delta Indicator - Market Volume Imbalance Analysis Gain Deeper Insights into Market Volume Imbalance with Delta Analysis What is the Max Min Delta Indicator? The Max Min Delta Indicator is a powerful market volume analysis tool that visually represents maximum and minimum delta values using a histogram. It helps traders identify market strength, weakness, absorption, and aggressive buying/selling activity with precision. Key Features Histogram Visualization: Displays Max Delta (Green) an
HAT IT DOES MONTHLY HIGH & LOW — AUTO-DRAWN EVERY MONTH Draws the High and Low of every month for the current year (or any year you set). Each level extends as a horizontal ray into the future so you always see where price is reacting to historical monthly extremes. Color-coded (blue = high, red = low), labeled (JAN HIGH, FEB LOW etc.), fully customizable width and style. Toggle individual months on or off. WEEKLY HIGH & LOW
SMART ATR GRID PRO++ – Adaptive Grid Intelligence Suite is a next-generation, institutional-grade grid trading indicator engineered for traders who demand precision, adaptability, and comprehensive market structure analysis. By seamlessly integrating Adaptive Volatility Grid System , KAMA Candle Trend Filtering , Multi-Factor Trend Detection (ADX + EMA20/50) , Dynamic Heatmap Zone Engine , and Real-Time Market Regime Classification , this indicator delivers a complete decision-making
This is an advanced multi-timeframe version of the popular Hull Moving Average (HMA) Features Two lines of the Hull indicator of different timeframes on the same chart. The HMA line of the higher timeframe defines the trend, and the HMA line of the current timeframe defines the short-term price movements. A graphical panel with HMA indicator data from all timeframes at the same time . If the HMA switched its direction on any timeframe, the panel displays a question or exclamation mark with a tex
Price Magnet — Price Density and Attraction Levels Indicator Price Magnet is a professional analytical tool designed to identify key support and resistance levels based on statistical Price Density. The indicator analyzes a specified historical period and detects price levels where the market spent the most time. These zones act as “magnets,” attracting price action or forming a structural base for potential reversals. Unlike traditional Volume Profile tools, Price Magnet focuses on price-time d
RSI Currency Strength Meter is a powerful and elegant multi-currency indicator that measures the real-time relative strength of the 8 major currencies using RSI logic. By calculating the smoothed performance of each currency across its major pairs and applying the RSI formula, it delivers clean and responsive strength lines that make it easy to spot which currencies are truly strong or weak at any moment. This indicator is particularly useful for visualizing currency correlations and divergence
Welcome to the Ultimate Harmonic Patterns recognition indicator that is focused to detect advanced patterns. The Gartley pattern, Bat pattern, and Cypher pattern are popular technical analysis tools used by traders to identify potential reversal points in the market.
Our Ultimate Harmonic Patterns recognition Indicator is a powerful tool that uses advanced algorithms to scan the markets and identify these patterns in real-time.
With our Ultimate Harmonic Patterns recognition Indicator, you ca
Overview Cardwell Range Analyze reads the market through an RSI range regime, inspired by Andrew Cardwell's RSI rules, combined with a trend filter. It adds higher timeframe confirmation and an ADX filter to avoid weak, sideways markets. When momentum and trend agree, the indicator prints a Buy or Sell signal and draws a complete trade plan on the chart: Entry, Stop Loss and three Take Profit targets, with shaded risk and reward zones. A compact dashboard summarizes the market state at a glance.
Advanced Lot & Profit Monitor PRO is a powerful MT5 indicator that provides real-time monitoring of your trading positions directly on the chart. It displays the number of orders, total lot sizes, and profit (including swap) for Buy and Sell positions separately, as well as the overall account performance. Designed with a clean and customizable interface, this tool helps traders stay in control of their exposure and risk at all times. Key Features: Real-time monitoring of open positions Sepa
What Is Trend Master Pro? Trend Master Pro is a professional-grade trend trading indicator built for MetaTrader 5. It was designed with one goal in mind — to keep you on the right side of the market at all times by combining three powerful technical tools into a single, clean, easy-to-read display directly on your price chart. Instead of cluttering your screen with multiple separate indicators, Trend Master Pro fuses an EMA Ribbon trend filter , a ZigZag swing point engine , and a breako
Cumulative delta indicator As most traders believe, the price moves under the pressure of market buying or selling. When someone redeems an offer standing in the cup, the deal is a "buy". If someone pours into the bid standing in the cup - the deal goes with the direction of "sale". The delta is the difference between purchases and sales. A cumulative delta - the difference between the cumulative sum of purchases and sales for a certain period of time. It allows you to see who is currently contr
取引セッションインジケータは、各取引セッションの開始と終了を強調表示します 。
セッションの開始/終了をカスタマイズする可能性のある Trading_Session_Indicator_Free 製品の有料版。
[オプション:] Asian session Open Asian session Close Asian session OpenSummertime Asian session CloseSummertime European session Open European session Close European session Open European session Close Timeshift
最良の結果を得るには、M15-H2時間枠を使用してください。
時間枠M1、M5の修正を追加しました。 おおよその補正:
Bars Correction ------------------ 23.50 ____ 10 23.54 ____ 5 23.55 ____ 4(5) 00.05 ____ 5(6)
市場の私の他のプロダクト htt
ini adalah indikator khusus digunakan untuk trading di binary.com dengan pair volatility 75. indikator ini sangat simpel dan mudah digunakan baik untuk yang sudah profesional atau pun yang baru dalam dunia trading terutama yang baru di market volatility 75.indikator ini lebih bertujuan untuk scalping trader dan menggunakan timeframe M1 sebagai acuan untuk entry. this is a special indicator used to trade at binary.com with a volatility pair of 75. this indicator is very simple and easy to use bot
Stratos Pali Indicator is a revolutionary tool designed to enhance your trading strategy by accurately identifying market trends. This sophisticated indicator uses a unique algorithm to generate a complete histogram, which records when the trend is Long or Short. When a trend reversal occurs, an arrow appears, indicating the new direction of the trend.
Important Information Revealed Leave a review and contact me via mql5 message to receive My Top 5 set files for Stratos Pali at no cost !
Down
SuperScalp Pro – プロフェッショナル多層コンフルエンス・スキャルピングシステム SuperScalp Pro は、複数のコンフルエンスを組み合わせたプロフェッショナル向けスキャルピングシステムです。より高い確率のトレードチャンスを見つけられるよう設計されており、明確なエントリー確認、ATRに基づくStop LossとTake Profit、さらにXAUUSD、BTCUSD、主要なFX通貨ペアに対応した柔軟なシグナルフィルター機能を提供します。
完全なドキュメントは製品ブログにあります: [User Guide]
SuperScalp Pro Auto Trader EA による自動売買が利用可能です: [Auto Trader]
SuperScalp Pro のトレードロジックを基に開発されたゴールド自動スキャルピングEA: [SuperScalp Gold]
SuperScalp Pro は、Supertrend、VWAP、EMA、RSI、ADX、出来高分析、ボリンジャーバンド、MACDダイバージェンスを組み合わせ、低品質なトレードセットアップをフィルタリングし
Welcome to ENTRY IN THE ZONE AND SMC MULTI TIMEFRAME Entry In The Zone and SMC Multi Timeframe is a professional trading indicator built on Smart Money Concepts (SMC) , combining market structure analysis with a No Repaint BUY / SELL signal system in a single indicator. It helps traders understand market structure more clearly, identify key price zones, and focus on higher-quality trading opportunities. By combining Multi-Timeframe Analysis , Points of Interest (POIs) , and real-time signals, th
Neuro Poseidon is a new indicator by Daria Rezueva. It combines precise trading signals with adaptive TP/SL levels - creating best possible trades as a result!
Message me and get Neuro Poseidon Assistant as a gift to automize your trading process!
What makes it stand out?
1. Proven profitability on all assets and timeframes
2. Only confirmed BUY and SELL signals present on the chart
3. Adaptive TP & SL levels generated by the software for each trade
4. Easy to understand - suitable for al
Crystal Heikin Ashi Signals - Professional Trend & Signal Detection Indicator Advanced Heikin Ashi Visualization with Intelligent Signal System for Manual & Automated Trading
Final Price: $149 ---------> Price goes up $10 after every 10 sales .
Limited slots available — act fast .
Overview Crystal Heikin Ashi Signals is a professional-grade MetaTrader 5 indicator that combines pure Heikin Ashi candle visualization with an advanced momentum-shift detection system. Designed for both manual traders
ARIPoint is a powerful trading companion designed to generate high-probability entry signals with dynamic TP/SL/DP levels based on volatility. Built-in performance tracking shows win/loss stats, PP1/PP2 hits, and success rates all updated live. Key Features: Buy/Sell signals with adaptive volatility bands Real-time TP/SL/DP levels based on ATR Built-in MA Filter with optional ATR/StdDev volatility Performance stats panel (Success, Profit/Loss, PP1/PP2) Alerts via popup, sound, push, or email Cu
GEM Signal Pro GEM Signal Pro は、MetaTrader 5 向けのトレンドフォロー型インジケーターです。より明確なシグナル、より整理されたトレードセットアップ、そして実用的なリスク管理をチャート上で確認したいトレーダーのために設計されています。 単純な矢印だけを表示するのではなく、GEM Signal Pro はトレード全体の考え方を、より見やすく分かりやすい形で表示します。条件が確認されると、インジケーターはエントリー価格、ストップロス、利確目標をチャート上に表示し、トレードセットアップをより効率的に確認できるようにします。 動作の仕組み このインジケーターは、まず内部ロジックに基づいて有効なシードシグナルを検出します。 確認条件が満たされると、GEM Signal Pro はチャート上に完全なセットアップを表示します。これにより、トレーダーはトレード構造をより明確に把握し、手作業による分析を減らすことができます。 チャート上のトレードレベル 確認済みシグナルに対して、GEM Signal Pro は以下を表示できます。 エントリー価格
ストップロス
テ
FX Power: 通貨の強弱を分析して、より賢い取引を実現 概要
FX Power は主要通貨と金の実際の強弱をあらゆる市場状況で理解するための必須ツールです。強い通貨を買い、弱い通貨を売ることで、 FX Power は取引の意思決定を簡素化し、高い確率の取引機会を見出します。トレンドを追従する場合でも、極端なデルタ値を使用して反転を予測する場合でも、このツールはあなたの取引スタイルに完全に適応します。ただ取引するだけではなく、 FX Power で賢く取引をしましょう。
1. なぜ FX Power がトレーダーにとって非常に有益なのか 通貨と金のリアルタイム強弱分析
• FX Power は主要通貨と金の相対的な強弱を計算し、マーケットダイナミクスに関する明確な洞察を提供します。
• どの資産がリードしているか、または後れを取っているかを監視して、取引するペアを賢く選びましょう。 マルチタイムフレームの包括的なビュー
• 短期、中期、長期のタイムフレームで通貨と金の強弱を追跡し、マーケットトレンドに基づいて取引戦略を調整できます。
• スキャルピングからスイングトレード
The Oracle Pro:MT5向け合成マルチタイムフレーム・バイアスエンジン ️ サマー・ローンチ・オファー — The Oracle Pro を 199 USD で(早期購入者向け)。価格は普及に応じて上昇します。最終価格 399 USD。 The Oracle Pro は、要求の高いプロのトレーダーのために作られた MetaTrader 5 向けのプレミアム・マルチタイムフレーム バイアスエンジン です。ひとつの問いに規律をもって答えます。すなわち、各タイムフレームの現在の方向バイアスは何か、その強さはどれほどか、そしてタイムフレーム同士はどれだけ一致しているか。すべては確定足のみで計算され、リペイントはありません。 The Oracle Pro はマルチファクター・コンセンサス・システムです。独自のインジケーターと最適化されたアルゴリズムを単一の高度なコンセンサス・ベクトルに統合し、それを単一のインジケーター・インスタンス内で現在足と上位足のスタックにわたって読み取ります。複数のチャートにばらばらのツールを積み重ねる代わりに、です。 これは Oracle コンセンサス手法
Market Structure Patterns is an indicator based on smart money concepts that displays SMC/ICT elements that can take your trading decisions to the next level. Take advantage of the alerts , push notifications and email messages to keep informed from when an element is formed on the chart, the price crosses a level and/or enters in a box/zone. Developers can access the values of the elements of the indicator using the global variables what allows the automation of trading d
This is the MT5 version. Get MT4 version here → https://www.mql5.com/en/market/product/52923
In the third screenshot (Daylight Mode) I have marked 7 elements that we are going to explain step by step.
1 Three buttons. a) Night Mode b) Daylight Mode c) Fix scale / Adjusted scale
2 Four buttons.
a) Draw a buy arrow, buy line and the corresponding Stop Loss based on ATR.
b) Close the previously drawn buy and drows a check mark.
c) Draw a sell arrow, sell line and the
This is MT5 version Get Tunnel Warrens MT4 here
Here are several indicators that work together. It basically works with moving averages and various levels of ATR creating a dynamic channel through which the price is drained. As I always recommend, you should try it before using it in live so that you understand how it works. The market entry signal is similar to other MA indicators, but with this one you also have a graphical analysis of the moment when the trend is found and dynamic levels to
This is the MT5 version. Get Dual Onset MT4 here
It is an algorithm to detect trend changes early. You should try multiple values for the Multiplier parameter (1 <value <10 recommended). At first glance you can see effective entries. This is, in fact, one of the rows that Geleg Faktor initially had. But it was removed because it was no longer needed. The other rows were sufficient for G.Faktor's effectiveness, but I still wanted to share this one.
Always test before using it on your live ac
Check it out and if you like it just enjoy it. Try various values to find the setting that best suits your trading. Upward signal if the indicator is colored lawn green and bearish signal if the indicator is gray. You can use the line itself to trailing stop when you open orders. This is just a tool. A complement. It is not a strategy. Combine it with your own analysis Just download it and try it, it's free.
Based on a combination of indicators, PS Acid Fulx is an excellent indicator for knowing when to buy or sell on any asset and temporaryity. The indicator myself I have used it as a tool for my analysis when trading Forex. It is a useful and easy-to-understand trend indicator. If you combine it with your own analyses you will surely get a good result in your operation.
Based on a combination of indicators, E13 Acid Fulx is an excellent indicator for knowing when to buy or sell on any asset and temporaryity. The indicator myself I have used it as a tool for my analysis when trading Forex. It is a useful and easy-to-understand trend indicator. If you combine it with your own analyses you will surely get a good result in your operation.
It is an algorithm to detect trend changes early. You should try multiple values for the Multiplier parameter (1 <value <10 recommended). At first glance you can see effective entries. This is, in fact, one of the rows that Geleg Faktor initially had. But it was removed because it was no longer needed. The other rows were sufficient for G.Faktor's effectiveness, but I still wanted to share this one.
Always test before using it on your live account so that you fully understand how it works and
Buy and sell signals using the MACD histogram. The interface is simple and easy to understand. You can perzonalize the indicator in several ways according to its visual style or even more importantly, its setting of parameters to detect market signals. Using the Multiplier option in the menu you can increase the indicator period although it is recommended to use the default settings.
This is the MT5 version. Get Q-Math MT4 here
Check it out and if you like it just enjoy it. Try various values to find the setting that best suits your trading. Upward signal if the indicator is colored lawn green and bearish signal if the indicator is gray. You can use the line itself to trailing stop when you open orders. This is just a tool. A complement. It is not a strategy. Combine it with your own analysis Just download it and try it, it's free.
Trading is about waiting for the right time. This indicator was created to know what is happening on our charts without having to cover the screen with indicators. In addition, it has several types of alerts that allow us to dedicate our time to other things until something interesting happens. You can use multiple alarms at the same time. It is not a problem.
By default AlterAlert offers us alerts when the following indicators give us a signal:
Moving average (MA crosses) Stochastic Oscillat
Here are several indicators that work together. It basically works with moving averages and various levels of ATR creating a dynamic channel through which the price is drained. As I always recommend, you should try it before using it in live so that you understand how it works. The market entry signal is similar to other MA indicators, but with this one you also have a graphical analysis of the moment when the trend is found and dynamic levels to adjust your stop loss and take profit depending
With this customizable indicator you will be able to observe other timeframes besides the usual one. This way you will get to know better the general environment in which the price moves and probably will be better your effectiveness. *It is important that the timeframe in the indicator is greater than that set in Metatrader. I'll share more indicators for free soon. If you have any specific ideas of an indicator that you want to have you can write me a private message directly. Opinions, review
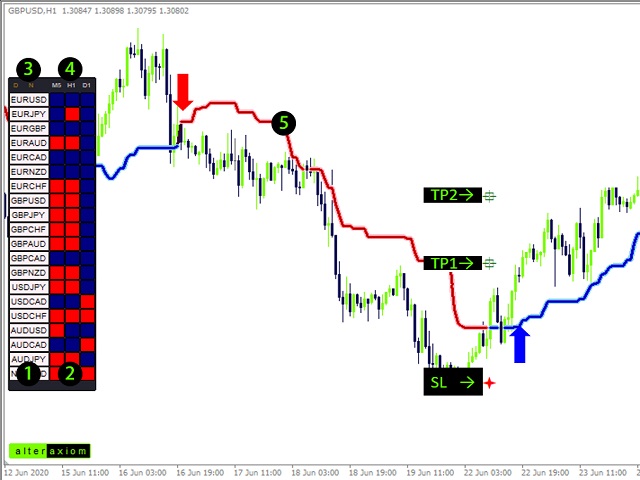
In the third screenshot (Daylight Mode) I have marked 7 elements that we are going to explain step by step.
1 Three buttons.
a) Night Mode
b) Daylight Mode
c) Fixed scale / Adjusted scale
2 Four buttons.
a) Draw a buy arrow, buy line and the corresponding Stop Loss based on ATR.
b) Close the previously drawn buy and drows a check mark.
c) Draw a sell arrow, sell line and the corresponding Stop Loss based on ATR.
d) Close the previously drawn sell and drows a ch
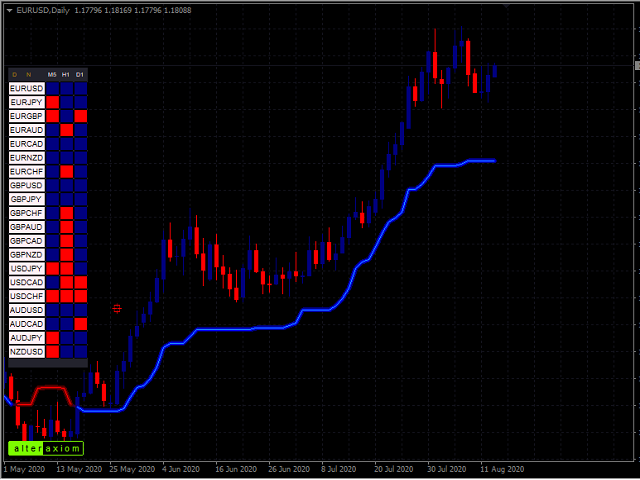
The new indicator is a trend predictor for the current chart as well as other symbols and timeframes. Every button on the board is interactive. By default, you have 20 currency pairs in the watchlist and three timeframes (M5, H1, D1) but you can choose the periods and symbols you want to display from the menu.
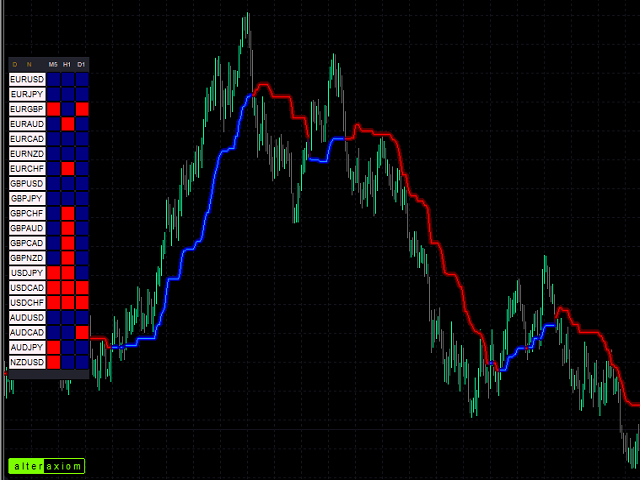
If the indicator is blue, it indicates the beginning of an uptrend. If it is red, it indicates the beginning of a downtrend.
In capture # 3 (Daylight mode) I will explain each element i
Trading is about waiting for the right time. This indicator was created to know what is happening on our charts without having to cover the screen with indicators. In addition, it has several types of alerts that allow us to dedicate our time to other things until something interesting happens. You can use multiple alarms at the same time. It is not a problem. By default AlterAlert offers us alerts when the following indicators give us a signal:
Moving average (MA crosses) Stochastic Oscillato
It is a truly useful multifunctional tool. I did it thinking about my needs as a trader some years ago although I have been modifying it for my partners to use it.
This tool allows: Directly send buy or sell orders with one click and shows where you should place the stop loss based on an algorithm using ATR and comparison with previous significant levels.
Close all profits by clicking a button.
Close all losses by clicking a button.
Close all operations by clicking a button.
Shows the


ユーザーは評価に対して何もコメントを残しませんでした