MA Break Point
- インディケータ
- バージョン: 1.0
- アクティベーション: 5
MA Break Point is based on moving average and a priceaction logic to find the points in which the currency will probably go in a defined direction.
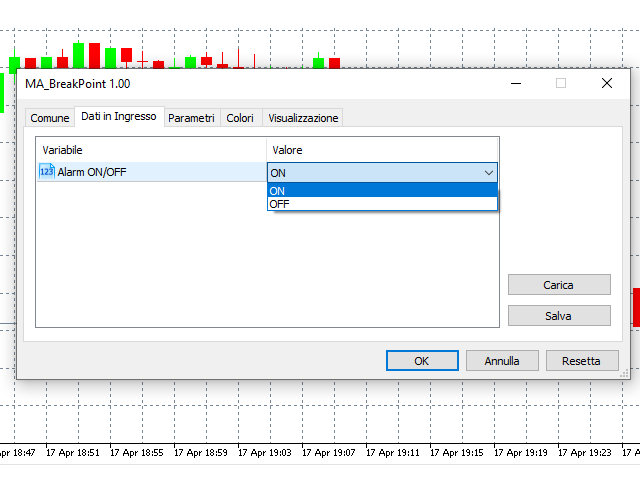
Inputs:
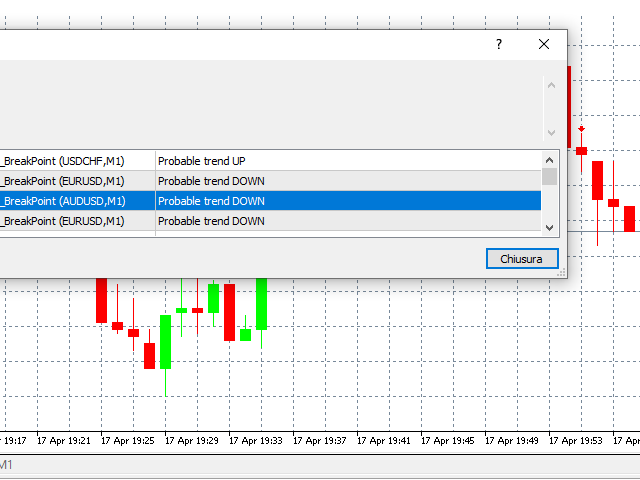
- Alarm ON/OFF: turn on or off alarm on screen.
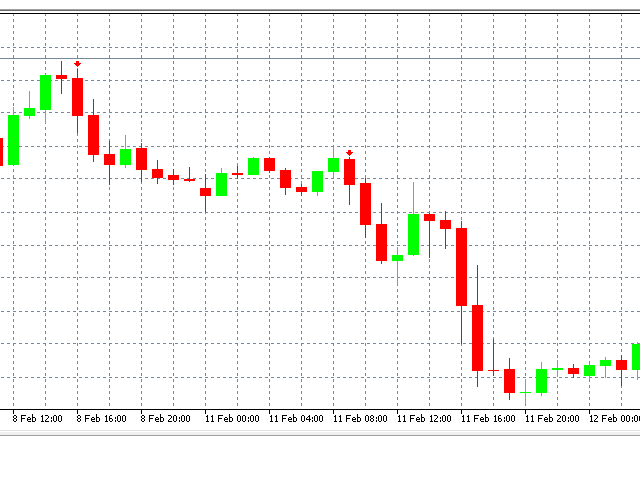
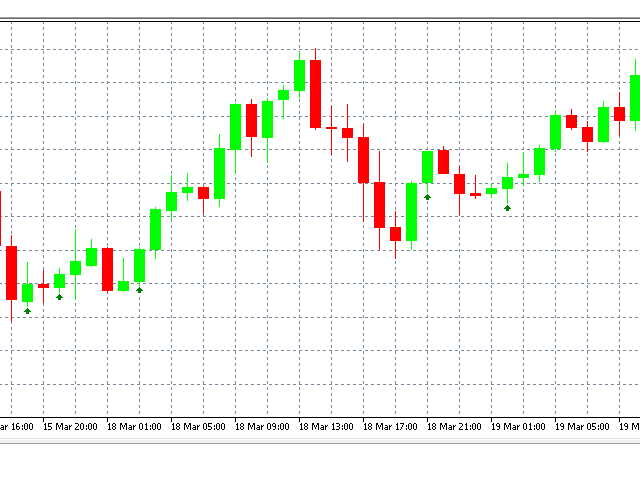
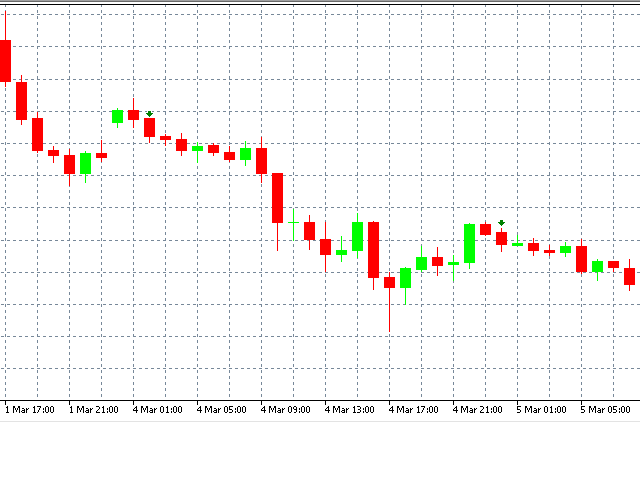
The indicator draws an arrow pointing the direction to follow based on when the currency cross a moving average and verify the trend with another ma.
MA Break Point can help you to choose the moment to do your trades in a specific direction, strengthening your trading strategy.