Smart Breakout Indicator MT5

1
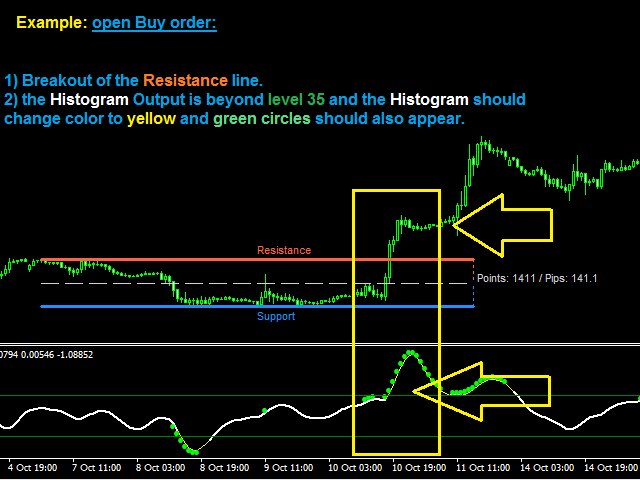
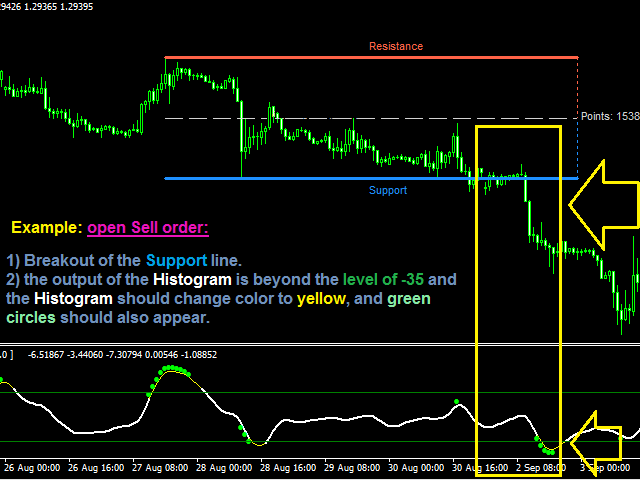
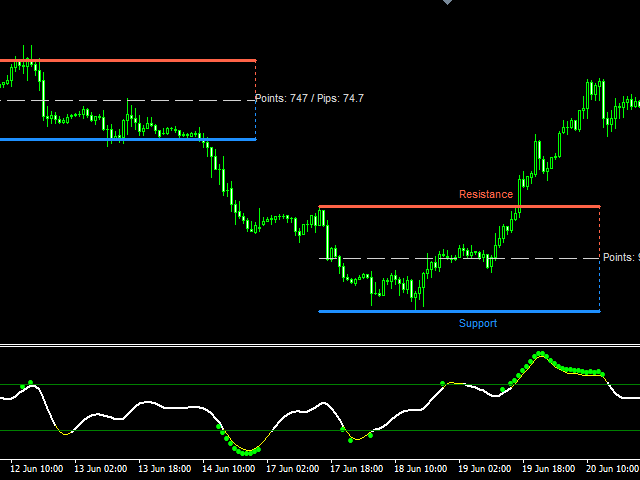
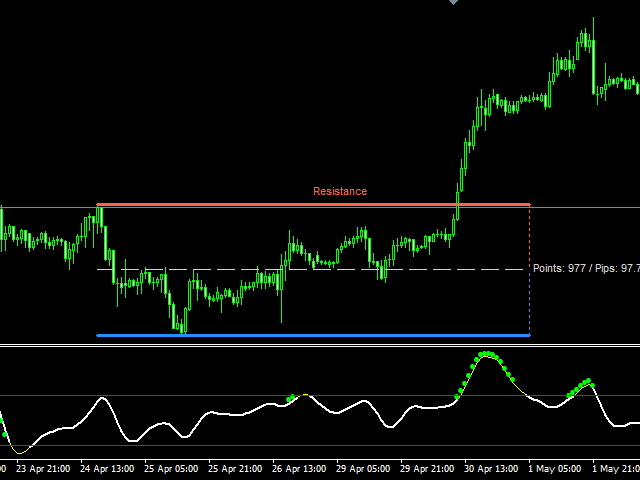
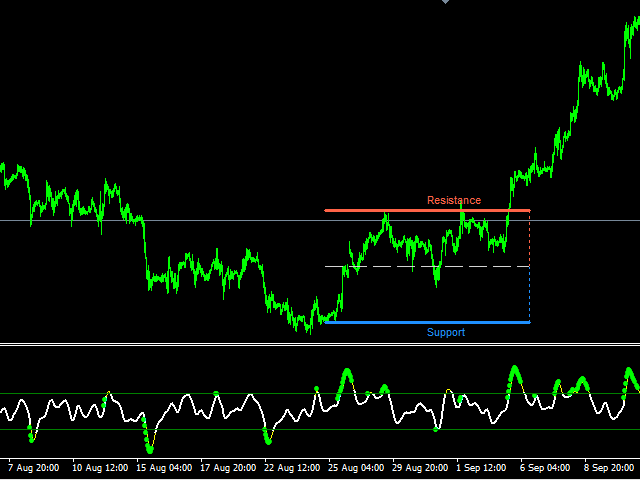
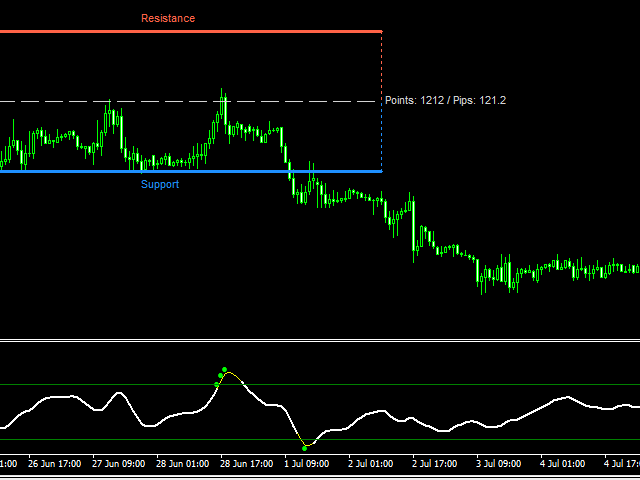
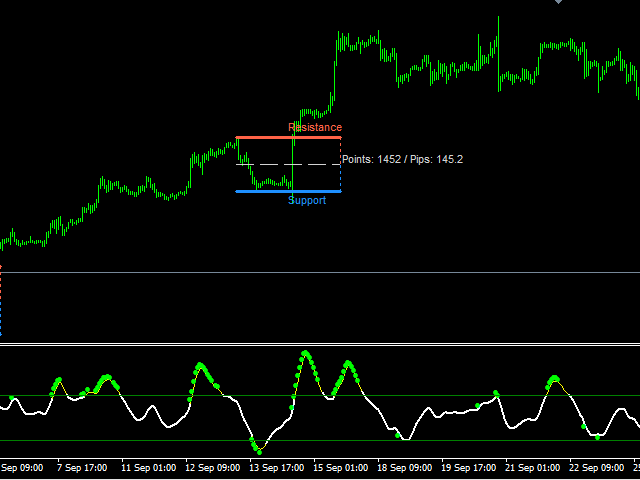
Smart Breakout Indicator determines support and resistance levels and also shows the breakout points of the levels in the form of a histogram.

The program contains two indicators in one: 1-support and resistance lines, 2-histogram indicator based on high price fluctuations.
The indicator autonomously calculates the best support and resistance levels and also in the form of a histogram shows the best moments of the breakdown of the lines.

The histogram indicator is based on the action of price fluctuations.

On the main chart, the support and resistance lines are calculated, and on the additional indicator (subwindow), the histogram is calculated for the price deviation.

The support and resistance lines are used as the main indicator and the histogram indicator is used to confirm the signal (Buy, Sell or pending orders).

The indicator uses many parameters to flexibly adjust the indicator for any pair and timeframe.
By default, the indicator is optimally configured for any pair and timeframe.

The indicator is designed with the ability to configure all parameters in accordance with your requirements. You can enable or disable any functions.

When the signal Buy / Sell the indicator will notify using notification: Alert,Sound signal, Email, Push.

Detailed description of all parameters here: https://www.mql5.com/ru/blogs/post/731152

This is a link for general discussion of the indicatorhttps://www.mql5.com/ru/blogs/post/731152

Parameters

  • Name_indicator - Indicator names to use multiple indicators on the same chart.
  • Max_Bars_History - Bars for drawing the indicator.
  • Use_Support_and_Resistance_Lines - Show support and resistance lines.
  • Use_Lines_Information_in_Points - Show items information.
  • Use_Center_Line - Show center line.
  • Show_Inscriptions_Support_and_Resistance - Show descriptions of the levels.
  • Period Main Chart - The period of the main indicator.
  • Coefficient in Point - Coefficient for calculating the main indicator of support and resistance lines.
  • Period Separate Chart - Period of additional histogram indicator.
  • Coefficient - Coefficient for calculating additional histogram indicator.
  • Main_Chart_Shift_Bar_for_Additional_Line - Bar shift of the main indicator of support and resistance lines.
  • Main_Chart_Shift_Bar_for_Lines - Bar shift of the main indicator lines for information points.
    • Style/width/Color_Lines - Style, width, color for the main graph.
      • Main_Chart_Color_Level_Resistance 
      • Main_Chart_Color_Level_Support
      • Main_Chart_Line_Width
      • Main_Chart_Line_Style 
      • Main_Chart_Color_Center_Line
      • Main_Chart_Center_Line_Width
      • Main_Chart_Center_Line_Style
      • Main_Chart_Shift_Bar_for_Additional_Line
      • Main_Chart_Color_Additional_Line_Resistance
      • Main_Chart_Color_Additional_Line_Support
      • Main_Chart_Additional_Line_Width 
      • Main_Chart_Additional_Line_Style
      • Main_Chart_Color_Point
      • Main_Chart_Point_Width
    • Style/width/Color_Lines - Style, width, color for histogram.
      • Separate_Chart_Color_Main_Line
      • Separate_Chart_Main_Line_Width
      • Separate_Chart_Main_Line_Style
      • Separate_Chart_Color_Signal_Line
      • Separate_Chart_Signal_Line_Width
      • Separate_Chart_Signal_Line_Style
      • Separate_Chart_Color_Circle
      • Separate_Chart_Circle_Width
      • Separate_Chart_Color_levels
      • Separate_Chart_Main_levels_Width
      • Separate_Chart_levels_Style
    • level_UP - UP level setting.
    • level_Down - Down level setting.


    Notification settings:

    • Sound_signal — Enable the audio signal.
    • Name_sound_signal — Signal audio file name.
    • Alert_signal — Enable alerts.
    • Email_signal — Enable email notifications.
    • PUSH_signal — Enable push notifications.


-----------------------------------------------------

>>>> Our group in mql5: https://www.mql5.com/en/messages/016a118dc374d801 <<<<


おすすめのプロダクト
Support And Resistance ACPG Indicator  The Support And Resistance ACPG Indicator  (developed by Grok by xAI) is an advanced tool for the MetaTrader 5 (MQL5) platform, designed to identify and visualize support and resistance zones on a price chart. Unlike traditional support and resistance indicators, the ACPG method combines a dynamic approach based on swing points, volatility analysis using the Average True Range (ATR), and an adaptive clustering system to detect high-relevance zones in the
FREE
The Rocket Trend indicator is trending. The indicator draws two-color points connected by lines along the chart. This is a trend indicator, it is an algorithmic indicator. It is easy to work and understand when a blue circle appears, you need to buy, when a red one appears, sell. The indicator is used for scalping and pipsing, and has proven itself well. Rocket Trend is available for analyzing the direction of the trend for a specific period of time. Ideal for novice traders learning the laws o
Smart Trendlines – No.1 Trendlines Indicator Smart Trendlines is a precision tool that automatically draws trendlines based on every valid pivot point, helping traders identify key support and resistance zones. It continuously adjusts as new market pivots form, providing a live and accurate reflection of price structure. Whether you’re tracking trends, preparing for reversals, or anticipating breakouts — this indicator keeps you one step ahead. It works seamlessly across all assets including For
SMC Venom Model BPR インジケーターは、スマート マネー (SMC) コンセプトで取引するトレーダー向けのプロフェッショナル ツールです。価格チャート上の 2 つの主要なパターンを自動的に識別します。 FVG   (フェアバリューギャップ) は、3 本のローソク足の組み合わせで、最初のローソク足と 3 番目のローソク足の間にギャップがあります。ボリュームサポートのないレベル間のゾーンを形成し、価格修正につながることがよくあります。 BPR   (バランス価格範囲) は、2 つの FVG パターンの組み合わせで、「ブリッジ」を形成します。これは、価格がボリュームアクティビティの少ない動きで動くときに、ブレイクアウトしてレベルに戻るゾーンで、ローソク足の間にギャップを作成します。 これらのパターンは、大規模な市場プレーヤーと一般参加者の相互作用が発生するチャート上のボリュームと価格動向の分析に基づいて、トレーダーが主要なサポート/レジスタンス レベル、ブレイクアウト ゾーン、エントリ ポイントを識別するのに役立ちます。 インジケーターは、長方形と矢印の形でパターンを視覚
Auto Fib Retracements
Ross Adam Langlands Nelson
4.2 (5)
Automatic Fibonacci Retracement Line Indicator. This indicator takes the current trend and if possible draws Fibonacci retracement lines from the swing until the current price. The Fibonacci levels used are: 0%, 23.6%, 38.2%, 50%, 61.8%, 76.4%, 100%. This indicator works for all charts over all timeframes. The Fibonacci levels are also recorded in buffers for use by other trading bots. Any comments, concerns or additional feature requirements are welcome and will be addressed promptly. 
FREE
上位タイムフレームに基づくフラクタルレベルは、上位タイムフレームのフラクタ ルに基づく正確なサポートおよびレジスタンスレベルを構築するよう設計された強力な ツールです。 仕組み: このインディケータは、上位タイムフレーム上のフラクタルのレ ベルを分析し、現在のチャートに表示します。インジケータのプロパティで上位タイムフレームを簡単に 調整でき、最大限の精度と戦略との関連性を得ることができます。 上位タイムフレームに基づくフラクタルレベルを使用する利点: 早 期 シ グ ナ ル 検 出:上位タイムフレームのフラクタルレベルを下位タイム フレームで見ることができるため、潜在的な売買シグナルをその開始時 点で識別することができます。 損益率の向上:低いタイムフレームでの早期エントリーにより、ストップロスを短く設定できるため、取引効率が大幅に向上します。 便利なアラート:重要なシグナルを見逃しません - エントリーやエグジットの機会を即座に通知します。 分析精度の向上:本当に重要な重要レベルに集中し、不必要な市場ノイズを無視します。 ハイヤータイムフレームに基づくFractal Lev
Adaptive Trend Lines
Henri Salvatore Bigatti
4.76 (25)
This indicator shows the TLH and TLL and some trendlines that allow us to estimate the trend of market.  It also shows the values of the angles of the lines in percentage in points (pip) , the standard deviation, and the trend of each line, and when it breaks the lines of support and resistance (TLH and TLL). And finally, it also shows the points identified as supports and resistances through the fractal algorithm in the graph. The high and low trend lines are supported by the highs and lows, th
FREE
Introducing our groundbreaking Forex indicator, specifically designed to help traders master the art of identifying critical support and resistance zones, as well as double top and double bottom patterns with unprecedented accuracy. Say goodbye to guesswork and hello to a powerful tool that will revolutionize your trading experience. Our proprietary indicator leverages cutting-edge technology to recognize key price levels where buying and selling pressures are poised to shift the market dynamics
Harmonic patterns are characteristic series of price movements with respect to Fibonacci levels, which statistically precede price reversals. This indicator searches for harmonic patterns. It is capable of recognising 26 classical and non-classical harmonic patterns : Classical Gartley Butterfly Alternate Butterfly Bat Alternate Bat Crab Deep Crab Three Drives Non-classical Shark Alternate Shark Cypher 5-0 Anti Gartley Anti Butterfly Anti Alternate Butterfly Anti Bat Anti Alternate Bat Anti Crab
DYJ BoS インジケーターは、次のような市場構造の変化の主な要素を自動的に識別してマークします。 構造のブレイクアウト (BoS): 価格が大きく変動し、構造の前のポイントを突破したときに発生します。 彼は上昇トレンドと下降トレンドの可能性のあるライン(UP と DN、つまり連続した新高値と新安値)をマークし、価格がこれらのラインを突破すると、赤(弱気)と緑(強気)の矢印でマークします。 BoS は通常、価格が以前の価格変動によって確立されたスイング安値または高値を決定的に突破したときに発生します。価格がスイング高値を上回ったりスイング安値を下回ったりすると、単に以前に形成された市場構造から抜け出すだけなので、「ブレイクアウト」構造と呼ばれます。これは多くの場合、市場センチメントとトレンドの方向の変化を示し、既存のトレンドの継続または新しいトレンドの始まりを示唆します。 ポジションのクローズの精度を高めるために、通常はストップロスとテイクプロフィットを設定しないことが推奨されます。最終ポジションは通常、同じ方向の次のブレイクスルー ポイント、または反対方向のブレイクスルー
Swing and Liquidity Sweep Finder is a powerful tool designed to automatically detect swing points and liquidity sweeps on your chart. It helps traders identify where the market is likely to grab liquidity before reversing, showing both internal and external liquidity zones with high accuracy. This indicator is ideal for ICT and Smart Money Concept traders who rely on swing structure and liquidity manipulation for their entries and exits. Our Team Services: If you are want to see our products cl
https://www.mql5.com/en/users/gedeegi/seller    The GEN indicator is a multifunctional technical analysis tool for the MetaTrader 5 (MT5) platform. It is designed to automatically identify and display key Support and Resistance (S&R) levels and detect False Breakout signals, providing clear and visual trading cues directly on your chart. Its primary goal is to help traders identify potential price reversal points and avoid market traps when the price fails to decisively break through key levels
FREE
support resistance levels indicator   mt5   : このツールは、チャート上にサポートラインとレジスタンスライン、さらにフィボナッチレベルを同じ精度で識別しプロットするマルチタイムフレームインジケーターです。TWの外国為替サポートとレジスタンスレベルは、複雑なアルゴリズムを使用してチャートをスキャンし、過去の価格安定化および反発レベルを特定し、タッチ数を記録します。 手動でサポートとレジスタンスレベルやフィボナッチリトレースメントを描くのに疲れましたか? この製品の機能をチェックしてみてください。驚くことでしょう。 製品の特徴: 1. マイナーおよびメジャーレベル:高度なアルゴリズムを使用して、マイナーおよびメジャーレベルを好みに応じてカスタマイズし、追加のレベルを削除できます。 2. レベルタッチ数:TWサポートレジスタンスレベルとブレイクmt5では、各レベルが過去に何回タッチされたかを計算し提供します。これにより、各レベルの強さを評価できます。 3. フィボナッチレベル:最後の波のフィボナッチレベルが動的に描画されるため、これ
Auto Support and Resistances
Flavio Javier Jarabeck
4.57 (70)
Are you tired of drawing Support & Resistance levels for your Quotes? Are you learning how to spot Support & Resistances? No matter what is your case, Auto Support & Resistances will draw those levels for you! AND, it can draw them from other timeframes, right into you current chart, no matter what timeframe you are using... You can also Agglutinate regions/zones that are too much closer to each other and turning them into one single Support & Resistance Level. All configurable. SETTINGS Timefr
FREE
Best SAR MT5
Ashkan Hazegh Nikrou
4.33 (3)
説明 :  外国為替市場(PSAR)で専門的で人気のあるインジケーターの1つに基づいた新しい無料インジケーターをご紹介します。このインジケーターは元のパラボリックSARインジケーターの新しい変更です。プロSARインジケーターでは、ドットと価格チャートのクロスオーバーを見ることができます。クロスオーバーはシグナルではありませんが、動きの終わりの可能性について話します。新しい青いドットで購入を開始し、最初の青いドットの1 atr前にストップロスを配置し、最後にドットが価格チャートを横切るとすぐに終了できます。 売買シグナルを開く方法は? 最初の青い点によるオープンバイトレードと最初の赤いドットによるオープンセルトレード 正しいストップロスはどこにありますか? 安全なストップロスは最初のドットにある可能性があります(最初の青いドットの買いの場合と最初の赤い点の売りの場合) 正しいテイクプロフィットはどこにありますか? テイクプロフィットはストップロス距離とRRに基づいて調整できるので、私の提案は2 RRで、ストップロスの2倍です。 利益を上げているのにtpを達成できなかった場合
FREE
Introducing the   Range Predictor : Your Ultimate Guide to Future Trading Ranges!   Imagine having the power to see into the future of market moves— Range Predictor   brings this dream to life. Designed to deliver real-time,   predictive support and resistance levels , this tool goes beyond standard indicators, offering trend direction insights and precise range   forecasts . Whether you're a day trader or a swing trader, the   Range Predictor   is your all-in-one toolkit for mastering the ma
フラットとトレンドを決定するための指標。 価格が2つのヒストグラムと2つの線(赤と青)のいずれかを下回っている場合、これは売りゾーンです。 このバージョンのインジケーターを購入するときは、1つの実際のアカウントと1つのデモアカウント用のMT4バージョン-ギフトとして(受け取るには、プライベートメッセージを書いてください)! 価格が2つのヒストグラムと2つの線(赤と青)のいずれかを上回っている場合、これは購入ゾーンです。 MT4バージョン: https//www.mql5.com/en/market/product/3793 価格が2つの線の間、またはいずれかのヒストグラムのゾーンにある場合、市場に明確な傾向はありません。簡単に言えば、市場は横ばいです。 インジケーターの動作は、スクリーンショットでより明確に示されています。
This indicator would help you I DENTIFY different HORIZONTAL SUPPORT / RESISTANCE LEVELS AND TRENDLINES.  ADVANTAGES: Use up till 5 different levels of Support and Resistance Use up till 5 different trend lines  Use true/false options to display for Support/Resistance or Trend line Image PARAMETERS: nPeriod: the time period to decide  Limits: the candles limit to look back UseHorizontalLines: true/false option to display Horizontal Support and Resistance Lines UseTrendline: true/false option to
This is an advanced multi-timeframe version of the popular Hull Moving Average (HMA) Features Two lines of the Hull indicator of different timeframes on the same chart. The HMA line of the higher timeframe defines the trend, and the HMA line of the current timeframe defines the short-term price movements. A graphical panel with HMA indicator data from all timeframes at the same time . If the HMA switched its direction on any timeframe, the panel displays a question or exclamation mark with a tex
プレミアムレベルは、正しい予測の精度が80%を超える独自の指標です。 この指標は、最高のトレーディングスペシャリストによって2か月以上テストされています。 あなたが他のどこにも見つけられない作者の指標! スクリーンショットから、このツールの正確さを自分で確認できます。 1は、1キャンドルの有効期限を持つバイナリーオプションの取引に最適です。 2はすべての通貨ペア、株式、商品、暗号通貨で機能します 手順: 赤い矢印が表示されたらすぐにダウントレードを開き、青い矢印が表示されたら閉じます。青い矢印の後に開くこともできます。 試してテストしてください!推奨設定はデフォルトです! 日足チャートで最高の精度を示します! インディケータは、2600 Pipsの収益性に対して、約10Pipsという非常に小さなマージンを使用します。
The new update makes this indicator a complete tool for studying, analyzing and operating probabilistic patterns. It includes: On-chart Multi-asset percentage monitor. Configurable martingales. Twenty-one pre-configured patterns, including Mhi patterns and C3. An advanced pattern editor to store up to 5 custom patterns. Backtest mode to test results with loss reports. Trend filter. Hit operational filter. Martingale Cycles option. Various types of strategies and alerts. Confluence between patter
This indicator scanning thorough the history and drawing horizontal rays on all bars untested lows and highs. Fresh supply/demand zones and support/resistance levels will be marked down. It allows to be sure that certain levels is fresh and has not been tested yet. Usually after strong departure price is not retesting base immediately and leaving unfilled orders.  There is no inputs, so indicator is ready to go.
Basic Support and Resistance   インジケータは、テクニカル分析を強化するために必要なソリューションです。このインジケータを使用すると、チャートにサポートレベルとレジスタンスレベルを投影できます/ mt4バージョン 機能 フィボナッチレベルの統合: サポートと抵抗レベルとともにフィボナッチレベルを表示するオプションを使用すると、私たちの指標は市場行動と逆転領域の可能性についてさらに深い洞察を提供します。 パフォーマンスの最適化: 各バーの開口部のみで拡張ラインを更新するオプションを使用すると、インジケータは、サポートレベルと抵抗レベルの精度を犠牲にすることなく最適なパフォーマンスを保証します。 入力 メイン設定 Timeframe:  この入力を通じて、より高い時間枠のサポートラインとレジスタンスラインをチャート上に表示することを選択できます。 Support/Resistance Strength [Number of Bars]:   この入力を使用して、サポートと抵抗の強度を決定できます。数が高いほど、サポート/抵抗がより強くなります。 Pric
Kst pro tools
Vincent Albert Feugier
KST Pro Tools – Smart Momentum Indicator Overview KST Pro Tools is an advanced momentum indicator based on Martin Pring’s classic Know Sure Thing (KST) . It has been redesigned to deliver a clean, instant, and unambiguous momentum reading , thanks to a smart and fully filtered histogram logic. This indicator shows only meaningful momentum , exactly when it matters. Indicator Components KST Line (blue) Measures the true strength of market momentum Built using 4 weighted and smoothed Rate
M & W Pattern Pro is an advanced scanner for M and W patters , it uses extra filters to ensure scanned patterns are profitable. The indicator can be used with all symbols and time frames. The indicator is a non repaint indicator with accurate statistics calculations. To use , simply scan the most profitable pair using the statistics dashboard accuracy , then enter trades on signal arrow and exit at the TP and SL levels. STATISTICS : Accuracy 1 : This is the percentage of the times price hits TP
Overview Support & Resistance (MTF) is a MetaTrader 5 indicator that automatically identifies swing highs (resistance) and swing lows (support) across up to three timeframes. It merges nearby levels to reduce clutter, adapts zone width to market volatility using ATR, and offers optional alerts when price breaks or retests those levels. Features Multi-timeframe pivot detection Identify pivots on the current chart plus two higher timeframes using a configurable pivot length. Merge-distance grou
FREE
MetaTraderでは、複数の   水平線   を描画し、それぞれの価格レベルを追跡するのは面倒な作業になることがあります。このインジケーターは、価格アラートの設定、サポートとレジスタンスの表示、その他の手動用途のために、等間隔で複数の水平線を自動で描画します。 このインジケーターは、短期間で売買による利益を狙いたい初心者のFXトレーダーに最適です。水平線は、相場がトレンド中またはレンジ相場である場合に、エントリーの可能性があるゾーンを見つける手助けをしてくれます。 機能 入力設定に基づいて、瞬時に複数の水平線を描画可能。 各水平線を区別しやすいように、カラフルなカラーテーマを採用。 複数の取引セッションのレンジを追跡するのに必須のツール。 価格が水平線にタッチした際にアラートを送信。 アラート間に間隔を設定でき、過度な通知を防止。 完全にカスタマイズ可能。 解説 このインジケーターは、入力設定で指定されたデータと指示に従って水平線を描画します。価格がこれらの水平線でどのように反応するかを観察することで、重要なサポート・レジスタンス付近でのトレード機会を見極めることができます。
The Swing High Low and Fibonacci Retracement Indicator is a powerful technical analysis tool designed to identify key price levels and potential reversal zones in the market. It automatically detects recent swing highs and swing lows on the chart and overlays Fibonacci retracement levels based on these points. This indicator helps traders: Visualize market structure by highlighting recent swing points. Identify support and resistance zones using Fibonacci ratios (e.g., 38.2%, 50%, 61.8%). Adapt
Crypto_Forex MT5用インジケーター「 RSI SPEED 」は、優れた予測ツールで、リペイント機能はありません。 - このインジケーターの計算は物理学の方程式に基づいています。RSI SPEEDはRSI自体の1次導関数です。 - RSI SPEEDは、主要トレンドの方向にスキャルピングエントリーするのに適しています。 - 適切なトレンドインジケーター(例えばHTF MA(画像参照)など)と組み合わせて使用​​してください。 - RSI SPEEDインジケーターは、R​​SI自体がどれだけ速く方向転換するかを示します。非常に敏感です。 - モメンタムトレード戦略にはRSI SPEEDインジケーターの使用をお勧めします。RSI SPEEDインジケーターの値が0未満の場合は価格モメンタムが下降し、RSI SPEEDインジケーターの値が0を超える場合は価格モメンタムが上昇します。 - インジケーターにはモバイルとPCのアラートが組み込まれています。 高品質のトレーディングロボットとインジケーターをご覧になるにはここをクリックしてください! これは、このMQL5ウェブサイトで
Fibo Daily Channel Indicator The  Indicator is a powerful tool for traders, providing precise daily support and resistance levels based on Fibonacci retracement and extension calculations. This indicator automatically draws key pivot points (PP, R1, R2, S1, S2) as well as additional extension levels (R3, R4, S3, S4), helping traders identify potential reversal and breakout zones with ease. It includes customizable alerts and push notifications, allowing traders to receive updates whenever the pr
このプロダクトを購入した人は以下も購入しています
このインジケーターを購入すると、プロ仕様のトレードマネージャーを無料で差し上げます。 まず第一に、このトレーディングシステムがノンリペイント、ノンリドロー、ノンラグのインジケーターであることを強調する価値がある。これにより、手動取引とロボット取引の両方に理想的なものになっています。 オンラインコース、マニュアル、プリセットのダウンロード。 「スマートトレンドトレーディングシステム MT5」は、新規および経験豊富なトレーダー向けにカスタマイズされた包括的なトレーディングソリューションです。10以上のプレミアムインジケーターを組み合わせ、7つ以上の堅実なトレーディング戦略を備えており、多様な市場状況に対応する多目的な選択肢となっています。 トレンドフォロー戦略:トレンドを効果的に乗り越えるための正確なエントリーとストップロス管理を提供します。 リバーサル戦略:潜在的なトレンドの反転を特定し、トレーダーがレンジ相場を活用できるようにします。 スキャルピング戦略:高速で正確なデイトレードおよび短期取引のために設計されています。 安定性:すべてのインジケーターはノンリペイント、ノンリドロー、ノ
このインジケーターを購入された方には、以下の特典を 無料 で提供しています: 各トレードを自動で管理し、ストップロスとテイクプロフィットを設定し、戦略ルールに基づいてポジションを決済する補助ツール 「Bomber Utility」 様々な銘柄に合わせたインジケーターの設定ファイル(セットファイル) 「最小リスク」、「バランスリスク」、「待機戦略」 の3つのモードで使用できる Bomber Utility 用の設定ファイル このトレーディング戦略をすぐに導入・設定・開始できる ステップバイステップのビデオマニュアル ご注意: 上記の特典を受け取るには、MQL5のプライベートメッセージシステムを通じて販売者にご連絡ください。 オリジナルのカスタムインジケーター 「Divergence Bomber(ダイバージェンス・ボンバー)」 をご紹介します。これは、MACDのダイバージェンス(乖離)戦略に基づいた 「オールインワン」型のトレーディングシステム です。 このテクニカルインジケーターの主な目的は、価格とMACDインジケーターの間に発生するダイバージェンスを検出 し、将来の価格の動きを示す
まず第一に、この取引インジケーターは再描画されず、再描画されず、遅延しないことを強調する価値があります。これにより、手動取引とロボット取引の両方に理想的なものになります。 ユーザーマニュアル:設定、入力、戦略。 アトミックアナリストは、価格の強さとモメンタムを利用して市場でより良いエッジを見つけるためのPA価格アクションインジケーターです。ノイズや誤ったシグナルを除去し、取引ポテンシャルを高めるための高度なフィルターを備えています。複雑なインジケーターの複数のレイヤーを使用して、アトミックアナリストはチャートをスキャンし、複雑な数学的計算をシンプルなシグナルと色に変換します。これにより、どのような初心者トレーダーでも理解して使用し、一貫した取引の決定を行うことができます。 「アトミックアナリスト」は、新規および経験豊富なトレーダー向けにカスタマイズされた包括的な取引ソリューションです。プレミアムインジケーターとトップノッチの機能を1つの取引戦略に組み合わせ、すべてのタイプのトレーダーにとって汎用性のある選択肢にします。 デイリートレーディングとスキャルピング戦略:高速で正確なデイ
Entry In The Zone and SMC Multi Timeframe は、Smart Money Concepts(SMC)に基づいて開発された リアルタイム市場分析ツール です。 本システムは、トレーダーがマーケットストラクチャーを体系的に分析し、市場全体の方向性をより明確に把握できるよう設計されています。 システムは複数の時間軸にわたり、 反転ポイント(Reversal Points)・主要ゾーン(Key Zones)・マーケットストラクチャー を自動的に解析します。さらに、 POI(Point of Interest)・ノーリペイントシグナル・Auto Fibonacci Levels を表示し、プルバックや反転ポイントを高精度で検出します。 リアルタイムシグナルとアラートにより、価格が主要ゾーンに到達したときや、ゾーン内で反転シグナルが発生した際に、重要な機会を逃すことはありません。 また、本システムは インジケーター と シグナルシステム の両方の機能を兼ね備えた 2-in-1ツール であり、ゾーン分析とリアルタイムエントリーシグナルを一体化しています。 さらに
SuperScalp Pro — 高度なマルチフィルター対応スキャルピングインジケーターシステム SuperScalp Pro は、クラシックな Supertrend と複数のインテリジェントな確認フィルターを組み合わせた高度なスキャルピング用インジケーターシステムです。M1〜H4 のすべての時間足で効率的に機能し、特に XAUUSD、BTCUSD、および主要なFX通貨ペアに適しています。単体のシステムとして、また既存の取引戦略へ柔軟に統合して使用できます。 本インジケーターは 11 以上のフィルターを統合しており、短期・長期の EMA、トレンド判定に用いる 3 本の EMA、EMA スロープ(EMA slope)、RSI、ADX、出来高、VWAP、ボリンジャーバンドのブレイクアウト、MACD ダイバージェンスフィルターなどを含みます。スマートキャンドルフィルターはローソク足の終値を確認して弱いシグナルを排除し、3 本の EMA と MACD ダイバージェンスを組み合わせたトレンド認識メカニズムにより勝率の高いシグナルの選別を支援します。 SuperScalp Pro は ATR に基
FX Power: 通貨の強弱を分析して、より賢い取引を実現 概要 FX Power は主要通貨と金の実際の強弱をあらゆる市場状況で理解するための必須ツールです。強い通貨を買い、弱い通貨を売ることで、 FX Power は取引の意思決定を簡素化し、高い確率の取引機会を見出します。トレンドを追従する場合でも、極端なデルタ値を使用して反転を予測する場合でも、このツールはあなたの取引スタイルに完全に適応します。ただ取引するだけではなく、 FX Power で賢く取引をしましょう。 1. なぜ FX Power がトレーダーにとって非常に有益なのか 通貨と金のリアルタイム強弱分析 • FX Power は主要通貨と金の相対的な強弱を計算し、マーケットダイナミクスに関する明確な洞察を提供します。 • どの資産がリードしているか、または後れを取っているかを監視して、取引するペアを賢く選びましょう。 マルチタイムフレームの包括的なビュー • 短期、中期、長期のタイムフレームで通貨と金の強弱を追跡し、マーケットトレンドに基づいて取引戦略を調整できます。 • スキャルピングからスイングトレード
Azimuth Pro
Ottaviano De Cicco
5 (1)
発売プロモーション Azimuth Proは先着100名様限定で 299ドル でご提供します。最終価格は 499ドル となります。 リテールとインスティテューショナルのエントリーの違いはインジケーターではなく、ロケーションにあります。 多くのトレーダーは、モメンタムを追いかけたり、遅行シグナルに反応して、任意の価格レベルでエントリーします。機関投資家は、需給が実際にシフトする構造的なレベルに価格が到達するのを待ちます。 Azimuth Proはこれらのレベルを自動的にマッピングします:スイングアンカーVWAP、マルチタイムフレーム構造ライン、高確率ロケーションにのみ出現するABCパターン。 Azimuth Proは、構造分析とインテリジェントな自動化の両方を求めるプロフェッショナルトレーダー向けに構築されています。 Azimuthが外科的精度で市場構造をマッピングする一方、Azimuth Proはインテリジェンスレイヤーを追加します:トレーディングスタイルの自動検出、スマート設定された移動平均線、20年のデータでバックテストされた最適化パラメータ。その結果、お使いの銘柄と
Berma Bands
Muhammad Elbermawi
5 (7)
Berma Bands (BBs) インジケーターは、市場のトレンドを特定して活用したいトレーダーにとって貴重なツールです。価格と BBs の関係を分析することで、トレーダーは市場がトレンド段階にあるか、レンジ段階にあるかを判断できます。 詳細については、[ Berma Home Blog ] をご覧ください。 バーマ バンドは、上部バーマ バンド、中部バーマ バンド、下部バーマ バンドの 3 つの異なる線で構成されています。これらの線は価格の周りにプロットされ、全体的な傾向に対する価格の動きを視覚的に表します。これらのバンド間の距離から、ボラティリティや潜在的な傾向の反転についての洞察を得ることができます。 バーマ バンドの線がそれぞれ離れると、市場が横ばいまたはレンジ相場の期間に入っていることを示すことがよくあります。これは、明確な方向性の偏りがないことを示しています。トレーダーは、これらの期間中にトレンドを特定するのが難しいと感じる可能性があり、より明確なトレンドが出現するまで待つ場合があります。 バーマ バンドの線が 1 本の線に収束すると、強いトレンド環境の兆候となること
Gold Sniper Scalper Proは、MetaTrader 5向けのプロフェッショナルなindicatorで、トレーダーがエントリーポイントを特定し、リスクを効果的に管理するために設計されています。 このindicatorは、シグナル検出システム、Entry/SL/TPの自動管理、ボリューム分析、リアルタイムパフォーマンス統計を含む包括的な分析ツールセットを提供します。 システムを理解するためのユーザーガイド   |   他の言語のユーザーガイド 主な機能 シグナル検出システム このindicatorは、price actionと市場構造の分析に基づいて潜在的なエントリーポイントを自動検出します。トレード機会を検出すると: - BUY(青)またはSELL(赤)の矢印がchart上に表示されます - ローソク足が色付けされ、シグナルゾーンが識別されます - Entry/SL/TPレベルが自動計算されます シグナルは価格がEntryレベルに触れた時のみ発動し、市場に確認されていないシグナルをフィルタリングします。 インテリジェントなEntry/SL/TP管理 - Ent
スイングトレーディング は、トレンドの方向のスイングと可能な反転スイングを検出するように設計された最初のインジケーターです。トレーディングの文献で広く説明されているベースラインスイングトレーディングアプローチを使用します。インディケータは、いくつかの価格と時間のベクトルを調査して、全体的なトレンドの方向を追跡し、市場が売られ過ぎまたは買われ過ぎて修正の準備ができている状況を検出します。 [ インストールガイド | 更新ガイド | トラブルシューティング | よくある質問 | すべての製品 ] むち打ちを起こさずに市場スイングの利益 インジケーターは常にトレンドの方向を表示します 色付きの価格帯は機会のベースラインを表します 色付きのダッシュは、可能な反転スイングを表します この指標は、独自の品質とパフォーマンスを分析します 複数時間枠のダッシュボードを実装します カスタマイズ可能なトレンドおよびスイング期間 電子メール/サウンド/プッシュアラートを実装します インジケータは再描画またはバックペインティングではありません Swing Tradingとは Swing Tradingは
優れたテクニカルインジケーター「Grabber」をご紹介します。これは、すぐに使える「オールインワン」トレーディング戦略として機能します。 ひとつのコードに、市場のテクニカル分析ツール、取引シグナル(矢印)、アラート機能、プッシュ通知が強力に統合されています。 このインジケーターを購入された方には、以下の特典を無料で提供します: Grabberユーティリティ:オープンポジションを自動で管理するツール ステップバイステップのビデオマニュアル:インジケーターのインストール、設定、取引方法を解説 カスタムセットファイル:インジケーターをすばやく自動設定し、最大限の成果を出すための設定ファイル 他の戦略はもう忘れてください!Grabberだけが、あなたを新たなトレードの高みへと導いてくれるのです。 Grabber戦略の主な特徴: 推奨タイムフレーム:M5〜H4 対応通貨ペア・資産:どれでも使用可能ですが、私が実際に検証した以下を推奨します(GBPUSD、GBPCAD、GBPCHF、AUDCAD、AUDUSD、AUDSGD、AUDCHF、NZDUSD、NZDCAD、EURCAD、EURUSD、E
Quantum Trend Sniper
Bogdan Ion Puscasu
4.74 (53)
ご紹介   クォンタム トレンド スナイパー インジケーターは 、トレンド反転を特定して取引する方法を変革する画期的な MQL5 インジケーターです。 13年以上の取引経験を持つ経験豊富なトレーダーのチームによって開発されました。     クォンタムトレンドスナイパーインジケーター   は、非常に高い精度でトレンドの反転を識別する革新的な方法で、あなたのトレーディングの旅を新たな高みに押し上げるように設計されています。 ***Quantum Trend Sniper Indicatorを購入すると、Quantum Breakout Indicatorを無料で入手できます!*** クォンタム ブレイクアウト インジケーターは、トレンドの反転を特定するとアラートを発し、矢印を示し、3 つのテイクプロフィットレベルを提案します。 初心者トレーダーにもプロのトレーダーにも適しています。 量子EAチャネル:       ここをクリック MT4のバージョン:       ここをクリック 推奨事項: 期間:すべての時間枠。最良の結果を得るには、M15、M30、H1 のタイムフ
Super Signal – Skyblade Edition プロ仕様のノンリペイント / ノーラグ・トレンドシグナルシステム。卓越した勝率を実現 | MT4 / MT5 対応 1分足、5分足、15分足などの低い時間足で最も効果を発揮します。 主な特徴: Super Signal – Skyblade Edition は、トレンド取引に特化したスマートなシグナルシステムです。マルチレイヤーのフィルターロジックを用いて、明確な方向性と実際のモメンタムに支えられた強力なトレンドのみを検出します。 このシステムは 天井や底を予測するものではありません 。次の3つの条件がすべて満たされた場合にのみシグナルを発生させます: 明確なトレンド方向 モメンタムの増加 健全なボラティリティ構造 市場セッションに基づく流動性分析と組み合わせることで、シグナルの精度とタイミングがさらに向上します。 シグナルの特性: すべての矢印シグナルは 100% 非リペイント / 遅延なし 一度出現したシグナルは固定され、点滅・消失しません チャート上の矢印、情報パネル、ポップアップ通知、音声アラート、プッシュ通知
現在33%オフ 初心者にもエキスパートトレーダーにも最適なソリューション このインジケーターは独自の機能と新しい公式を多数内蔵しており、ユニークで高品質かつ手頃な取引ツールです。このアップデートでは、2つの時間枠ゾーンを表示できるようになります。より長いTFだけでなく、チャートTFとより長いTF(ネストゾーンを表示)の両方を表示できます。すべてのSupply Demandトレーダーの皆さんのお気に召すはずです。:) 重要情報の公開 Advanced Supply Demandの可能性を最大化するには、 https://www.mql5.com/ja/blogs/post/720245 にアクセスしてください。   エントリーまたはターゲットの正確なトリガーポイントを正確に特定できれば取引がどのように改善されるか想像してみてください。新しい基盤となるアルゴリズムに基づいて構築されているため、買い手と売り手の間の潜在的な不均衡をさらに簡単に特定できます。これは、最も強い需要と供給のゾーンと、過去のパフォーマンス(古いゾーンを表示)がグラフィカルに表現されるためです。これらの機能は、最適な
The Trend Forecaster indicator utilizes a unique proprietary algorithm to determine entry points for a breakout trading strategy. The indicator identifies price clusters, analyzes price movement near levels, and provides a signal when the price breaks through a level. The Trend Forecaster indicator is suitable for all financial assets, including currencies (Forex), metals, stocks, indices, and cryptocurrencies. You can also adjust the indicator to work on any time frames, although it is recommen
TPSproTrend PRO は、市場が実際に方向転換する瞬間を識別し、動きの開始時にエントリー ポイントを形成します。 価格が動き始めた直後に市場に参入し、すでに動き出した後に参入してはいけません。 インジケーター   シグナルを再描画せず、エントリーポイント、ストップロス、テイクプロフィットを自動的に表示するため、取引が明確かつ視覚的かつ構造化されます。 説明書 RUS   -   MT4 バージョン 主な利点 再描画のない信号。 すべての信号は固定です。 矢印が表示された場合 -     もう変化したり消えたりすることはありません。 誤ったシグナルのリスクなしに、安定したデータに基づいて取引の決定を下すことができます。 既製の買い/売りエントリーポイント このインジケーターは、取引を開始するのに最適なタイミングを自動的に決定し、チャート上に矢印で表示します。 推測や主観的な分析は不要。明確なシグナルだけです。 自動ストップロスとテイクプロフィットゾーン 信号の直後に次のものが表示されます: エントリーポイント リスク制限ゾーン(ストップロス) 利益確定ゾーン これにより、
これはほぼ間違いなく、MetaTraderプラットフォームで見つけることができる最も完全な調和価格形成自動認識インジケーターです。 19種類のパターンを検出し、フィボナッチプロジェクションをあなたと同じように真剣に受け止め、潜在的逆転ゾーン(PRZ)を表示し、適切なストップロスとテイクプロフィットレベルを見つけます。 [ インストールガイド | 更新ガイド | トラブルシューティング | よくある質問 | すべての製品 ] 19の異なる調和価格形成を検出します プライマリ、派生および補完フィボナッチ投影(PRZ)をプロットします 過去の価格行動を評価し、過去のすべてのパターンを表示します この指標は、独自の品質とパフォーマンスを分析します 適切なストップロスとテイクプロフィットのレベルを表示します ブレイクアウトを使用して適切な取引を通知します すべてのパターン比をグラフにプロットします 電子メール/音声/視覚アラートを実装します スコット・M・カーニーの本に着想を得て、この指標は最も純粋で急を要するトレーダーのニーズを満たすように設計されています。ただし、トレードを容易にする
無料の AUX インジケーターと EA サポ   直接ダウンロード — ここをクリック [ D.I.C.E ] The DICE Indicator Divergence in Chaos Environment は、エリオット波動理論とトレーディングカオス手法を組み合わせて使用するトレーダーのために設計された MT5 専用ツールです。価格変動の中の隠れたおよび通常のダイバージェンスを検出し、ビル・ウィリアムズが説明したカオス市場環境と同期します。 主な特徴 エリオット波動に対応したダイバージェンス検出:波動構造と調和した強気・弱気ダイバージェンスを識別。 カオス手法の統合:AO(オーサムオシレーター)と市場構造に整合。 マルチタイムフレームスキャン:異なる時間枠でダイバージェンスを分析し、トレンドの転換を確認。 視覚的アラートとオブジェクト:チャート上の矢印、ライン、マーカーで即座に識別。 市場適応読解:カオス的状況に自動適応し、ノイズを除去して有効なセットアップを維持。 ブレイクプルバックエントリー手法:シンプルなフィボナッチリトレースメントとピボットポイントを使用。 利点 ダイ
Trend Ai indicatorは、トレンドの識別と実用的なエントリポイントと反転アラートを組み合わせることで、トレーダーの市場分析を強化する優れたツールです。 この指標は、ユーザーが自信と正確さで外国為替市場の複雑さをナビゲートすることを可能にします トレンドAiインジケーターは、主要なシグナル以外にも、プルバックやリトレースメント中に発生するセカンダリエントリポイントを識別し、トレーダーが確立されたトレンド内の価格修正を活用できるようにします。 重要な利点: *MT4およびMT5の仕事 *明確な買いまたは売りシグナル *再描画しません ·すべての資産で動作します 私はeaやセットをtelegram it詐欺で販売しないように注意してください。 すべての設定はここでブログで無料です。  重要! 指示とボーナスを得るために購入後すぐに私に連絡してください! 私の他のプロダクトと同様、実質操作の監視はここに見つけることができます: https://www.mql5.com/en/users/mechanic/seller&nbsp ; 設定および入力: すべての
Golden Spike Premium
Kwaku Bondzie Ghartey
5 (1)
Golden Spikes Indicator Technical indicator for synthetic indices trading on M1 timeframe. Compatible with Boom/Crash indices on Deriv platform and Gain/Pain indices on Weltrade platform. send me A private  message to receive trade ASISTANT EA.. booklet guide:  https://drive.google.com/file/d/1knQJqGHZSP5eQN24ndRz2ayZVCst6XhN/view?usp=sharing Also check my premium spikes bot: https://www.mql5.com/en/market/product/142350 Features Uses Parabolic SAR, RSI, and Bollinger Bands analysis Three risk
Was: $299  Now: $99  Supply Demand uses previous price action to identify potential imbalances between buyers and sellers. The key is to identify the better odds zones, not just the untouched ones. Blahtech Supply Demand indicator delivers functionality previously unavailable on any trading platform. This 4-in-1 indicator not only highlights the higher probability zones using a multi-criteria strength engine, but also combines it with multi-timeframe trend analysis, previously confirmed swings a
ARIPoint
Temirlan Kdyrkhan
1 (1)
ARIPoint is a powerful trading companion designed to generate high-probability entry signals with dynamic TP/SL/DP levels based on volatility. Built-in performance tracking shows win/loss stats, PP1/PP2 hits, and success rates all updated live. Key Features: Buy/Sell signals with adaptive volatility bands Real-time TP/SL/DP levels based on ATR Built-in MA Filter with optional ATR/StdDev volatility Performance stats panel (Success, Profit/Loss, PP1/PP2) Alerts via popup, sound, push, or email Cu
まず第一に、この取引ツールはノンリペイント、ノンリドロー、ノンラグの指標であり、プロの取引に理想的ですことを強調する価値があります。 オンラインコース、ユーザーマニュアル、デモ。 スマートプライスアクションコンセプトインジケーターは、新米から経験豊富なトレーダーまで、非常 に強力なツールです。Inner Circle Trader AnalysisやSmart Money Concepts Trading Strategiesなど、20以上の有用な指標を1つに組み合わせています。このインジケーターはスマートマネーコンセプトに焦点を当て、大手機関の取引方法を提供し、彼らの動きを予測するのに役立ちます。 特に、流動性分析に優れており、機関がどのように取引しているかを理解しやすくしています。市場のトレンドを予測し、価格の動きを慎重に分析するのに優れています。機関の戦略とトレードを合わせることで、市場の動向についてより正確な予測ができます。このインジケーターは多目的であり、市場構造を分析し、重要な注文ブロックを特定し、さまざまなパターンを認識するのに優れています。 このインジケーター
FX Volume MT5
Daniel Stein
4.79 (24)
FX Volume:ブローカー視点で捉える本物の市場センチメント クイック概要 トレード手法をさらに高めたいとお考えですか? FX Volume は、リテールトレーダーやブローカーのポジション状況をリアルタイムで提供します。これは、COTのような遅延レポートよりもはるかに早く知ることができます。安定した利益を目指す方も、さらなる優位性を求める方も、 FX Volume は大きな不均衡を見極め、ブレイクアウトを確認し、リスク管理を洗練させるのに役立ちます。今すぐ始めて、実際の出来高データがどのように意思決定を変革するかを体感してください! 1. FX Volume がトレーダーにとって非常に有益な理由 高精度の早期警戒シグナル • 各通貨ペアを売買しているトレーダー数を、他者よりも早く、ほぼリアルタイムで把握できます。 • FX Volume は、複数のリテールブローカーから得られる本物の出来高データを収集し、分かりやすい形式で提供する 唯一 のツールです。 強力なリスク管理 • ロングやショートの大きな偏り(インバランス)を特定し、潜在的なトレンド転換を見逃しません。ストップ
Gartley Hunter Multi - An indicator for searching for harmonic patterns simultaneously on dozens of trading instruments and on all possible timeframes. Manual (Be sure to read before purchasing) | Version for MT4 Advantages 1. Patterns: Gartley, Butterfly, Shark, Crab. Bat, Alternate Bat, Deep Crab, Cypher 2. Simultaneous search for patterns on dozens of trading instruments and on all possible timeframes 3. Search for patterns of all possible sizes. From the smallest to the largest 4. All fou
Was: $249  Now: $99   Market Profile defines a number of day types that can help the trader to determine market behaviour. A key feature is the Value Area, representing the range of price action where 70% of trading took place. Understanding the Value Area can give traders valuable insight into market direction and establish the higher odds trade. It is an excellent addition to any system you may be using. Inspired by Jim Dalton’s book “Mind Over Markets”, this indicator is designed to suit the
Quantum TrendPulse を ご紹介します。これは、   SuperTrend   、   RSI   、および Stochastic のパワーを 1 つの包括的なインジケーターに組み合わせて、取引の可能性を最大限に引き出す究極の取引ツールです。精度と効率を求めるトレーダー向けに設計されたこのインジケーターは、市場のトレンド、勢いの変化、最適なエントリー ポイントとエグジット ポイントを自信を持って特定するのに役立ちます。 主な特徴: SuperTrend 統合: 現在の市場動向に簡単に追従し、収益性の波に乗ることができます。 RSI精度: 買われすぎと売られすぎのレベルを検出し、市場の反転のタイミングに最適で、SuperTrendのフィルターとして使用されます。 確率的精度: 確率的振動を活用して、変動の激しい市場で隠れたチャンスを見つけます。SuperTrend のフィルターとして使用されます。 マルチタイムフレーム分析:   M5 から H1 または H4 まで、さまざまなタイムフレームで市場を常に把握します。 カスタマイズ可能なアラート: カスタム取引条件が満たされ
MetaForecast M5
Vahidreza Heidar Gholami
5 (3)
MetaForecastは、価格データのハーモニクスに基づいて、どんな市場の未来を予測し視覚化します。市場が常に予測可能ではありませんが、価格にパターンがある場合、MetaForecastは可能な限り正確な未来を予測できます。他の類似製品と比較して、MetaForecastは市場のトレンドを分析することでより正確な結果を生成することができます。 入力パラメータ Past size (過去のサイズ) MetaForecastが将来の予測を生成するために使用するバーの数を指定します。モデルは選択したバー上に描かれた黄色の線で表されます。 Future size (将来のサイズ) 予測すべき将来のバーの数を指定します。予測された将来は、ピンクの線で表示され、その上に青い回帰線が描かれます。 Degree (程度) この入力は、MetaForecastが市場で行う分析のレベルを決定します。 Degree 説明  0 Degree 0の場合、価格の全てのピークや谷、そして詳細をカバーするために、「Past size」の入力に大きな値を使用することが推奨されています。  1 (推奨) Degre
CRT Liquidity Pro
Juan Pablo Castro Forero
5 (1)
次のトレードが心配ですか?戦略が本当に機能しているのか分からないことに疲れましたか? CRT Liquidity Proを使えば、感情ではなく実際の統計データでトレードできます。確率を知り、パフォーマンスを追跡し、「3の力」、スマートな流動性検出、CRT確認に基づいて自信を持ってトレードできます。 CRT Liquidity戦略の現実を見たいですか?購入後、 お問い合わせください 、他の製品を1つ無料で提供します。 他の製品をチェック して、さらに実際の戦略を確認し、 Real Tradesコミュニティに参加 して、自信を持ってトレードし、本物のトレーダーとつながりましょう! CRT Liquidity Proを使う理由: スマート流動性検出 – 前のセッション、日次、週次、月次のレベルから流動性ゾーンを自動的に検出します。 「3の力」(PO3)統合 – より高い時間枠の現在のキャンドルを確認し、リアルタイムで主要なトレンドを簡単に見ることができます。市場が蓄積、操作、拡大の準備をしているタイミングを知ることができます。 精密な流動性シグナル – 最大3つのテイクプロフィットとストッ
無料のAUXインジケーター、EAサポート、完全ガイドをご利用ください – https://www.mql5.com/en/blogs/post/763955 トレンドを見極める。パターンを読む。エントリーのタイミングを掴む。 30秒以内の3ステップ!分析不要で簡単トレード — あなたのスマートアシスタントがワークフローを簡素化します チャートの過剰な情報にもう悩まされない。 スマートバイアス検出で自信を持ってトレード。 すべての通貨、暗号資産、株式、金属、指数、あらゆる時間足に対応。 クリックして実行するだけ — それだけで十分。 スピードと明快さを求める忙しいトレーダーに最適。 TPTSyncXは、 トレンド、パターン、 ローソク足のトリガー 分析を、洗練されたインテリジェントなビジュアルシステムとしてシームレスに統合する、強力なオールインワンMetaTrader 5インジケーターです。明確さ、正確さ、スピードを求めるトレーダー向けに設計されており、プライスアクション、構造的パターン、市場タイミングツールを組み合わせて、高確率のトレードセットアップを特定するのに役立ちます。 主な
作者のその他のプロダクト
The trading system utilizes a real breakout strategy with an intelligent calculation engine to eliminate bad signals. The EA has only been developed and optimized for EURUSD H15. We recommend choosing a broker with a fixed spread of 5 to 20 points, with a zero STOPLEVEL and five-digit quotes. You can change the settings and try other pairs for better results. Trades are always protected with STOPLOSS, Smart Trailing and Breakeven. This EA is very easy to use. No grid No martingale МetaТrader 5 v
EA Skynet
Ruslan Pishun
2.93 (14)
This is a fully automated smart adaptive algorithm. The SKYNET system calculates the history data and performs the analysis based on the probability percentage of where the upcoming breakout of the support and resistance level will take place, and places pending orders. The Expert Advisor adapts to any market conditions. It was backtested and optimized using real ticks with 99,9% quality. It has successfully completed stress testing. The EA contains the algorithm of statistics collection with ou
This is a classical trading strategy, which falls into the category of breakout systems. They form support and resistance levels, which temporarily limit further price movement. When the price breaks down the support level or breaks up the resistance level, there emerges a strong momentum in the breakout direction, which allows to make profit on strong price movements with moderate risk. To create the strategy, we used historical data with the quality of history of 99.9%. It uses filtration of
The Expert Advisor uses the strategy based on the breakdown of the most important support and resistance levels. Adaptive trade trailing algorithm is used. The EA uses a very small SL so the account is always protected from equity drawdown with a very low risk-per-trade. The EA integrates a system of partial position closure during slippages (can be configured). It was backtested and optimized using real ticks with 99,9% quality. It has successfully completed stress testing. The EA contains the
This unique indicator automatically builds Wolfe Waves and features a highly efficient trading strategy.   Use If number 5 appears, wait till the first candle is closed behind Moving Average, then look at the three center lines showing what lot volume should be used if the fifth dot crossed the line 25%. The candle is closed behind Moving Average, and then we open a trade with the lot: = (Let's apply the lot of, say, (0.40), divide it into four parts and open a quarter of the lot (0.10)). If the
EA Skynet MT5
Ruslan Pishun
2.25 (4)
This is a fully automated smart adaptive algorithm. The  SKYNET  system calculates the history data and performs the analysis based on the probability percentage of where the upcoming breakout of the support and resistance level will take place, and places pending orders. The Expert Advisor adapts to any market conditions. It was backtested and optimized using real ticks with 99,9% quality. It has successfully completed stress testing. The EA contains the algorithm of statistics collection with
The indicator automatically draws Wolfe waves. The indicator uses Wolfe waves found in three timeframes. This indicator is especially accurate because it waits for a breakout in the wave direction before signaling the trade. Recommended timeframe: М1. Indicator features Amazingly easy to trade. The indicator is able to recognize all the patterns of Wolfe waves in the specified period interval. It is a check of potential points 1,2,3,4,5 on every top, not only the tops of the zigzag. Finds the p
The draws trend lines with adjustable trend width, with trend breakout settings and notifications of trend breakout (Alert, Sound, Email) and of a new appeared arrow. Arrows point at the direction of the order to open (BUY, SELL). Parameters MaxHistoryBars - the number of bars in the history. Depth (0 = automatic settings) - Search area. width trend ( 0 = automatic settings) - Trend width. (true = closed bars on direction trend),(false = just closed bars for line) - true = closure of candlestic
The indicator colors bullish, bearish and doji candles. Also, the amount of candles (bullish, bearish and doji) for the last N days is calculated. You can select colors for both bodies and shadows of candles. You can also enable coloring only candle bodies. МetaТrader 5 version:  https://www.mql5.com/en/market/product/11649 Parameters color bulls = color of bullish candle bodies color shadow bulls = color of bullish candle shadows color bears = color of bearish candle bodies color shadow bears =
'Info body and shadow candles' indicator colors the candle bodies and shadows according to the settings. For example, if the 'Size body candles' parameter is 10, the indicator looks for the candles having a body size of 10 or more. Candle shadows are calculated the same way. Detected candles can be colored (body color, shadow color). The indicator can be adjusted for both four- and five-digit quotes. МetaТrader 5 version:  https://www.mql5.com/en/market/product/12977 Parameters Use candle search
This unique indicator automatically builds Wolfe Waves. Features Finds the points and builds the lines automatically. Efficient trading strategy. No redraws, no lags. The indicator relaunch button is located directly on the chart. The indicator has multiple configurable parameters. Use If number 5 appears, wait till the first candle is closed behind Moving Average, then look at the three center lines showing what lot volume should be used if the fifth dot crossed the line 25%. The candle is cl
The Trend modified indicator draws trend lines with adjustable trend width, with trend breakout settings and notifications of trend breakout (Alert, Sound, Email) and of a new appeared arrow. Arrows point at the direction of the order to open (BUY, SELL). Parameters User Bars - the number of bars for calculations. Depth (0 = automatic settings) - Search area (0 = automatic adjustment). width trend ( 0 = automatic settings) - Trend width (0 = automatic adjustment). (true = closed bars on directi
We present our totally unique Expert Advisor "Expert trend one point": the EA trades within a trend, it contains a complex strategy (named "one point profit"), does not use stop loss, does not use an adjustable take profit, it adjusts the take profit per one point of profit. The EA works with four or five-digit prices. You can use the Expert Advisor on any currency pairs, however it is recommended to choose symbols with low spread and low stop levels. The EA can work on timeframes M1 , M5, M15,
Wolfe waves ultra draws Wolfe Waves automatically. The indicator searches for the Wolfe Waves on three timeframes. This indicator is especially accurate because it waits for a breakout in the wave direction before signaling the trade, resulting in a very high winning ratio. Features Amazingly easy to trade. The indicator is able to recognize all Wolfe Wave patterns in a specified interval. Thus, we check each extremum for the potential 1,2,3,4,5 points apart from ZigZag vertices. The indicator
The EA opens orders using the Wolfe waves indicator, also uses the Martingale and smart Trailing Stop, Stop Loss and Take Profit. Trades are always protected with STOPLOSS, Smart Trailing and Breakeven. This EA is easy to use. The EA has proven results on EURUSD M5, however you can change the settings for better results on other currencies. Settings Setting EA - Settings of the Advisor. Invest More - at the value 'true' the lot size increases as the account balance grows.( Risk Management ). In
This indicator shows the time before the new bar or candle opens. Examples of how much is left before a new bar opens: An example for the M1 timeframe: 05 = 05 seconds. An example for the H1 timeframe: 56:05 = 56 minutes and 05 seconds. An example for the D1 timeframe: 12:56:05 = 12 hours, 56 minutes and 05 seconds. An example for the W1 timeframe: W1(06): 12:56:05 = 6 days, 12 hours, 56 minutes and 05 seconds. МetaТrader 5 version:  https://www.mql5.com/en/market/product/13602 Settings color_ti
The SCRIPT opens , modifies , and deletes all types of orders: BUY, SELL, BUYLIMIT, SELLLIMIT, BUYSTOP, and SELLSTOP. Features Orders can be opened both by comments and magic. Order grids. Take profit and stop loss modification. Orders can be removed by type, magic, and comments. Market orders are deleted if magic = 0. Notification window appears after orders are opened, modified or removed. Multi-task script. Modification is performed after opening orders. Parameters Orders_Tip - consists of
EA Alex
Ruslan Pishun
1.8 (5)
The Expert Advisor contains multiple trading strategies, including news trading, use of indicators, price velocity and various built-in filters. The EA places pending orders. It has successfully completed stress testing. No Martingale No Arbitrage No any other risky strategy inside No scalping Working currency pair/timeframe: EURUSD H1. Optimized. You can adjust the Expert Advisor to any currency pair! Key Features: It can work with a small deposit. Only pending orders. Every trade has a tight
This is an innovative intelligent system consisting of 4 strategies, which detects high-probability entries for price action breakouts on the H1 timeframe. The Expert Advisor includes 3 complex technical strategies and a scalping strategy. The Expert Advisor is fully optimized and ready to use! It is possible to disable each strategy or use them all together. The EA uses a very small SL so the account is always protected from equity drawdown with a very low risk-per-trade. The potential accumula
EA Innovative PRO is a fully automated EA for Forex trading. It is based on three combined adaptive algorithms. Follows the movement of market price. It was backtested and optimized using real ticks with 99,9% quality. The Expert Advisor has successfully passed the stress test with slippage and commission approximate to the real market conditions. The EA eliminates the extra noise and chooses the most convenient strategy for trading. Dynamically places trailing stop and moves profit to breakeven
Chappie is a smart adaptable robot, Chappie trades based on multiple trading systems using pending orders, the robot manipulates the pending orders, following the price movement of the market and calculates the price movement for the most accurate market entry. Basic EA settings are calculated for EURUSD. Over 1000 tests have been performed on real and history data with 99.9% quality. Chappie is a result of a long term development. The main idea is to preserve capital through unexpected fluctuat
EA Two MA
Ruslan Pishun
5 (1)
The Expert Advisor trades by two Moving Average lines. There are also two types of order closing: 1) if there is an opposite signal, 2) closing order by take profit, stop loss, and trailing stop. You can configure Moving Average indicators. Key Advantages Ability to work with fixed lot and MM. Six trailing stop modifications. Easy to use. Two types of order closing. The EA works with all brokers. Parameters General Order Type – trade directions. Use_Risk_MM – if true , lot size is increased wh
Two Dragon is an advanced indicator for identifying trends, which uses complex mathematical algorithms. It works in any timeframe and symbol. Indicator is designed with the possibility to customize all the parameters according to your requirements. Any feature can be enabled or disabled. When a Buy / Sell trend changes the indicator will notify using notification: Alert, Sound signal, Email, Push. МetaТrader 5 version:  https://www.mql5.com/en/market/product/14906   Parameters Max_Bars_History —
EA Red Dragon
Ruslan Pishun
2.13 (8)
The Expert Advisor uses the strategy based on the breakdown of the most important support and resistance levels. Adaptive trade trailing algorithm is used. The EA uses a very small SL so the account is always protected from equity drawdown with a very low risk-per-trade. The EA integrates a system of partial position closure during slippages (can be configured). It was backtested and optimized using real ticks with 99,9% quality. It has successfully completed stress testing. The EA contains the
Neon System N1 PRO is along-term system containing 10 different strategies. Each strategy includes multiple indicators, the system is designed for real trading. The system uses 50 standard indicators, the robot contains 10 strategies. This system is not for those "who want everything at once." This system assumes a professional long-term trading on the Forex market. The robot has been tested in a special tester on real ticks. It uses an adaptive trailing stop algorithm. The EA uses a system of c
The EA uses the strategy based on breakout. Breakout trading is one of the most popular and most frequently used strategies among Forex traders. This strategy has been developed a long ago and has been repeatedly tested on history data, showing superior results. The EA uses 3 types of trend breakouts, (support and resistance breakout, downtrend breakout, uptrend breakout). The EA uses a very small SL so the account is always protected from equity drawdown with a very low risk-per-trade. It uses
Ultimatum Breakout - this trading system uses the strategy of valid breakouts, using multiple custom indicators for eliminating bad signals. The EA uses a very small SL so the account is always protected from equity drawdown with a very low risk-per-trade. The EA is fully adapted: calculates the spread — for pending orders, stop loss, trailing stop, breakeven. It was backtested and optimized using real ticks with 99,9% quality. It has successfully completed stress testing. No Martingale. No arbi
EA Gideon
Ruslan Pishun
5 (1)
The EA Gideon is an Expert Advisor that trades ON NEWS and ON EVENTS that have a strong influence on the market, but do not occur regularly! That is the EA opens Sell Stop and Buy Stop pending orders in case of a sudden price change in any direction and closes them automatically with the profit that you wish. And we all know how often the price changes when a "successful" news appears, how far it can go up or down. Also, this robot protects your deposit by placing SL with customizable parameters
EA Manager
Ruslan Pishun
3 (2)
The Expert Advisor uses a strategy based on breakthrough and two additional strategies based on sharp price changes. You can adjust the slope of the breakthrough, the distance between the breakthrough levels and the number of breakthrough levels. The Expert Advisor itself marks the levels that should be broken through. The EA includes two strategies based on sharp price changes: that is the EA opens pending Sell Stop and Buy Stop orders in case of a sudden price change in any direction and close
EA Morpheus
Ruslan Pishun
2.42 (12)
Breakout based strategy, generates market entry signals when the price crosses a border of a certain price range. To create the strategy, we have used the history data with 99,9% quality for the last 15 years. The best signals had been selected and the false signals have been filtered out. The Expert Advisor performs technical analysis and considers only the breakouts that show the best result. It uses a system of filtering false signals. The EA uses adaptive trailing stop. The EA uses a very
フィルタ:
Agbakeleke Idowu
719
Agbakeleke Idowu 2022.12.16 17:20 
 

Not Satisfied after over 3 months of used. Waste of money. Don't waste your money

Ruslan Pishun
38768
開発者からの返信 Ruslan Pishun 2022.12.16 20:26
Hi,
Perhaps you just didn't understand this wonderful indicator.
レビューに返信