Range Predictor MT5

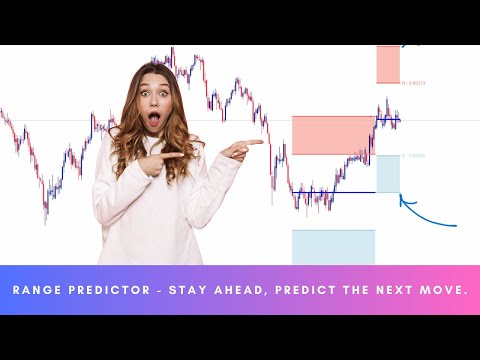
Introducing the Range Predictor: Your Ultimate Guide to Future Trading Ranges! 🚀

Imagine having the power to see into the future of market moves—Range Predictor brings this dream to life. Designed to deliver real-time, predictive support and resistance levels, this tool goes beyond standard indicators, offering trend direction insights and precise range forecasts. Whether you're a day trader or a swing trader, the Range Predictor is your all-in-one toolkit for mastering the markets.

Why Traders Love the Range Predictor

Initially a legacy tool, the Range Predictor gained such a devoted following that it’s now back and better than ever! Its ability to accurately forecast price reversals and pinpoint trend shifts has made it a must-have for traders seeking to stay ahead of the competition.

Here's why it’s a game-changer:

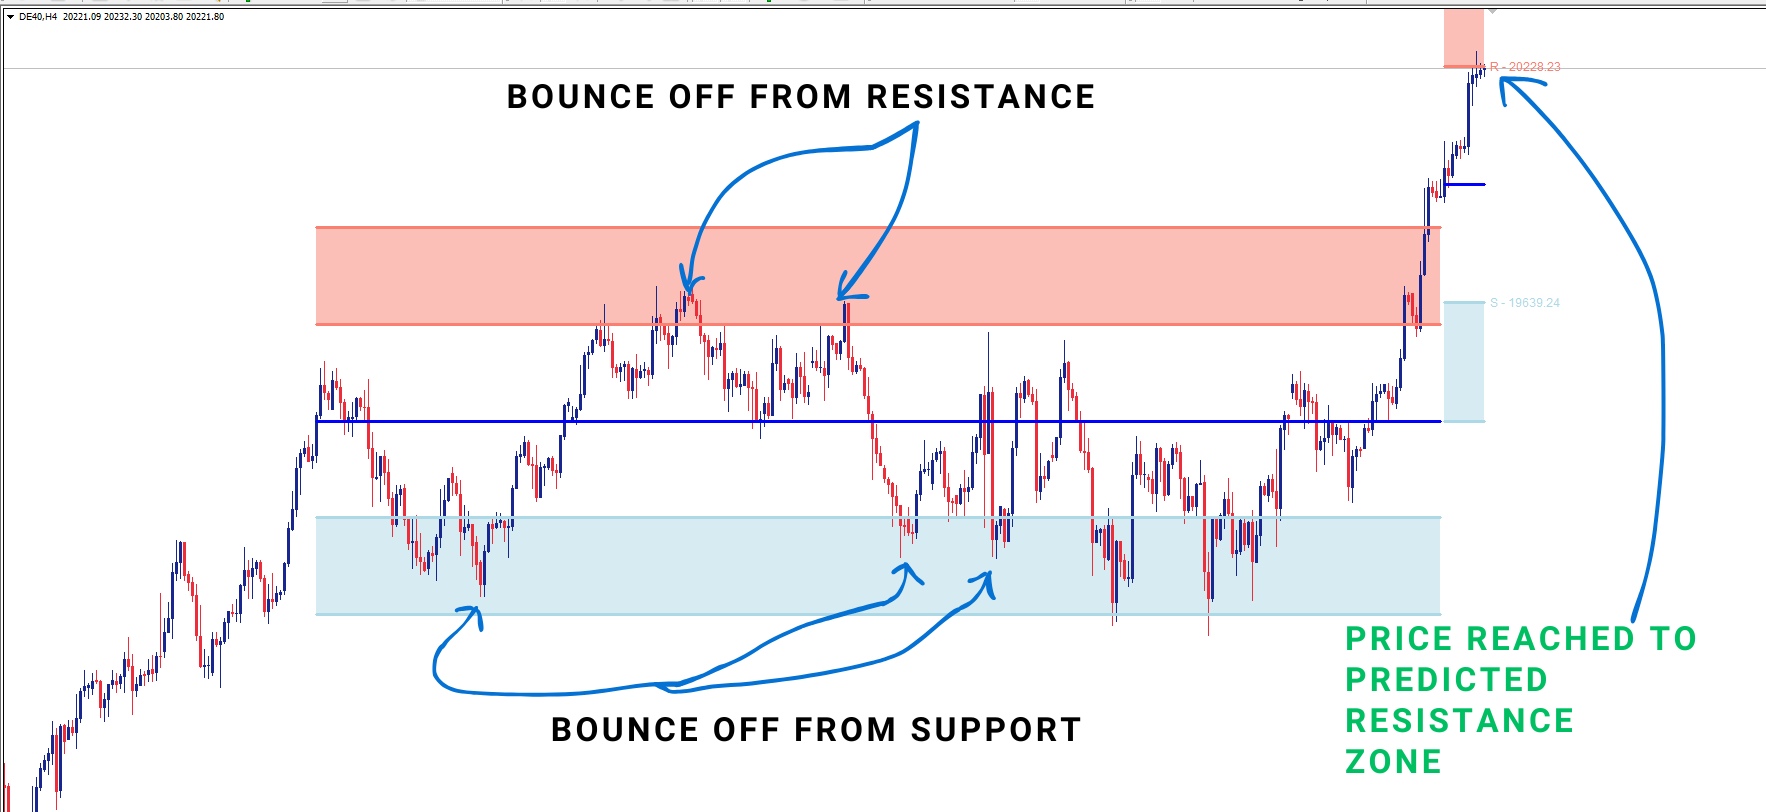
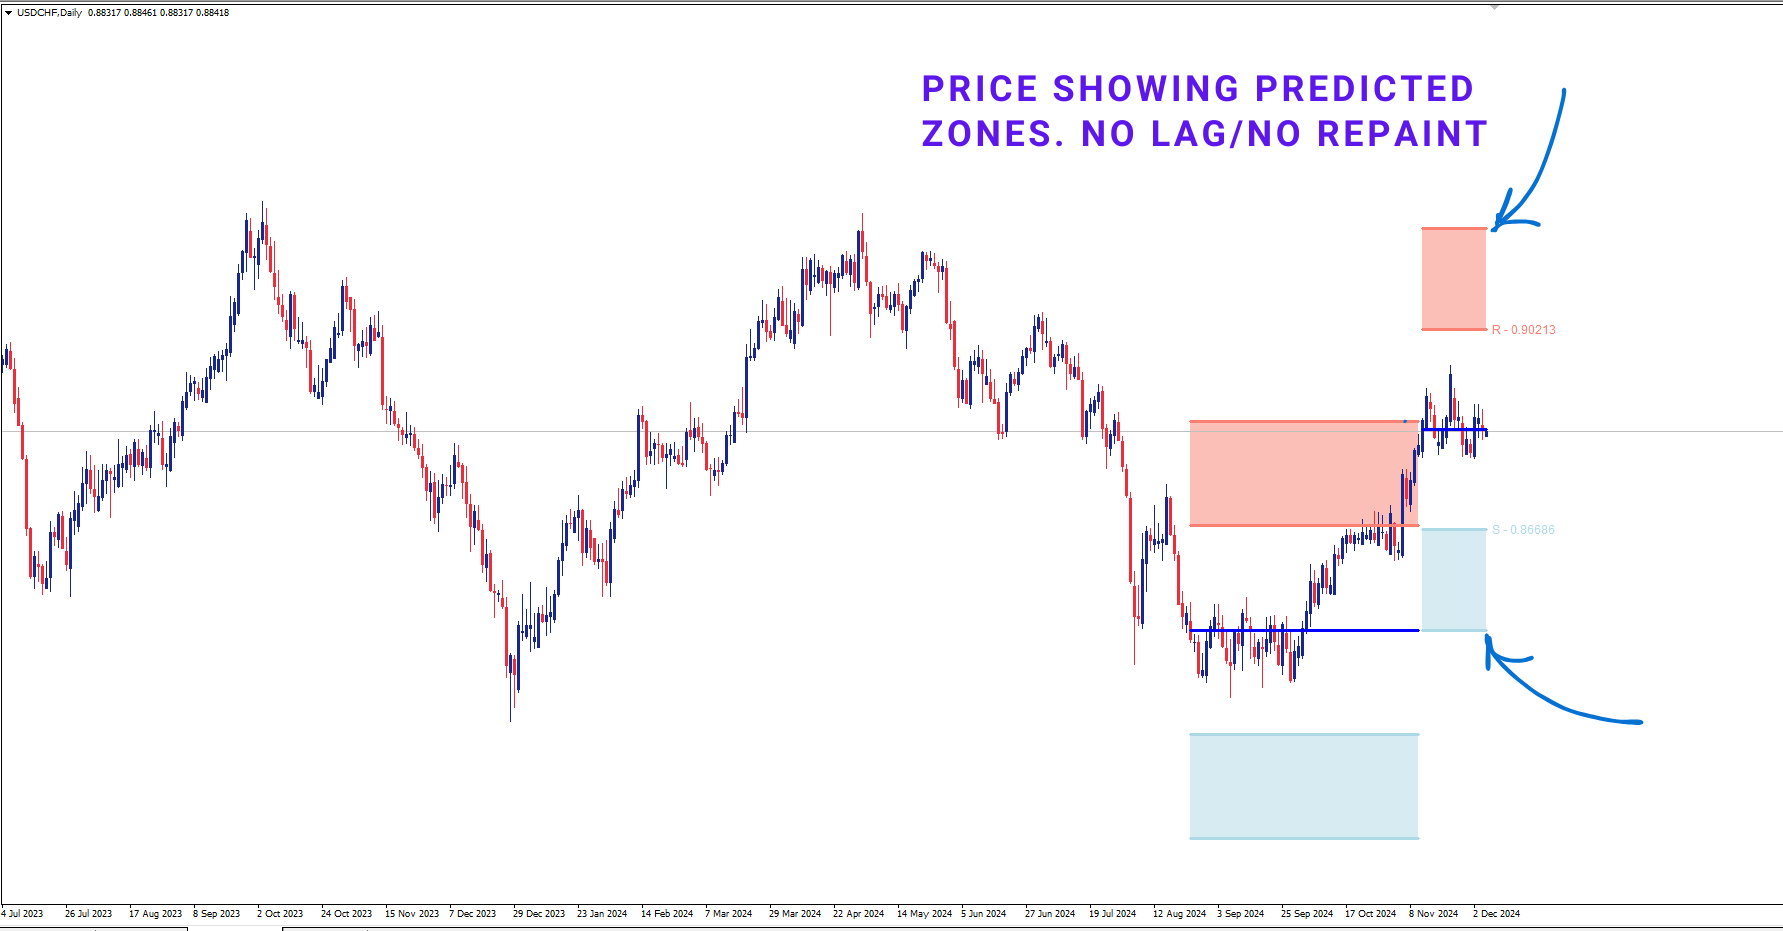
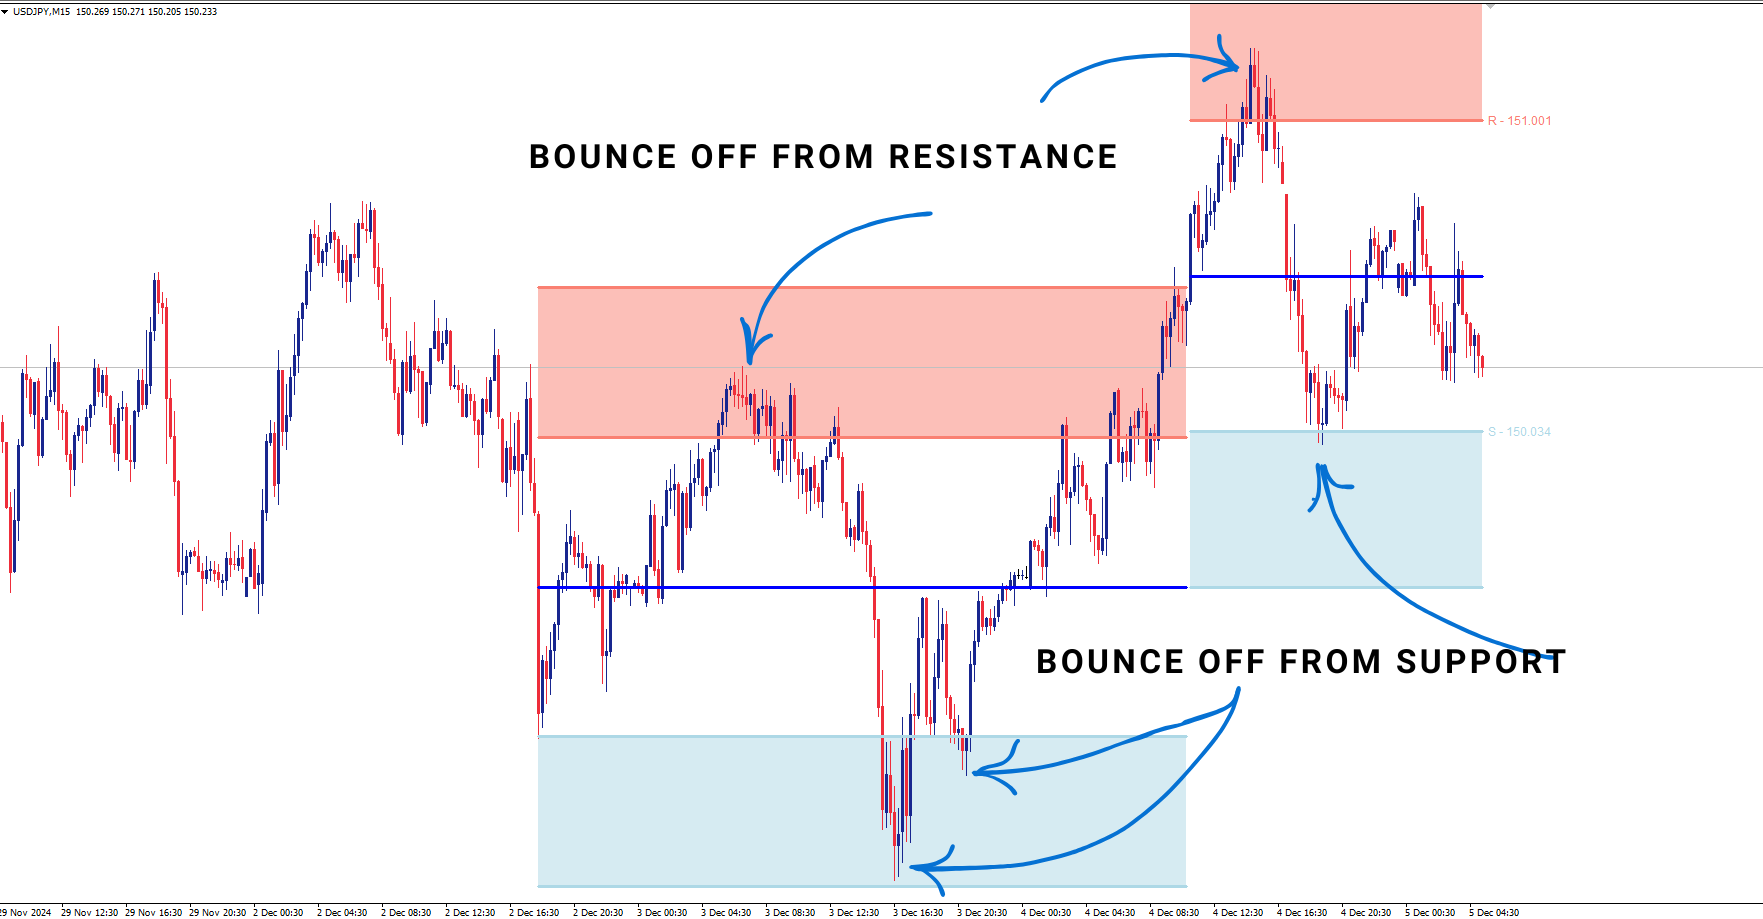
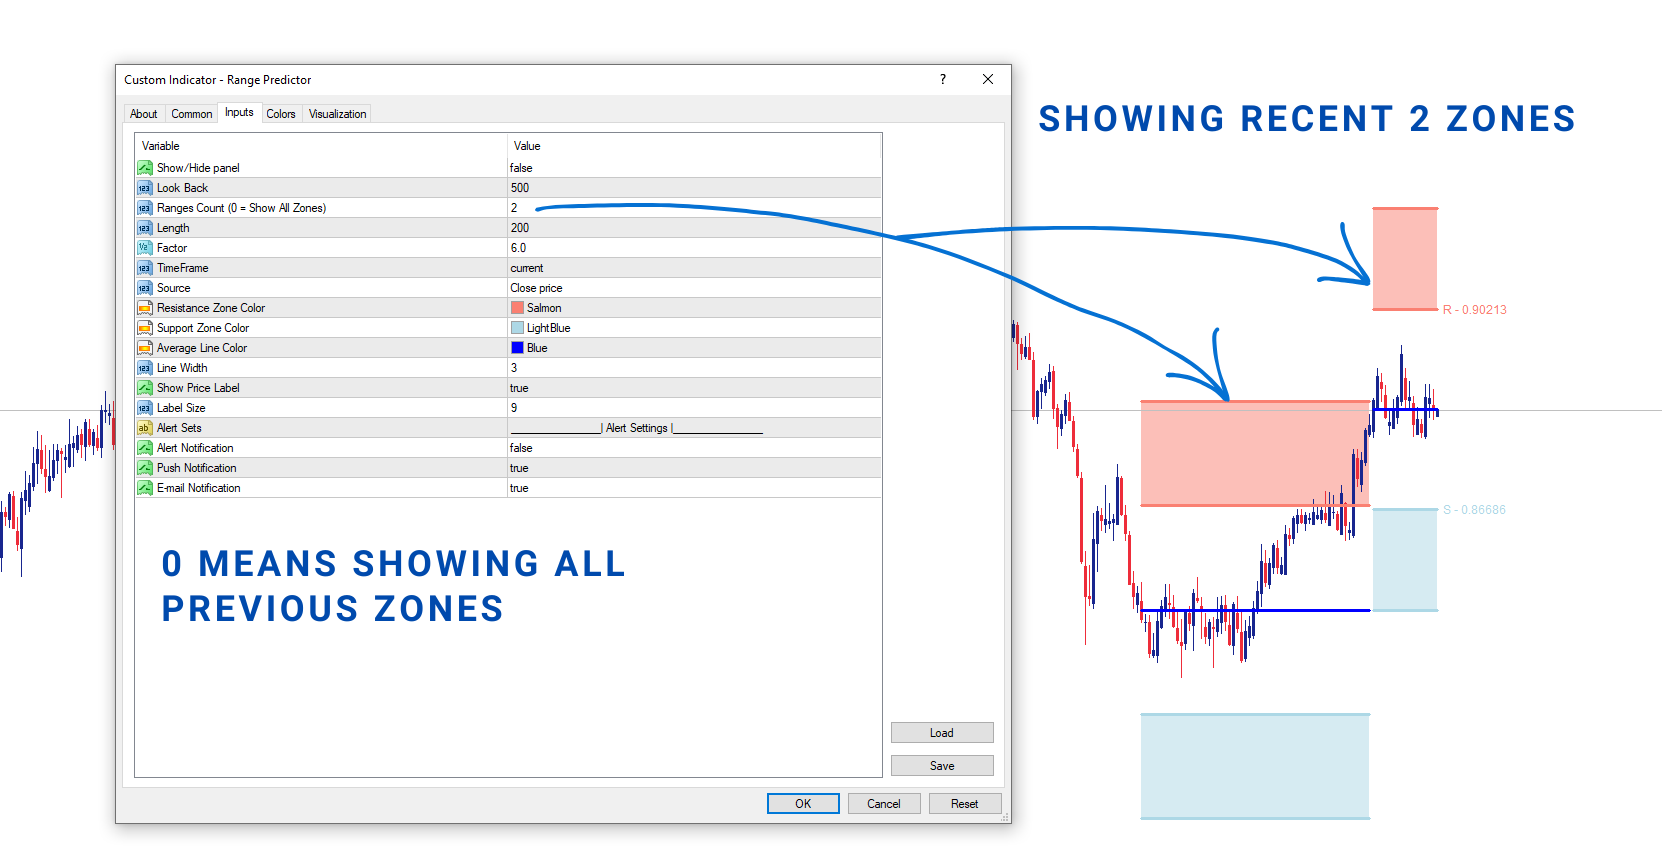
  • Dynamic Range Updates: When price breaks out of the current range, new levels are calculated instantly—no lag, no repainting.
  • Trend Tracking Made Simple: Watch the central level for a quick read on trend direction—up when it rises, down when it falls.
  • Customizable Precision: Adjust the settings to fit your style, whether you’re hunting for short-term breakouts or long-term trends.

🔧 SETTINGS: Fine-Tune Your Success

1. Length (ATR Length):
Set the depth of analysis! A higher length smooths the data, delivering more stable, equally spaced ranges. Lower it for quicker, more reactive predictions.

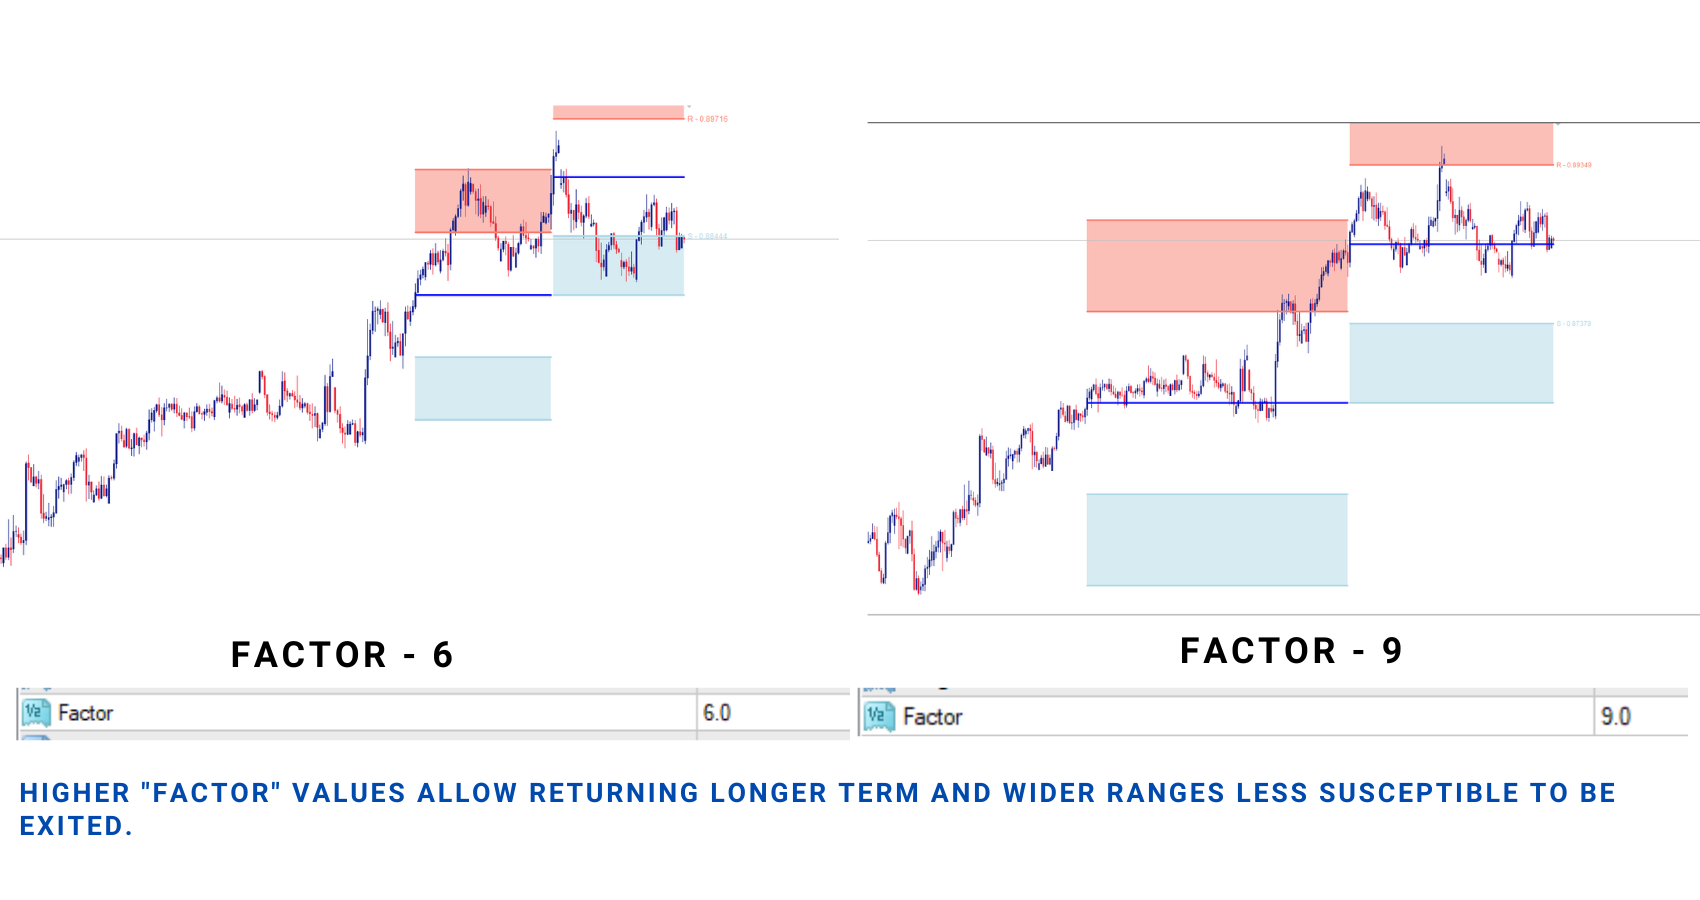
2. Factor (Range Width):
Want wider, long-term ranges? Increase the Factor to minimize false breakouts. For fast, frequent ranges, go lower for tighter control and more opportunities.

3. Timeframe (Indicator Output):
Choose the timeframe that matches your strategy. Use a higher timeframe for broader trends or a lower one for rapid, real-time updates.

4. Source (Data Input):
Pick the right data source for accurate predictions. Stick with price-scale sources like the closing price to ensure precision.

How It Works: Simple, Powerful, Accurate

When the price touches the upper or lower levels of the predicted range, expect a reversal. If the price breaks through, the Range Predictor adapts instantly, giving you fresh levels to watch. The central level serves as your compass—rising in an uptrend, falling in a downtrend.

No more guesswork. No more missed opportunities. Just real-time, actionable insights at your fingertips.

And remember, don’t hesitate to contact me if you face any issues—I’m here to help!

Ready to see the future of trading? Let the Range Predictor be your guide. 🔥


おすすめのプロダクト
SMC Venom Model BPR インジケーターは、スマート マネー (SMC) コンセプトで取引するトレーダー向けのプロフェッショナル ツールです。価格チャート上の 2 つの主要なパターンを自動的に識別します。 FVG   (フェアバリューギャップ) は、3 本のローソク足の組み合わせで、最初のローソク足と 3 番目のローソク足の間にギャップがあります。ボリュームサポートのないレベル間のゾーンを形成し、価格修正につながることがよくあります。 BPR   (バランス価格範囲) は、2 つの FVG パターンの組み合わせで、「ブリッジ」を形成します。これは、価格がボリュームアクティビティの少ない動きで動くときに、ブレイクアウトしてレベルに戻るゾーンで、ローソク足の間にギャップを作成します。 これらのパターンは、大規模な市場プレーヤーと一般参加者の相互作用が発生するチャート上のボリュームと価格動向の分析に基づいて、トレーダーが主要なサポート/レジスタンス レベル、ブレイクアウト ゾーン、エントリ ポイントを識別するのに役立ちます。 インジケーターは、長方形と矢印の形でパターンを視覚
SMC Buy Sell Indicator Smart Money Structure • Confirmed Signals SMC Buy Sell Indicator is a price action–based trading tool designed to identify market structure using Smart Money Concepts (SMC). It focuses on detecting meaningful swing points, structural breaks, and confirmed Buy/Sell signals directly from chart data. All calculations are based on closed candles, ensuring stable and consistent signals without repainting. Core Concept The indicator analyzes price structure to identify: Key swi
CosmiCLab SMC FIBO CosmiCLab SMC FIBO is a professional trading indicator designed for traders who use Smart Money Concepts (SMC), market structure analysis and Fibonacci retracement levels. The indicator automatically detects market swings and builds Fibonacci levels based on the latest impulse movement. It also identifies market structure changes such as BOS (Break of Structure) and CHOCH (Change of Character), helping traders understand the current market direction. CosmiCLab SMC FIBO also pr
This indicator is especially for the binary trading. Time frame is 1 minutes and exp time 5 or 3 minutes only. You must be use martingale 3 step. So you must put lots size is 10 % at most. You should use Mt2 trading platform to connect with my indicator to get more signal without human working. This indicator wining rate is over 80% but you may get 100% of profit by using martingale 3 step. You should use MT2 Trading Platform to connect meta trader platform and binary platform . You can get mt2
FREE
Crypto_Forex MT5用インジケーター「 WPR with 2 Moving Averages 」(リペイント機能なし) - WPR自体はスキャルピングに最適なオシレーターの1つです。 - 「WPR and 2 Moving Averages」インジケーターを使用すると、WPRオシレーターの高速移動平均線と低速移動平均線を確認できます。 - このインジケーターを使用すると、価格調整を早期に把握できます。 - このインジケーターはパラメータで簡単に設定でき、どの時間枠でも使用できます。 - 買いと売りのエントリー条件は画像で確認できます。 - WPR MA クロスの PC およびモバイル アラート付き。 買いシグナルの条件例: (1) - 高速MAが低速MAを下向きにクロスし、WPR値が-50を下回っている場合:買いトレードを開きます。 (2) - WPR値が-20を超える買われすぎゾーンに入ったら:買いトレードを終了します。 売りシグナルの条件例: (1) - 高速MAが低速MAを下向きにクロスし、WPR値が-50を超えている場合:売りトレードを開きます。 (2) WP
回帰取引を意味する専門的かつ定量的なアプローチを実装する独自の指標。これは、価格が予測可能かつ測定可能な方法で迂回して平均に戻るという事実を利用しており、非定量的な取引戦略を大幅に上回る明確な出入りルールを可能にします。 [ Installation Guide | Update Guide | Troubleshooting | FAQ | All Products ] 明確な取引シグナル 驚くほど簡単に取引できます カスタマイズ可能な色とサイズ パフォーマンス統計を実装します ほとんどの取引戦略を上回ります 適切なSLおよびTPレベルを表示します 電子メール/音声/視覚アラートを実装します 使い方 インディケータは、より高い時間枠からの完全にカスタマイズ可能な移動平均の周りの標準偏差を測定し、トレンドフォローアプローチを使用して正確に取引を見つけます。取引は、現在のチャートの価格アクションに飛び込むことによって見つけられ、価格が選択したより高い時間枠から計算された平均価格帯に戻ったときに閉じられます。それがコード化される方法のために、指標は高ボラティリティと強いトレンドの市場か
Introduction to the Manual Backtesting Indicator on MQL5 The MetaTrader platform provides an excellent backtesting tool for evaluating Expert Advisors (EAs). However, when it comes to manually backtesting a strategy to assess its effectiveness, this tool has some limitations: You cannot manually draw zones or trend lines while in backtesting mode. You cannot switch timeframes to check time alignment. For example, if my strategy requires additional confirmation from a higher timeframe (HTF), this
ADVANCED FUNCTIONALITIES: Trend Score (0-100) with visual bar Intelligent signals with adjustable strength (1-10) Risk management with automatic TP/SL Audible and visual alerts Price zones with smooth filling Multi-indicator analysis (RSI, ATR, BB, EMAs) DESIGN FEATURES Modern Visual: Smooth and well-spaced lines (EMA with 2-3px width) Vibrant and professional colors (Sky Blue, Orange, Gold) Modern arrows (code 233/234) for buy/sell signals Configurable dark/light theme Adjustable transparency f
ProTrade EA
Jim Ariel Camarce Ignao
Key Features   Automated Candle Pattern Recognition 10 Professional Patterns : Detects Bullish/Bearish Engulfing, Hammer/Shooting Star, Morning/Evening Star, Piercing/Dark Cloud, and 6 additional professional candlestick patterns Smart Filtering : Combine multiple patterns with configurable confirmation logic Volume Confirmation : Optional volume filter to validate pattern strength Multi-Timeframe Analysis : Separate execution and bias timeframes for better timing   Trading Dashboard Int
Sonic R Pro Enhanced EA - バージョン 2025 249ドル - 最初の5名様限定! ライブシグナル Sonic R Pro Enhancedのライブパフォーマンスを確認: トレード戦略 Sonic R Pro Enhancedは、Dragon Band (EMA 34とEMA 89) を基にした自動トレード戦略の改良版であり、先進的なアルゴリズムを搭載しています。 タイムフレーム: M15, M30 対応通貨ペア: XAUUSD, BTCUSD, AUDJPY, USDJPY トレードスタイル: スイングトレード - リトレースメント & 逆張り 最低資金: 500 USD レバレッジ: 1:200 以上 ユーザーガイド Sonic R Pro Enhancedはシンプルさを追求しています。設定するのは1つのパラメータ: RiskAmount のみです。 RiskAmount < 0 の場合:口座残高のパーセンテージでリスクを計算 RiskAmount > 0 の場合:1回のトレードあたりの固定リスク金額 (USD) 例: RiskA
Exclusive Imperium MT5 — 自動売買システム Exclusive Imperium MT5 は MetaTrader 5 用のエキスパートアドバイザー(EA)で、市場分析アルゴリズムとリスク管理に基づいています。EAは完全自動で稼働し、トレーダーの介入は最小限で済みます。 注意!購入後すぐにご連絡ください 。設定手順をお渡しします! 重要: すべての例、スクリーンショット、テストはデモ目的のみです。あるブローカーで特定の通貨ペアが良好な結果を示しても、他のブローカーでも同様になるとは限りません。各ブローカーには独自のレート、スプレッド、取引条件があります。したがって、 各通貨ペアはユーザー自身が個別に最適化する必要があります 。実際の口座では 単一通貨モードのみ で稼働させてください。マルチ通貨モードのスクリーンショットは参考例にすぎません。市場環境は変化するため、最適化は少なくとも 年に1回 繰り返すことを推奨します。 重要情報: EAのデモ版は評価目的のみです。最適化なしのテスト結果はアルゴリズムの実際の動作を反映しません。完全な利用には、ブローカー、資金、選
Price Magnet — Price Density and Attraction Levels Indicator Price Magnet is a professional analytical tool designed to identify key support and resistance levels based on statistical Price Density. The indicator analyzes a specified historical period and detects price levels where the market spent the most time. These zones act as “magnets,” attracting price action or forming a structural base for potential reversals. Unlike traditional Volume Profile tools, Price Magnet focuses on price-time d
Noize Absorption Index - is the manual trading system that measures the difference of pressure between bears forces and bulls forces. Green line - is a noize free index that showing curent situation. Zero value of index shows totally choppy/flat market.Values above zero level shows how powerfull bullish wave is and values below zero measures bearish forces.Up arrow appears on bearish market when it's ready to reverse, dn arrow appears on weak bullish market, as a result of reverse expectation.
Prizmal Logic
Vladimir Lekhovitser
3.5 (2)
リアルタイム取引シグナル 取引活動の公開リアルタイム監視: https://www.mql5.com/ja/signals/2353471 公式情報 出品者プロフィール 公式チャンネル ユーザーマニュアル セットアップ手順および使用ガイド: ユーザーマニュアルを開く 本エキスパートアドバイザーは、ルールに基づいた取引戦略に基づいて設計されています。 この戦略は、常に市場に参加するのではなく、特定の市場条件を識別することに重点を置いています。 システムは価格の動き、ボラティリティの特性、時間的要因を分析します。 これらの要素は、現在の市場環境が取引に適しているかどうかを判断するために使用されます。 複数の事前定義された条件が同時に満たされた場合にのみ取引が実行されます。 条件が満たされない場合、エキスパートアドバイザーは非アクティブな状態を維持します。 その結果、取引頻度は一定ではありません。 取引がまったく行われない期間が発生することがあります。 これには、ポジションが一切開かれない日も含まれます。 一方で、市場環境が適している場合には、比較的短時間で複数の
Manus Pro
Itumeleng Mohlouwa Kgotso Tladi
MANUS PRO EA The Trading Revolution You've Been Waiting For Are you TIRED of watching other traders make consistent profits while your account bleeds red?   The financial markets don't wait for anyone – and neither should you. MANUS PRO isn't just another Expert Advisor... it's your   TICKET TO FINANCIAL FREEDOM . Why MANUS PRO is Different (And Why Everyone's Talking About It) FOR BEGINNERS: Your Trading Mentor That Never Sleeps Zero Learning Curve   – Install, activate, and watch it wo
Caicai L&S Yield Histogram Important Notice: This indicator is an integral tool of the automated EA Caicai Long and Short Pair Trading . This indicator visually displays the percentage deviation (Yield %) of a pair's current spread relative to its own historical mean. It is an excellent tool for quickly visualizing the gross financial potential of a market distortion in Long & Short operations. Main Features: Percentage Visualization: Understand the size of the distortion in palpable percentage
プレミアムレベルは、正しい予測の精度が80%を超える独自の指標です。 この指標は、最高のトレーディングスペシャリストによって2か月以上テストされています。 あなたが他のどこにも見つけられない作者の指標! スクリーンショットから、このツールの正確さを自分で確認できます。 1は、1キャンドルの有効期限を持つバイナリーオプションの取引に最適です。 2はすべての通貨ペア、株式、商品、暗号通貨で機能します 手順: 赤い矢印が表示されたらすぐにダウントレードを開き、青い矢印が表示されたら閉じます。青い矢印の後に開くこともできます。 試してテストしてください!推奨設定はデフォルトです! 日足チャートで最高の精度を示します! インディケータは、2600 Pipsの収益性に対して、約10Pipsという非常に小さなマージンを使用します。
Stormer RSI 2
Ricardo Rodrigues Lucca
This strategy was learned from Stormer to be used on B3. Basically, 15 minutes before closing the market, it will check RSI and decided if it will open an position. This strategy do not define a stop loss. If the take profit reach the entry price it will close at market the position. The same happens if the maximal number of days is reached. It is created to brazilian people, so all configuration are in portuguese. Sorry Activations allowed have been set to 50.
This utility is designed to automatically maintain a "locking" position and reopen it when necessary, which is suitable for position maintenance and protection strategies. A simple utility (hereinafter referred to as the bot) that implements a locking strategy with an infinitely reloadable locking trade. How the bot works: - When launched, select a buy or sell order with a specified TP - Set the SL parameter for the locking trade - The bot monitors the distance between the opening price of the f
SPECIAL LAUNCH OFFER: $30 (1-Month Rent) Limited time offer to build our community and gather feedback! AmbM GOLD Institutional Scalper A high-precision M5 algorithm for XAUUSD (Gold) , engineered to trade exclusively at Institutional Liquidity Levels ($5/$10 psychological marks). PERFORMANCE DATA (BUY ONLY) • Win Rate: 87.09%. • Safe Growth: +$4,113 profit on $10k (13.75% Max Drawdown). • Extreme Stress Test: Successfully generated +$22,997 in a 5-year stress test (2020-2026), proving
Investopedia FIVE
Joseph Anthony Aya-ay Yutig
Investopedia FIVEEAはこの記事に基づいています: https://www.investopedia.com/articles/forex/08/five-minute-momo.asp 取引条件 -X期間のEMAとMACDの下で取引されている通貨ペアがマイナスの領域にあることを確認します。 -価格がX期間のEMAを超えるのを待ってから、MACDがネガティブからポジティブにクロスする過程にあるか、5バー以内でポジティブな領域にクロスしたことを確認します。 -X期間EMAの上に長いXピップを移動します。 -エントリー時のポジションのXとリスク額を売ります。後半のストップを損益分岐点に移動します。 -トレーリングストップを使用 -リスク警告 -ADX PROを購入する前に、関連するリスクに注意してください。 -過去のパフォーマンスは将来の収益性を保証するものではありません(EAも損失を出す可能性があります)。 -示されているバックテスト(スクリーンショットなど)は、最適なパラメーターを見つけるために高度に最適化されていますが、結果をライブ取引に転送すること
Introducing   Order Blocks Breaker , a brand-new way to identify and leverage order blocks in your trading strategy. After developing multiple order block tools with unique concepts, I’m proud to present this tool that takes things to the next level. Unlike previous tools,   Order Blocks Breaker   not only identifies order blocks but also highlights   Breaker Order Blocks —key areas where the price is likely to retest after a breakout. MT4 -  https://www.mql5.com/en/market/product/124101/ This t
RBreaker Gold Indicatorsは、金先物の短期日内取引戦略であり、トレンドフォローと日内反転の2つの取引手法を組み合わせたものです。トレンド相場での利益を捉えるだけでなく、相場が反転した際には迅速に利確し、その流れに沿ってポジションを反転させることができます。 この戦略は、アメリカの雑誌『Futures Truth』において、15年連続で最も収益性の高い取引戦略トップ10に選ばれた実績を持ち、非常に長いライフサイクルを誇り、現在も国内外で広く使用・研究されています。 本インディケーターは、2026年の金先物の値動きに対応し、14日間のATR指標に基づいて、ブレイクアウト係数A、観察係数B、リバーサル係数Rをより合理的な値で定義しています。非常に優れたインディケーターであり、安定的な年間収益を実現しています。ぜひおすすめします〜
Range Directional Force Indicator – Designed for You to Optimize! The Range Directional Force Indicator is a cutting-edge tool designed to empower traders by visualizing market dynamics and directional strength. Built to offer insights into market trends and reversals, this indicator is an invaluable asset for traders seeking precision in their strategies. However, it is important to note that this indicator is not optimized, leaving room for you to tailor it to your unique trading preferences.
Description : Rainbow MT5 is a technical indicator based on Moving Average with period 34 and very easy to use. When price crosses above MA and MA changes color to green, then this is a signal to buy. When price crosses below MA and MA changes color to red, then this is a signal to sell. The Expert advisor ( Rainbow EA MT5 ) based on Rainbow MT5 indicator is now available here . MT4 version is available here .
FREE
Matrix Arrow EA MT5
Juvenille Emperor Limited
5 (7)
マトリックスアローEAMT4 は、 マトリックスアローインジケーターのMT5 シグナルをチャート上のトレードパネルと手動または100%自動でトレードできるユニークなエキスパートアドバイザーです。 マトリックスアローインジケーターMT5 は、初期段階で現在のトレンドを判断し、最大10の標準インジケーターから情報とデータを収集します。平均方向移動指数(ADX ) 、 商品チャネルインデックス(CCI) 、 クラシック平研アシキャンドル 、 移動平均 、 移動平均収束発散(MACD) 、 相対活力指数(RVI) 、 相対力指数(RSI) 、 放物線SAR 、 ストキャスティクス 、 ウィリアムズのパーセント範囲 。 すべてのインジケーターが有効な買いまたは売りシグナルを与えると、対応する矢印がチャートに印刷され、次のろうそく/バーの開始時に強い上昇トレンド/下降トレンドを示します。ユーザーは、使用するインジケーターを選択し、各インジケーターのパラメーターを個別に調整できます。   Matrix Arrow EA MT5 を使用すると、チャートのトレードパネルから直接、または100%アルゴリ
DQN Gold XAUUSD is a neural network trading indicator for MetaTrader 5 designed to analyze Gold (XAUUSD) market conditions and display BUY and SELL signals directly on the chart. The indicator evaluates market behaviour using a Deep Q-Network (DQN) reinforcement learning model trained on historical price data. The system analyzes the current market structure and automatically selects the most appropriate strategy according to detected market conditions. Model Logic The neural network model was t
"Pattern 123" is an indicator-a trading system built on a popular pattern, pattern 123. This is the moment when we expect a reversal on the older trend and enter the continuation of the small trend, its 3rd impulse. The indicator displays signals and markings on an open chart. You can enable/disable graphical constructions in the settings. The indicator has a built-in notification system   (email, mobile terminal, standard terminal alert). "Pattern 123" has a table that displays signals from se
このプロダクトを購入した人は以下も購入しています
SuperScalp Pro
Van Minh Nguyen
4.63 (24)
SuperScalp Pro – 高度なマルチフィルタースキャルピングインジケーターシステム SuperScalp Pro は、クラシックな Supertrend と複数のインテリジェント確認フィルターを組み合わせた高度なスキャルピングインジケーターです。M1 から H4 まで複数の時間足で効率的に動作し、XAUUSD、BTCUSD、主要 Forex 通貨ペア向けに最適化されています。 このインジケーターは明確な Buy / Sell シグナルを提供し、ATR に基づいてエントリー価格、Stop Loss、Take Profit を自動計算します。Fibonacci Take Profit 機能により、重要な価格帯で早期決済し、到達時に通知を送信します。 初期設定では Fibonacci Take Profit が有効化されており、より安定した取引体験を重視しています。チャートに適用するだけですぐ利用可能です。上級者向けに、すべてのパラメータは自由にカスタマイズできます。 EMA、RSI、ADX、Volume、VWAP、Bollinger Bands、MACD Divergence な
このインジケーターを購入された方には、以下の特典を 無料 で提供しています: 各トレードを自動で管理し、ストップロスとテイクプロフィットを設定し、戦略ルールに基づいてポジションを決済する補助ツール 「Bomber Utility」 様々な銘柄に合わせたインジケーターの設定ファイル(セットファイル) 「最小リスク」、「バランスリスク」、「待機戦略」 の3つのモードで使用できる Bomber Utility 用の設定ファイル このトレーディング戦略をすぐに導入・設定・開始できる ステップバイステップのビデオマニュアル ご注意: 上記の特典を受け取るには、MQL5のプライベートメッセージシステムを通じて販売者にご連絡ください。 オリジナルのカスタムインジケーター 「Divergence Bomber(ダイバージェンス・ボンバー)」 をご紹介します。これは、MACDのダイバージェンス(乖離)戦略に基づいた 「オールインワン」型のトレーディングシステム です。 このテクニカルインジケーターの主な目的は、価格とMACDインジケーターの間に発生するダイバージェンスを検出 し、将来の価格の動きを示す
Entry In The Zone and SMC Multi Timeframe is a real-time 2-in-1 market analysis tool that combines market structure analysis and a No Repaint BUY / SELL signal system into a single indicator, built on Smart Money Concepts (SMC) — a widely adopted framework used by professional traders to understand market structure. This indicator helps you see the market more clearly, make decisions based on structure rather than guesswork, and focus on high-probability zones where price is more likely to react
Power Candles V3 - 自己最適化型強弱インジケーター Power Candles V3は 、通貨や銘柄の強さを、適用されたすべてのチャート上で実行可能なトレードプランに変換します。単にローソク足を色分けするだけでなく、バックグラウンドでリアルタイムの自動最適化を実行し、目の前の銘柄に対して最適なストップロス、テイクプロフィット、およびシグナルの閾値を提示します。ワンクリックで実取引に適用でき、エントリーポイント、ストップロス、テイクプロフィットのラインが正確な価格位置にチャート上に表示され、方向性を示すアラートがリアルタイムで発動します。 このツールは、Stein Investmentsのエコシステムの一部です。  18種類以上のツールをすべて閲覧し、AIを活用したセットアップの推奨事項を入手し、  https://stein.investments でコミュニティに参加しましょう クローズしたバーごとに3,000回以上のトレードシミュレーション。9つの強さの状態。2つの戦略を並行してテスト。勝率の高い設定をワンクリックで適用。 なぜこれが必要なのか ほとんどの強
SignalTech MT5 is a fully rule based trading system for EURUSD, USDCHF, USDJPY, AUDUSD, NZDUSD, EURJPY, AUDJPY, NZDJPY, CADJPY.  All the winning trades with chart setups are published on the comments page. 2025-12 1174 Pips 2026-01 2624 Pips 2026-02 2937 Pips 2026-03 2165 Pips 2026-04 2243 Pips It can generate signals with Buy/Sell Arrows and Pop-Up/Sound Alerts. Each signal has clear Entry and Stop Loss levels, which should be automatically flagged on the chart, as well as potential Targets 1,
ご紹介     Quantum Breakout PRO は 、ブレイクアウト ゾーンの取引方法を変革する画期的な MQL5 インジケーターです。 13年以上の取引経験を持つ経験豊富なトレーダーのチームによって開発されました。     クォンタム ブレイクアウト プロ   は、革新的でダイナミックなブレイクアウト ゾーン戦略により、あなたのトレーディングの旅を新たな高みに押し上げるように設計されています。 クォンタム ブレイクアウト インジケーターは、5 つの利益ターゲット ゾーンを備えたブレイクアウト ゾーン上のシグナル矢印と、ブレイクアウト ボックスに基づいたストップロスの提案を提供します。 初心者トレーダーにもプロのトレーダーにも適しています。 量子EAチャネル:       ここをクリック 重要!購入後、インストールマニュアルを受け取るためにプライベートメッセージを送ってください。 推奨事項: 時間枠: M15 通貨ペア: GBPJPY、EURJPY、USDJPY、NZDUSD、XAUUSD アカウントの種類: ECN、Raw、またはスプレッドが非常に低い R
Gann Made Easy   は、ミスター・ギャンの理論を使用した取引の最良の原則に基づいた、プロフェッショナルで使いやすい外国為替取引システムです。 W・D・ガン。このインジケーターは、ストップロスとテイクプロフィットレベルを含む正確な買いと売りのシグナルを提供します。 PUSH通知を利用して外出先でも取引可能です。 ご購入後、取引方法の説明と優れた追加インジケーターを無料で入手するには、私にご連絡ください! おそらく、ギャンの取引手法についてはすでに何度も聞いたことがあるでしょう。通常、ギャンの理論は初心者のトレーダーだけでなく、すでにある程度の取引経験がある人にとっても非常に複雑なものです。なぜなら、ギャンの取引手法は理論的にはそれほど簡単に適用できるものではないからです。私はその知識を磨き、最良の原則を私の外国為替インジケーターに組み込むために数年を費やしました。 このインジケーターは非常に簡単に適用できます。必要なのは、それをチャートに添付し、簡単な取引推奨事項に従うだけです。このインジケーターは常に市場分析の仕事を行い、取引の機会を探します。適切なエントリーポイントを検
このインジケーターを購入すると、プロ仕様のトレードマネージャーを無料で差し上げます。 まず第一に、このトレーディングシステムがノンリペイント、ノンリドロー、ノンラグのインジケーターであることを強調する価値がある。これにより、手動取引とロボット取引の両方に理想的なものになっています。 オンラインコース、マニュアル、プリセットのダウンロード。 「スマートトレンドトレーディングシステム MT5」は、新規および経験豊富なトレーダー向けにカスタマイズされた包括的なトレーディングソリューションです。10以上のプレミアムインジケーターを組み合わせ、7つ以上の堅実なトレーディング戦略を備えており、多様な市場状況に対応する多目的な選択肢となっています。 トレンドフォロー戦略:トレンドを効果的に乗り越えるための正確なエントリーとストップロス管理を提供します。 リバーサル戦略:潜在的なトレンドの反転を特定し、トレーダーがレンジ相場を活用できるようにします。 スキャルピング戦略:高速で正確なデイトレードおよび短期取引のために設計されています。 安定性:すべてのインジケーターはノンリペイント、ノンリドロー、ノ
RelicusRoad Pro: 定量的市場オペレーティングシステム 【期間限定】無制限アクセス 70% OFF - 2,000人超のトレーダーと共に なぜ多くのトレーダーは「完璧な」インジケーターを使っても失敗するのでしょうか? それは、文脈を無視して 単一の概念 だけでトレードしているからです。文脈のないシグナルは単なるギャンブルです。勝ち続けるには、 根拠の重なり(コンフルエンス) が必要です。 RelicusRoad Proは単なる矢印インジケーターではありません。完全な 定量的市場エコシステム です。独自のボラティリティモデリングを用いて、価格が推移する「適正価値の道(Fair Value Road)」をマッピングし、ノイズと真の構造的ブレイクを判別します。 推測はやめましょう。機関投資家レベルの「ロード・ロジック」でトレードを。 コアエンジン:「Road」アルゴリズム システムの中心となる Road Algo は、市場環境にリアルタイムで適応するダイナミックなボラティリティチャネルです。 安全ライン(平衡点) と、価格が数学的に反転しやすい 拡張レベル を投影します。 Si
MetaTrader 5 向けスマート多層ブレイクアウト&プルバック検出器 「スマート・シンプル・ファスト!」 高確率のブレイクアウトエントリーを見逃すことにうんざりしていませんか? 複数のチャートを何時間もスキャンし、ブレイクアウトをトレンド方向と通貨のモメンタムに合わせようとして、それでも動きを逃してしまうことはありませんか? Break Pullback は、1つのインジケーターでそのすべてを解決します。 Break Pullback とは何ですか? Break Pullback は、マーケットストラクチャー、ブレイクアウト、トレンド継続のセットアップを取引するトレーダー向けに特別に設計されたプロフェッショナルグレードの MetaTrader 5 インジケーターです。 リアルタイムで複数の通貨ペアにわたるブレイクとプルバックの形成を自動的に検出し、3層の確認を通じてすべてのシグナルをフィルタリングします: ストラクチャラルブレイクアウト検出 — チャート上の主要なブレイクレベルを特定 HTF 日足バイアス — エントリーを支配的な日足トレンド方向に合わせる 通貨強弱指数 —
Azimuth Pro
Ottaviano De Cicco
5 (7)
Azimuth Pro V2:MT5向けシンセティック・フラクタル構造分析と確認済みエントリー 概要 Azimuth Pro は Merkava Labs によるマルチレベルスイング構造インジケーターです。4つのネストされたスイングレイヤー、スイングアンカーVWAP、ABCパターン検出、3タイムフレーム構造フィルタリング、そして確定バーでの確認済みエントリー — 1つのチャートで、ミクロスイングからマクロサイクルまでを網羅するワークフロー。 これはブラインドシグナル製品ではありません。ロケーション、コンテキスト、タイミングを重視するトレーダーのための構造ファーストワークフローです。 V2発売記念オファー — Azimuth Pro V2をUSD 399で(次の100本)。最終価格:USD 499。 1. V2での変更点 シンセティック・マルチタイムフレームエンジン 上位タイムフレーム分析をMeridian Proと同じ独自のシンセティックアーキテクチャで一から再構築。よりクリーンなHTFコンテキスト、安定したライブ動作、従来のMTF同期問題なし。シンセティックエンジンは 固定比率タ
Quantum TrendPulse を ご紹介します。これは、   SuperTrend   、   RSI   、および Stochastic のパワーを 1 つの包括的なインジケーターに組み合わせて、取引の可能性を最大限に引き出す究極の取引ツールです。精度と効率を求めるトレーダー向けに設計されたこのインジケーターは、市場のトレンド、勢いの変化、最適なエントリー ポイントとエグジット ポイントを自信を持って特定するのに役立ちます。 主な特徴: SuperTrend 統合: 現在の市場動向に簡単に追従し、収益性の波に乗ることができます。 RSI精度: 買われすぎと売られすぎのレベルを検出し、市場の反転のタイミングに最適で、SuperTrendのフィルターとして使用されます。 確率的精度: 確率的振動を活用して、変動の激しい市場で隠れたチャンスを見つけます。SuperTrend のフィルターとして使用されます。 マルチタイムフレーム分析:   M5 から H1 または H4 まで、さまざまなタイムフレームで市場を常に把握します。 カスタマイズ可能なアラート: カスタム取引条件が満たされ
まず第一に、この取引インジケーターは再描画されず、再描画されず、遅延しないことを強調する価値があります。これにより、手動取引とロボット取引の両方に理想的なものになります。 ユーザーマニュアル:設定、入力、戦略。 アトミックアナリストは、価格の強さとモメンタムを利用して市場でより良いエッジを見つけるためのPA価格アクションインジケーターです。ノイズや誤ったシグナルを除去し、取引ポテンシャルを高めるための高度なフィルターを備えています。複雑なインジケーターの複数のレイヤーを使用して、アトミックアナリストはチャートをスキャンし、複雑な数学的計算をシンプルなシグナルと色に変換します。これにより、どのような初心者トレーダーでも理解して使用し、一貫した取引の決定を行うことができます。 「アトミックアナリスト」は、新規および経験豊富なトレーダー向けにカスタマイズされた包括的な取引ソリューションです。プレミアムインジケーターとトップノッチの機能を1つの取引戦略に組み合わせ、すべてのタイプのトレーダーにとって汎用性のある選択肢にします。 デイリートレーディングとスキャルピング戦略:高速で正確なデイ
FX Trend NG:次世代マルチマーケット・トレンドインテリジェンス 概要 FX Trend NG は、複数の時間足に対応したプロフェッショナル向けトレンド分析およびマーケット監視ツールです。 市場全体の構造を数秒で把握することができます。 複数のチャートを切り替える必要はありません。どの銘柄がトレンド中なのか、どこでモメンタムが弱まっているのか、そしてどの時間足で強い整合性があるのかを瞬時に確認できます。 ローンチ特別オファー – FX Trend NG を $30(6ヶ月) または $80 永久ライセンス でご利用いただけます。 すでに Stein Investments のユーザーですか? -> メッセージを送信 して、プライベートグループへアクセスしてください。 セットアップや詳細情報が必要ですか? -> Stein Investments 公式ページ をご覧ください。 1. FX Trend NG が他と異なる理由 3ステート・トレンドロジック ― Buy と Sell だけではない • 多くのインジケーターは Buy または Sell の2状態のみを表示します。
まず第一に、この取引ツールはノンリペイント、ノンリドロー、ノンラグの指標であり、プロの取引に理想的ですことを強調する価値があります。 オンラインコース、ユーザーマニュアル、デモ。 スマートプライスアクションコンセプトインジケーターは、新米から経験豊富なトレーダーまで、非常 に強力なツールです。Inner Circle Trader AnalysisやSmart Money Concepts Trading Strategiesなど、20以上の有用な指標を1つに組み合わせています。このインジケーターはスマートマネーコンセプトに焦点を当て、大手機関の取引方法を提供し、彼らの動きを予測するのに役立ちます。 特に、流動性分析に優れており、機関がどのように取引しているかを理解しやすくしています。市場のトレンドを予測し、価格の動きを慎重に分析するのに優れています。機関の戦略とトレードを合わせることで、市場の動向についてより正確な予測ができます。このインジケーターは多目的であり、市場構造を分析し、重要な注文ブロックを特定し、さまざまなパターンを認識するのに優れています。 このインジケーター
Market Structure Order Block Dashboard MT5 は、市場構造と主要な価格反応ゾーンをチャート上で直接読み取りたいトレーダー向けに設計された MT5 インジケーターです。BOS、ChoCH、オーダーブロック、Fair Value Gap (FVG)、流動性、Kill Zones、Volume Profile、そして素早い分析のためのコンパクトなダッシュボードを組み合わせています。 本インジケーターは、市場構造、ICT、Smart Money の概念を意思決定の枠組みとして使用するトレーダーを対象としています。トレンド継続、反転の可能性、価格の不均衡、流動性ターゲット、注目ゾーンをより構造的に特定する助けとなります。 購入者向けの付属リソース 購入後、MQL5 のプライベートメッセージにてご依頼いただくと、完全な PDF ユーザーガイドとパラメータ設定のヒントを提供いたします。MQL5 のプライベートメッセージによる直接的な技術サポート。 バージョン 1.20 では 2 つの重要な追加機能があります: Pending BOS / Pending Cho
BTMM State Engine Pro is a MetaTrader 5 indicator for traders who use the Beat The Market Maker approach: Asian session context, kill zone timing, level progression, peak formation detection, and a multi-pair scanner from a single chart. It combines cycle state logic with a built-in scanner dashboard so you do not need the same tool on many charts at once. What it does Draws the Asian session range; session times can follow broker server offset or be set in inputs. Tracks level progression (L
OrderFlux | MetaTrader 5 用フットプリント・オーダーフロー バージョン 2.0 – アクティブトレーダー向けのリアルタイム Bid/Ask 可視化 OrderFlux は MT5 用のフットプリントおよびオーダーフローインジケーターです。価格がどこに動いたかだけでなく、その動きの中で何が起きているか(各価格レベルの Bid/Ask ボリューム、デルタ、インバランス、ボリューム分布)を表示します。 多くのチャートはローソク足の最終結果しか表示しません。OrderFlux はそこに至るまでの過程を表示します。ローソク足の形状だけでなく、市場参加者の動向を読み取りたい場合にまさに役立ちます。 ライブチャートにおいて、OrderFlux は主に次の3つの質問に答えます: 現在、どこで積極的な買いまたは売りの圧力が市場に参入しているか? どの価格レベルでボリュームが吸収、または拒否されているか? 現在の動きはセッションのコンテキスト(背景)にどう適合しているか? インターフェースで得られるもの メインチャートは、Canvas ベースでフットプリントを直接レンダリングします
OmniSync Projection
Antonio-alin Teculescu
5 (1)
Chronos Fractal Engine is an innovative price projection indicator for MetaTrader 5, designed to transform your technical analysis by intelligently identifying and projecting historical price patterns. Built upon an advanced correlation algorithm and the fractal principles of the market, this powerful tool visualizes potential future price movements, giving you a unique edge in your trading decisions. What is Chronos Fractal Engine? At its core, the Chronos Fractal Engine employs a sophisticat
多くの矢印インジケーターは、シグナルだけを表示して、その後の判断をすべてトレーダーに任せてしまいます。KT Alpha Hunter Arrows は、完整なトレードプランをチャート上に提示します。 各シグナル矢印が表示されるたびに、エントリーライン、ストップロス、4つのテイクプロフィット水準、そして現在の銘柄と時間足が今トレードに値するかどうかを示すリアルタイムのエッジ判定が、すでに描画された状態で表示されます。付属の Trade Manager EA は、あなたが手動でエントリーした後の実行管理を担当し、相場が荒れて判断がぶれやすい場面でも規律あるトレードを保ちやすくします。リペイントなし。確定足シグナルのみ。Forex、ゴールド、指数、その他あなたが取引するあらゆる銘柄に対応します。 主な機能 リペイントしない買い矢印と売り矢印を、足の確定後にのみ表示。 各シグナルに、エントリーライン、構造的ストップロス、4つのテイクプロフィット水準を表示。 Edge Dashboard が、現在のチャートで買いセットアップと売りセットアップを別々に評価。 判定システム:No Edge、Mar
優れたテクニカルインジケーター「Grabber」をご紹介します。これは、すぐに使える「オールインワン」トレーディング戦略として機能します。 ひとつのコードに、市場のテクニカル分析ツール、取引シグナル(矢印)、アラート機能、プッシュ通知が強力に統合されています。 このインジケーターを購入された方には、以下の特典を無料で提供します: Grabberユーティリティ:オープンポジションを自動で管理するツール ステップバイステップのビデオマニュアル:インジケーターのインストール、設定、取引方法を解説 カスタムセットファイル:インジケーターをすばやく自動設定し、最大限の成果を出すための設定ファイル 他の戦略はもう忘れてください!Grabberだけが、あなたを新たなトレードの高みへと導いてくれるのです。 Grabber戦略の主な特徴: 推奨タイムフレーム:M5〜H4 対応通貨ペア・資産:どれでも使用可能ですが、私が実際に検証した以下を推奨します(GBPUSD、GBPCAD、GBPCHF、AUDCAD、AUDUSD、AUDSGD、AUDCHF、NZDUSD、NZDCAD、EURCAD、EURUSD、E
まず正直に言いましょう。 どんなインジケーターも、それ単体であなたを利益化させることはできません。もしそう言う人がいるなら、それは夢を売っているだけです。完璧な売買シグナル(矢印)を表示するインジケーターは、いくらでも“完璧に見せる”ことができます。正しい過去の区間を拡大して、勝ちトレードだけを切り取ればいいだけです。私たちはそれをしません。 SMC Intraday Formula はツールです。 市場構造を読み取り、最も高い確率の価格ゾーンを特定し、今この瞬間のスマートマネーの痕跡をシンプルな言葉で正確に示します。最終判断はあなたが行います。トレードを実行するのもあなたです。しかし今は「希望」ではなく「精度」でエントリーできます。 私たちはこのインジケーターを、ゴールド(XAUUSD)および主要FX通貨ペアで約3年間、日々のスキャルピングに使用してきました。M1、M5、M15、M30の主要ツールです。これは未来を予測しようとするのではなく、今まさに形成されている高確率セットアップを示し、その理由を説明します。 他のすべてのインジケーターと何が違うのか? ほとんどのトレーディングイ
このダッシュボードは、選択されたシンボルの最新の利用可能なハーモニックパターンを表示するので、時間を節約し、より効率的に /   MT4バージョン 。 無料インジケーター:   Basic Harmonic Pattern インジケーター列 Symbol : 選択したシンボルが表示されます。 Trend :   強気または弱気 Pattern : パターンの種類(ガートレー、バタフライ、バット、カニ、サメ、サイファー、ABCD) Entry : エントリー価格 SL: ストップロス価格 TP1: 1回目の利食い価格 TP2: 2回目の利食い価格 TP3:   3回目の利食い価格 Current price :   現在値 Age (in bars):    最後に描画されたパターンの年齢 主な入力項目 Symbols:   "28 Major Currency Pairs "または "Selected Symbols "から選択。 Selected Symbols:   カンマで区切られた監視したいシンボル("EURUSD,GBPUSD,XAUUSD")。ブローカーがペアに接
Meridian Pro
Ottaviano De Cicco
5 (2)
Meridian Pro 2.00:MT5向けプロ仕様マルチタイムフレーム・トレンドマトリクス Meridian Pro 2.00 は、MetaTrader 5 向けのプロ仕様の適応型トレンドマトリクスです。オリジナルの Meridian トレンドエンジン、クリーンなチャート ribbon、確定足ベースのシグナル矢印、8時間足 dashboard、Fuel momentum、weighted consensus、synthetic HTF processing、そしてチャート上に直接表示される上位足コンテキストラインを統合します。 目的はシンプルです。現在のトレンド、マルチタイムフレーム構造、強度、momentum、EA-ready 状態を、複数チャートに無関係なインジケータを重ねるのではなく、1つの整理された workflow で読むことです。 Meridian Pro の違い 1つの適応型エンジン - 同じ volatility-aware Meridian ロジックを M1 から W1 まで適用します。 Synthetic HTF architecture - 上位足行は下位足デ
FX Power: 通貨の強弱を分析して、より賢い取引を実現 概要 FX Power は主要通貨と金の実際の強弱をあらゆる市場状況で理解するための必須ツールです。強い通貨を買い、弱い通貨を売ることで、 FX Power は取引の意思決定を簡素化し、高い確率の取引機会を見出します。トレンドを追従する場合でも、極端なデルタ値を使用して反転を予測する場合でも、このツールはあなたの取引スタイルに完全に適応します。ただ取引するだけではなく、 FX Power で賢く取引をしましょう。 1. なぜ FX Power がトレーダーにとって非常に有益なのか 通貨と金のリアルタイム強弱分析 • FX Power は主要通貨と金の相対的な強弱を計算し、マーケットダイナミクスに関する明確な洞察を提供します。 • どの資産がリードしているか、または後れを取っているかを監視して、取引するペアを賢く選びましょう。 マルチタイムフレームの包括的なビュー • 短期、中期、長期のタイムフレームで通貨と金の強弱を追跡し、マーケットトレンドに基づいて取引戦略を調整できます。 • スキャルピングからスイングトレード
Market Structure Patterns
Samuel Manoel De Souza
4.47 (19)
Market Structure Patterns   is an indicator based on   smart money concepts   that displays   SMC/ICT   elements that can take your trading decisions to the next level. Take advantage of the   alerts ,   push notifications   and   email messages   to keep informed from when an element is formed on the chart, the price crosses a level and/or enters in a box/zone. Developers can access the values of the elements of the indicator using the   global variables  what allows the automation of trading
Smart Structure Concepts MT5
Cristhian Alexander Gaibor Cuasquer
Smart Structure Concepts MT5 は MetaTrader 5 で最も完全な機関投資家向け SMC ツールキットです — 4言語の教育的ツールチップと、価格がゾーンに入った瞬間のライブプッシュアラートを備えています。 ほとんどの SMC インジケーターはボックスを描くだけで、あなたに推測を強いります。このインジケーターはチャート上で各シグナルを直接説明します。任意の BOS、CHoCH、Order Block、FVG、流動性レベルにマウスを合わせれば、その意味と次に何をすべきかが即座にわかります — 英語、スペイン語、ポルトガル語、フランス語で。 含まれる機能 — Internal & Swing BOS / CHoCH をリアルタイムで検出(リペイントなし) — Internal & Swing Order Blocks と自動ミティゲーション — 上昇・下降 Fair Value Gaps — Equal Highs & Lows(EQH / EQL)流動性マッピング — Premium / Discount / Equilibrium ゾーン —
トレンドラインプロ   市場の真の方向転換点を理解するのに役立ちます。この指標は、真のトレンド反転と主要プレーヤーが再び参入するポイントを示します。 分かりますか     BOSライン   複雑な設定や不要なノイズなしに、より長い時間足でのトレンドの変化と重要なレベルを把握できます。シグナルは再描画されず、バーが閉じた後もチャート上に残ります。 MT4バージョン   -   RFI LEVELS PRO インジケーター と組み合わせることで、その最大限の能力を発揮します インジケーターが示す内容: 本当の変化   トレンド(BOSライン) 一度シグナルが現れたら、それは有効です!これは、リペイント機能を持つインジケーターとの重要な違いです。リペイント機能を持つインジケーターは、シグナルを発した後、それを変更し、資金の損失につながる可能性があります。これにより、より高い確率と精度で市場に参入できます。また、矢印が現れた後、目標値(利益確定)に達するか、反転シグナルが現れるまで、ローソク足の色を変更する機能もあります。 繰り返しエントリ   主要プレーヤーの補充 エントリーポイントを探す
The Zone Trading Indicator is a technical analysis tool for MetaTrader 5 that automatically identifies and displays tradable price zones across multiple timeframes to assist with structured market analysis. The indicator plots Monthly, Weekly, Daily, and H4 tradable zones , allowing traders to view higher- and lower-timeframe price areas simultaneously. These zones are designed to support one-candle–based entry approaches by highlighting predefined areas where price interaction may be monitored.
このインジケーターは、反転ポイントと価格戻りゾーンを正確に表示します。     主要プレーヤー 。新たなトレンドが形成される場所を把握し、最大限の精度で意思決定を行い、すべての取引をコントロールします。 TREND LINES PRO インジケーターと組み合わせることで、その潜在能力を最大限に発揮します。 VERSION MT4 インジケーターが示す内容: 新しいトレンドの始まりに活性化する反転構造と反転レベル。 リスクと報酬の比率を最小限に抑えた利益 確定 と 損失停止の レベルの表示     RR 1:2   。 インテリジェントな削減ロジックによるストップロス。 指定されたインジケーターから 2 つのトレンド タイプの反転パターンを表示します。 指標: トレンドを追う   TREND LINES PRO   (世界的なトレンドの変化) TREND PRO   (クイックトレンド変更) シンプルで効果的   スキャナー   リアルタイムトレンド(新機能)。 マルチタイムフレームのインストゥルメント フィルタリング。 画面   利益     LOGIC AI信号の後。 当日プラス方
作者のその他のプロダクト
The   Area of Interest (AOI) Indicator   is a powerful tool designed to help traders identify key market zones where price reactions are highly probable. This indicator specifically highlights two critical zones: Seller AOI (Area of Interest) : This zone represents areas where sellers are likely to enter the market, often acting as resistance. When the price approaches or touches this zone, it signals that a potential sell-off could occur. Buyer  A OI (Area of Interest) : The BOI zone identifie
FREE
This is the best Support and Resistance Indicator on the market, and it shows both confirmed Support and Resistance as well as Retests. Support & Resistance: Support marks where buying demand halts price declines, acting as a safety net. Resistance caps price surges, driven by selling pressure. Traders leverage these levels to predict reversals, plan entries, exits, and manage risks, making them trading's fundamental guideposts. Join To Learn Market Depth -   https://www.mql5.com/en/channels/su
FREE
Price Retest MT5
Suvashish Halder
4.83 (6)
Introducing our exciting new Price Retest indicator! Get instant alerts when the price retests, giving you a powerful edge in your trading strategy. Remember to do your own analysis before making any moves in the market. MT4 Version -  https://www.mql5.com/en/market/product/118031 Join To Learn Market Depth -   https://www.mql5.com/en/channels/suvashishfx Here’s a detailed explanation of how the Price Retest indicator works, its components, and how you can incorporate it into your trading strat
FREE
The "Power of Three" (PO3) is a concept developed by the Inner Circle Trader (ICT) to illustrate a three-stage approach used by smart money in the markets:   Accumulation, Manipulation, and Distribution . ICT traders view this as a foundational pattern that can explain the formation of any candle on a price chart. In simple terms, this concept is effective for any time frame, as long as there's a defined start, highest point, lowest point, and end. MT4 -  https://www.mql5.com/en/market/product/1
FREE
Consolidation Zone   Indicator is a powerful tool designed for traders to identify and capitalize on consolidation patterns in the market. This innovative indicator detects consolidation areas and provides timely alerts when the price breaks above or below these zones, enabling traders to make informed trading decisions. MT4 Version :  https://www.mql5.com/en/market/product/118734 Join To Learn Market Depth -   https://www.mql5.com/en/channels/suvashishfx Key Features: 1.   Consolidation Det
FREE
Higher Timeframe Chart Overlay will display higher timeframe candles, including the number of candles high/low you specify. You no longer need to switch timeframes to check the candles. Everything can be shown in one chart. MT5 Version :  https://www.mql5.com/en/market/product/115682 Almost everything can be change as you want. You can change/set: - Choose different colors for the body and top/bottom wicks. - Panel's height and width. - The width of the body and wicks - Change background a
Introducing   Volume Orderflow Profile , a versatile tool designed to help traders visualize and understand the dynamics of buying and selling pressure within a specified lookback period. Perfect for those looking to gain deeper insights into volume-based market behavior! MT4 Version -  https://www.mql5.com/en/market/product/122656/ The indicator gathers data on high and low prices, along with buy and sell volumes, over a user-defined period. It calculates the maximum and minimum prices during t
Smart Fibo Zones are powerful, auto-generated Fibonacci Retracements that are anchored to key market structure shifts . These zones serve as critical Supply and Demand levels, guiding you to identify potential price reactions and confirm market direction.  Fibonacci calculations, widely used by professional traders, can be complex when it comes to identifying highs and lows. However, Smart Fibo Zones simplify this process by automatically highlighting order blocks and key zones, complete with St
Introducing   Order Blocks Breaker , a brand-new way to identify and leverage order blocks in your trading strategy. After developing multiple order block tools with unique concepts, I’m proud to present this tool that takes things to the next level. Unlike previous tools,   Order Blocks Breaker   not only identifies order blocks but also highlights   Breaker Order Blocks —key areas where the price is likely to retest after a breakout. MT4 -  https://www.mql5.com/en/market/product/124101/ This t
Area of Interest
Suvashish Halder
4.78 (9)
The Area of Interest (AOI) Indicator is a powerful tool designed to help traders identify key market zones where price reactions are highly probable. This indicator specifically highlights two critical zones: Seller AOI (Area of Interest) : This zone represents areas where sellers are likely to enter the market, often acting as resistance. When the price approaches or touches this zone, it signals that a potential sell-off could occur. Buyer  A OI (Area of Interest) : The BOI zone identifies re
FREE
Price Retest
Suvashish Halder
4.88 (8)
Introducing our exciting new Price Retest indicator! Get instant alerts when the price retests, giving you a powerful edge in your trading strategy. Remember to do your own analysis before making any moves in the market. MT5 Version -  https://www.mql5.com/en/market/product/118159/ Join To Learn Market Depth -   https://www.mql5.com/en/channels/suvashishfx Here’s a detailed explanation of how the Price Retest indicator works, its components, and how you can incorporate it into your trading str
FREE
Consolidation Zone Indicator is a powerful tool designed for traders to identify and capitalize on consolidation patterns in the market. This innovative indicator detects consolidation areas and provides timely alerts when the price breaks above or below these zones, enabling traders to make informed trading decisions. MT5 Version :  https://www.mql5.com/en/market/product/118748 Join To Learn Market Depth -   https://www.mql5.com/en/channels/suvashishfx Key Features: 1. Consolidation Detecti
FREE
We mark the fair value gap (FVG) and wait for the price to reach that zone, but sometimes it reverses before getting there. This can happen because we didn't notice the Balanced Price Range (BPR). My tools will enhance your analysis by displaying everything on the chart, helping you identify potential price reversal areas so you can make informed decisions about when to enter the market. MT4 -  https://www.mql5.com/en/market/product/119216 So, what is BPR or Balanced Price Range? A Balanced Pri
Tired of manually adjusting stop-loss and take-profit levels for multiple positions across different pairs? The Manage Multiple Positions Expert Advisor is your solution. MT4 Version -  https://www.mql5.com/en/market/product/120916/ This powerful tool streamlines your trading experience by allowing you to manage multiple positions on a single pair with ease. Modify stop-loss and take-profit levels for all open positions on a specific pair with a single click. Plus, the EA provides clear visibili
Introducing the Volume Order Blocks indicator, a game-changing tool designed for traders who demand precision and clarity in their market analysis. This advanced indicator not only identifies order blocks but also integrates crucial volumetric data, allowing you to gauge the strength of these blocks with unparalleled accuracy. MT4 version -  https://www.mql5.com/en/market/product/121237/ Key Features of the Volume Order Blocks: Bullish & Bearish Order Blocks: Easily visualize and differentiat
This is the best Support and Resistance Indicator on the market, and it shows both confirmed Support and Resistance as well as Retests. Support & Resistance: Support marks where buying demand halts price declines, acting as a safety net. Resistance caps price surges, driven by selling pressure. Traders leverage these levels to predict reversals, plan entries, exits, and manage risks, making them trading's fundamental guideposts. Join To Learn Market Depth -   https://www.mql5.com/en/channels/suv
FREE
This is one of the most popular and highly rated   volatility index (VIX)   indicators on the market. It provides the same readings as the VIX does for stock indexes. However, this indicator works across all asset classes.  VIX Fix Finds Market Bottoms.  This indicator is not for inexperienced traders. Use it for day and swing trading. MT4 Version -  https://www.mql5.com/en/market/product/112238 Join To Learn Market Depth -   https://www.mql5.com/en/channels/suvashishfx Bernard Baruch summe
FREE
Volume Delta Candles offer a straightforward way to analyze trading activity within each candle, making it easier to see what's happening without needing an extra volume indicator. This tool uses lower timeframe or real-time data to show the percentage of buying and selling volume within a candle as a colored bar. Make sure you understand Volume and Volume Delta before jumping in. If you’re not sure, reach out to me first for a quick rundown. But if you're already familiar, you're good to go! Ke
Smart Fibo Zones   are powerful, auto-generated Fibonacci Retracements that are anchored to key   market structure shifts . These zones serve as critical   Supply and Demand   levels, guiding you to identify potential price reactions and confirm market direction.  Fibonacci  calculations, widely used by professional traders, can be complex when it comes to identifying highs and lows. However,  Smart Fibo Zones  simplify this process by automatically highlighting order blocks and key zones, compl
Introducing the   Volume Order Blocks  indicator, a game-changing tool designed for traders who demand precision and clarity in their market analysis. This advanced indicator not only identifies order blocks but also integrates crucial volumetric data, allowing you to gauge the strength of these blocks with unparalleled accuracy. MT5 version -  https://www.mql5.com/en/market/product/121238/   Key Features of the Volume   Order Blocks: Bullish & Bearish Order Blocks:   Easily visualize and dif
Trading Notes   is an innovative tool designed for traders to streamline their decision-making process by allowing them to write and display important reminders or short details directly over their trading charts. This essential feature ensures that traders have quick access to their personalized checklist before opening any positions, enhancing their trading efficiency and accuracy. MT4 Version -  https://www.mql5.com/en/market/product/120613 Join To Learn Market Depth -  https://www.mql5.co
FREE
Smart Volume Box   is designed to give MetaTrader users a powerful, analytical tool for uncovering the hidden dynamics in the market. This precision-built tool, complete with user-friendly settings, integrates essential volume insights and advanced features like Volume Profile, VWAP (Volume Weighted Average Price), and Point of Control (POC) levels. Unlike typical indicators, Smart Volume Box doesn’t provide specific trade signals but instead offers a clearer perspective on market trends, makin
The Smart Liquidity Profile is color-coded based on the importance of the traded activity at specific price levels, allowing traders to identify significant price levels such as support and resistance levels, supply and demand zones, liquidity gaps, consolidation zones, Buy-Side/Sell-Side Liquidity and so on.  Smart Liquidity Profile allows users to choose from a number of different time periods including 'Auto,' 'Fixed Range,' 'Swing High,' 'Swing Low,' 'Session,' 'Day,' 'Week,' 'Month,' 'Quart
Order Block Tracker is here to solve one of the biggest challenges traders face: identifying order blocks. Many traders fail to spot these critical zones, often missing out on key market entries. But with Order Block Tracker , you no longer have to worry about that. This advanced indicator automatically highlights these crucial zones for you, giving you the confidence to enter the market at the right time. MT5 Version -  https://www.mql5.com/en/market/product/123362/ Key Features of Order Block
Smart Liquidity Levels is a valuable tool for identifying optimal liquidity levels, enabling retail traders like us to strategically set our stop-loss orders. T he essential tool for traders seeking to maximize their trading success.  The liquidity level is a critical component of inner circle trading (ICT). It assists us in determining when and how we should enter the market. Watch the video for detailed instructions. Here's why understanding liquidity levels is crucial in trading and how our
We mark the fair value gap (FVG) and wait for the price to reach that zone, but sometimes it reverses before getting there. This can happen because we didn't notice the Balanced Price Range (BPR). My tools will enhance your analysis by displaying everything on the chart, helping you identify potential price reversal areas so you can make informed decisions about when to enter the market. MT5 -  https://www.mql5.com/en/market/product/119228/ So, what is BPR or Balanced Price Range? A Balanced Pr
Higher Timeframe Chart Overlay will display higher timeframe candles, including the number of candles high/low you specify. You no longer need to switch timeframes to check the candles. Everything can be shown in one chart. MT4 Version :  https://www.mql5.com/en/market/product/115680 Almost everything can be change as you want. You can change/set: - Choose different colors for the body and top/bottom wicks. - Panel's height and width. - The width of the body and wicks - Change background an
The Fibonacci Volatility Bands indicator is a refined tool designed to enhance your market analysis by integrating Fibonacci retracements with the Bollinger Bands concept. This indicator visually highlights potential areas of support and resistance, providing traders with a clearer understanding of price fluctuations and volatility. MT4 Version -  https://www.mql5.com/en/market/product/126421/ The core of the Fibonacci Volatility Bands is built around a Volume Weighted Moving Average (VWMA) that
FREE
This is one of the most popular and highly rated volatility index (VIX) indicators on the market. It provides the same readings as the VIX does for stock indexes. However, this indicator works across all asset classes.  VIX Fix Finds Market Bottoms.  This indicator is not for inexperienced traders. Use it for day and swing trading. MT5 Version -  https://www.mql5.com/en/market/product/112284 Join To Learn Market Depth -   https://www.mql5.com/en/channels/suvashishfx Bernard Baruch summed i
FREE
Trading Notes
Suvashish Halder
5 (3)
Trading Notes is an innovative tool designed for traders to streamline their decision-making process by allowing them to write and display important reminders or short details directly over their trading charts. This essential feature ensures that traders have quick access to their personalized checklist before opening any positions, enhancing their trading efficiency and accuracy. MT5 Version -  https://www.mql5.com/en/market/product/120617 Join To Learn Market Depth -   https://www.mql5.com
FREE
フィルタ:
レビューなし
レビューに返信