Cube Alert MT5 version
- インディケータ
- バージョン: 2.1
- アクティベーション: 5

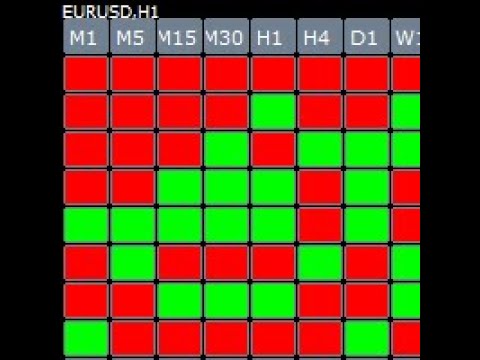
Cube indicator represents the original candle stick chart but in a top down cube form in order to see previous patterns in the markets more
easy. The indicator has build in alert once there is a consecutive 3,4,5 bars in a row you get an message.
Parameters
Bars_Limit = total visible cubes
TF_M1 = true;
TF_M2 = false;
TF_M3 = false;
TF_M4 = false;
TF_M5 = true;
TF_M6 = false;
TF_M10 = false;
TF_M12 = false;
TF_M15 = true;
TF_M20 = false;
TF_M30 = true;
TF_H1 = true;
TF_H2 = false;
TF_H3 = false;
TF_H4 = true;
TF_H6 = false;
TF_H8 = false;
TF_H12 = false;
TF_D1 = true;
TF_W1 = true;
TF_MN1 = true;
Table_Position_X = 20; Horizontal shift
Table_Position_Y = 40; Vertical shift
Table_Font_Size = 8;
Table_Font_Color = clrWhite;
Table_BG_Bullish = clrDodgerBlue;
Table_BG_Bearish = clrDeepPink;
Table_BG_Doji = clrSlateGray;
Table_Cell_Height = 30;
Table_Cell_Width = 60;
Alert_1_Bars = 3; Consecutive candles A
Alert_2_Bars = 4; Consecutive candles B
Alert_3_Bars = 5; Consecutive candles C
Alert_Popup = true; Show popup
Alert_Email = false; Send eMail
Alert_Push = false; Send push-notification
ユーザーは評価に対して何もコメントを残しませんでした