Consolidation Finder MT5
- インディケータ
- バージョン: 1.71
- アップデート済み: 7 10月 2020
- アクティベーション: 5

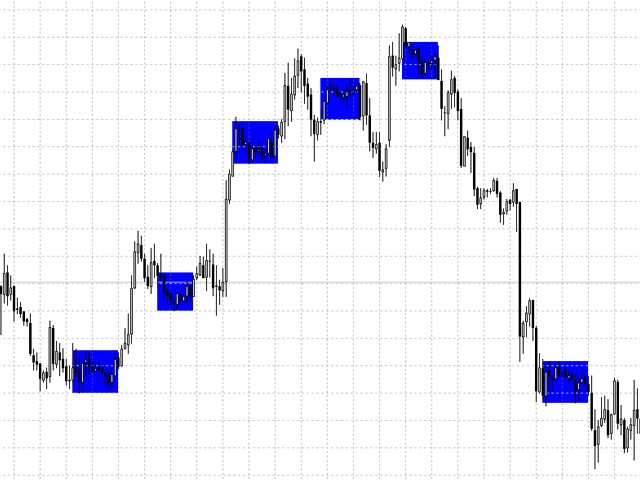
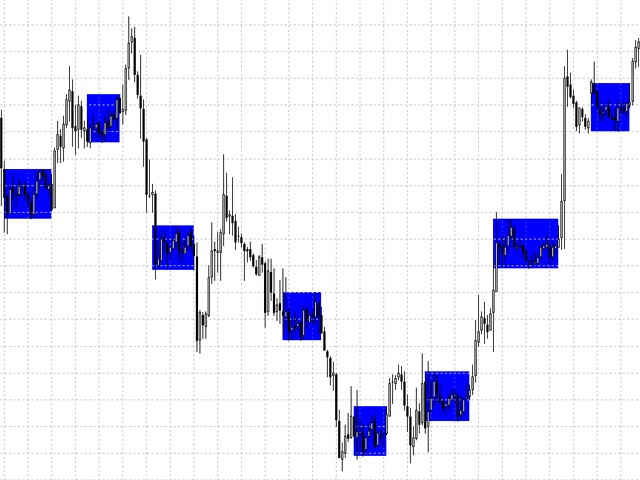
Consolidation Finder
An indicator that allows you to find consolidation. To work on the breakdown of the channel.
Easy to use, there are only three settings:
- Minimum number of bars to analyze
- Tunnel Consolidation
- Indicator color
It works on all timeframes , by default, approximate settings for the H1 timeframe are set.
Works on all currency pairs.
The indicator is not redrawn or recalculated.
All screenshots are real!