RSI Sound Alert plus Email Demo
- インディケータ
- バージョン: 1.3
- アップデート済み: 2 3月 2020

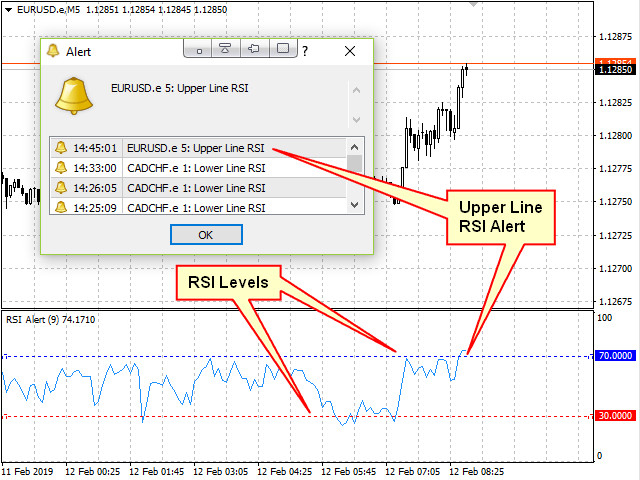
RSI indicator with signal lines, at the intersection of which a corresponding notification will be issued, which can be in the form of a normal alert, or in the form of a user sound file.
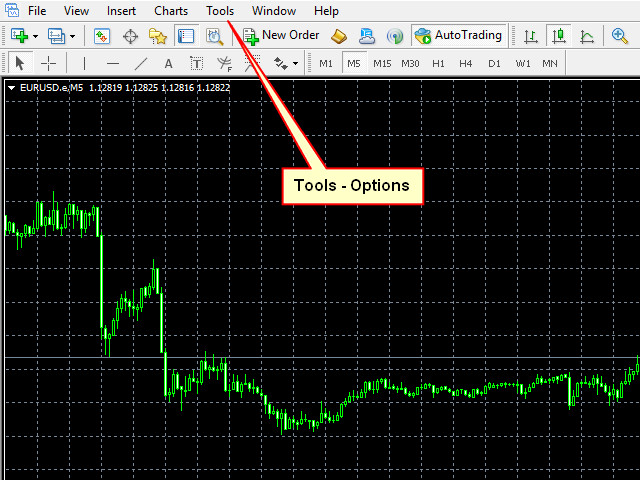
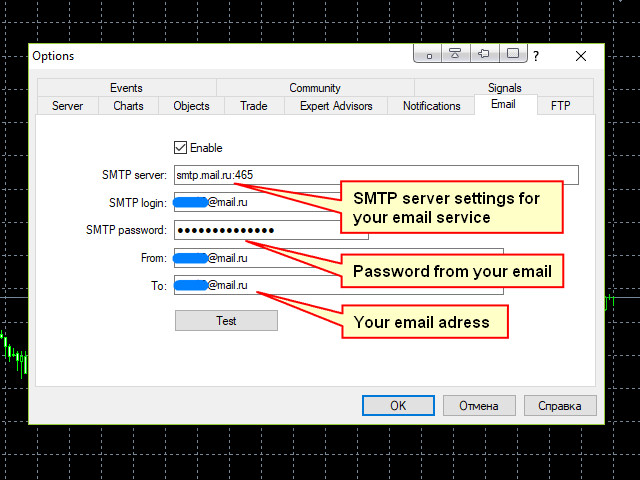
The indicator also has the function of sending push-notifications and email notifications at the intersection of these levels.
The values of the levels can be set independently in the indicator settings, and, if desired, they can be changed and configured directly in the indicator window.
This product is a demo version of the indicator that works on the CADCHF currency pair. The full version of the indicator: https://www.mql5.com/en/market/product/35793
Settings:
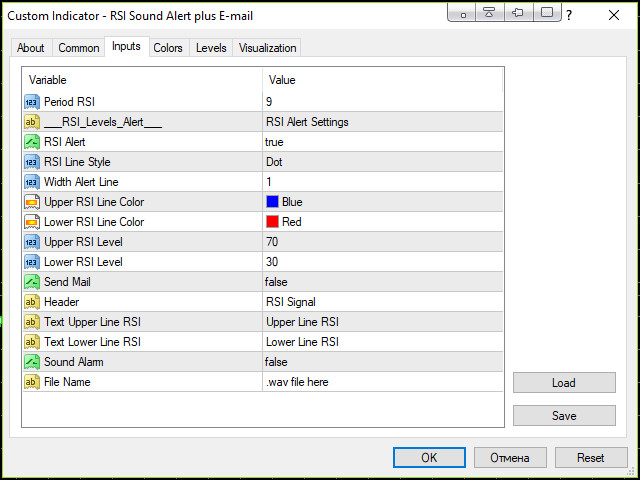
- Period RSI - period RSI;
- RSI Alert - alert when crossing established levels;
- RSI Line Style - line style;
- Width Alert Line - width of lines;
- Upper RSI Line Color - the color of the upper line;
- Lower RSI Line Color - the color of the lower line;
- Upper RSI Level - the value of the upper level;
- Lower RSI Level - the value of the lower level;
- Send Mail - sending notifications to Email;
- Header - message header;
- Text Upper Line RSI - message text when crossing the top level;
- Text Lower Line RSI - message text at the intersection of the lower level;
- Sound Alarm - play a custom sound file when crossing the set levels;
- File Name - the name of the sound file in the format "***.wav". The file itself must be placed in the terminal's Sounds folder;
- Push-notifications - send push-notifications when crossing levels.