Ratio for MT4
- インディケータ
- バージョン: 1.0
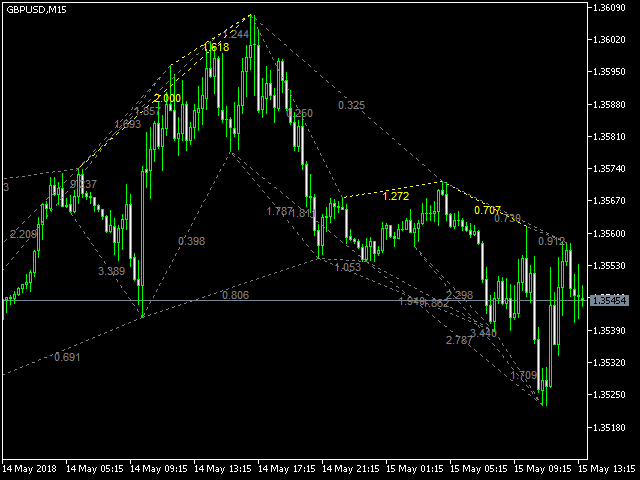
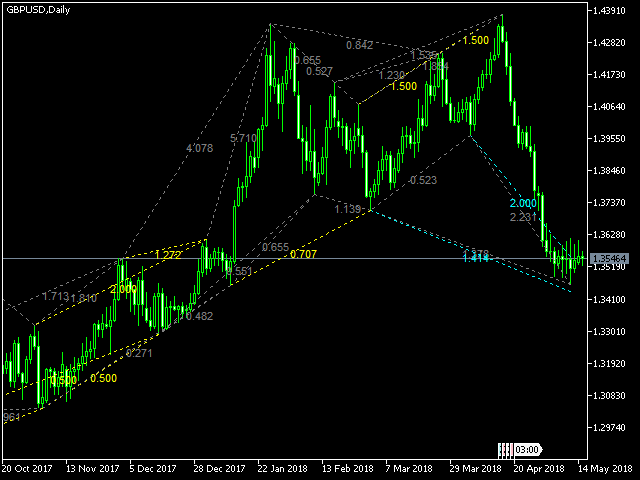
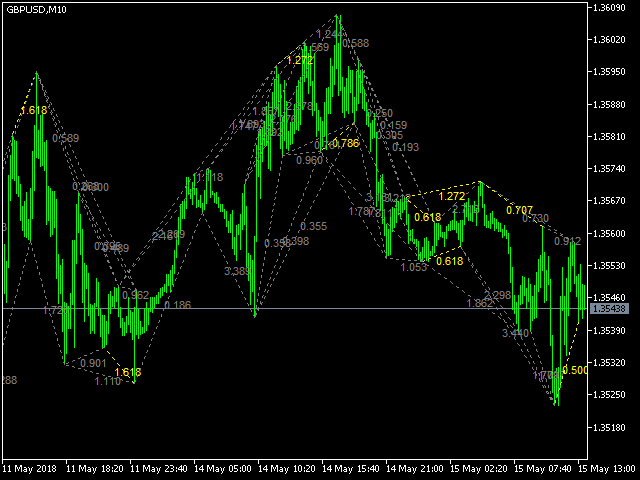
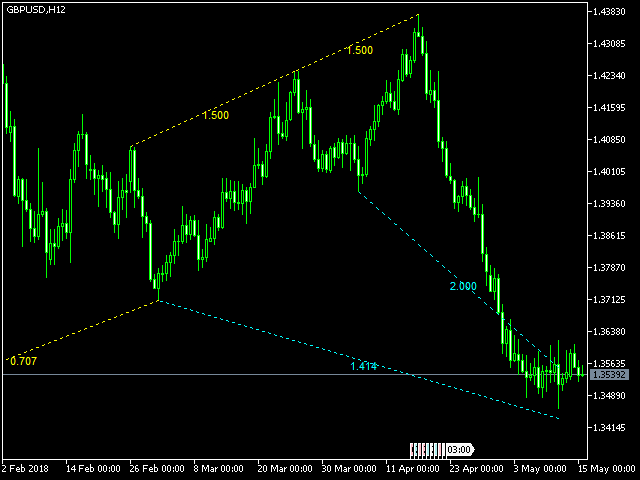
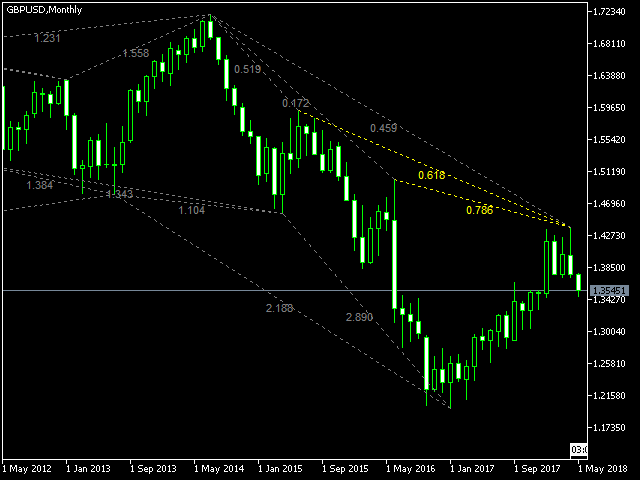
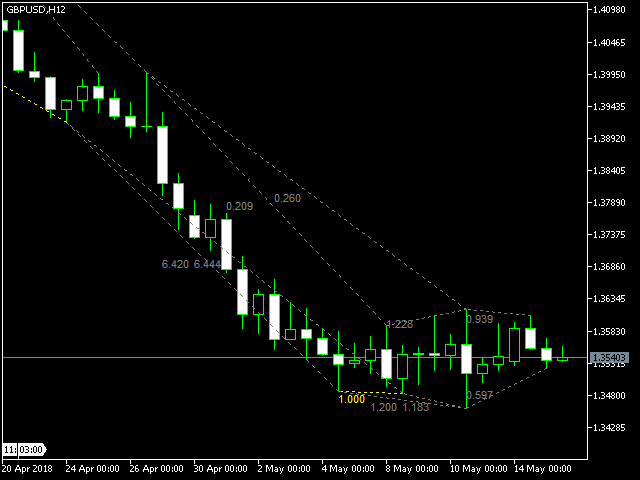
This indicator shows ratios between extremes on the chart.
You can specify your own ratios (e.g. Fibonacci).
Parameters
Most important
- Density - how much in details to search ratios in extremes. Bigger number means less details, smaller number means more details. Base unit is 1 bar on the chart.
- History - how far to go in history while searching. When you set -1, the indicator processes all bars from history. Base unit is 1 bar on the chart.
- Range - how far search ratios from given extreme. Base unit is 1 bar on the chart.
Important
- Default color / Line style / Line width - all found ratios are displayed as lines on the chart. These parameters influence these lines.
- List of positive ratios - list of your own ratios (e.g. Fibonacci), which are searched on the chart, when indicator found positive match, this line is highlighted.
- Color of positive ratios
- Deviation - real ratio vs positive ratio difference. Base unit is %.
- Show last extreme bar only - when you want to check last extreme only (history is hidden).
- Show positive ratios only - when you want to check positive ratios only (all other ratios are hidden).
- Show developing ratios on last bar - when you want to check developing ratios.
- Color of developing ratios
Other
- Your own prefix for objects - all indicator's objects have main prefix "ratio_". When you want to use more than one "Ratio indicator" on the same chart, you should specify special prefix for each indicator. When you want to use only one, you can let this parameter empty.