• 概要
  • レビュー
  • コメント

Custom Dashboard Wizard

Create your Dashboard with few clicks!

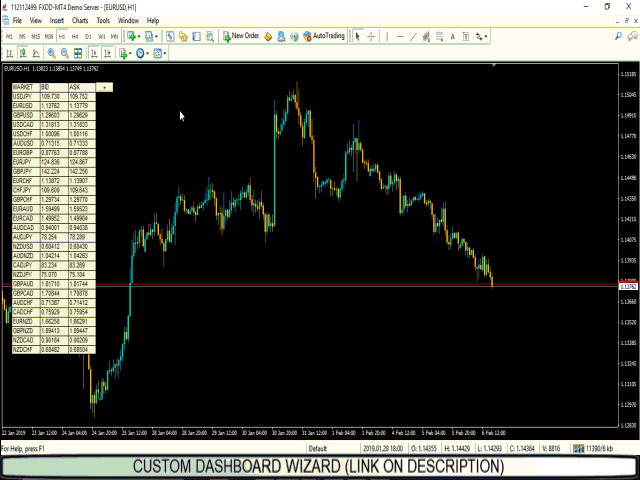
With the Custom Dashboard Wizard you'll be able to create your dashboard also without any programming knowledge. This indicator/panel will give you the possibility to add/remove the values of the Metatrader4 standard indicators in any time frame you like, with any value you like and in any market you like, just be careful about writing the market name exactly as it's written on the list of your Market Watch.

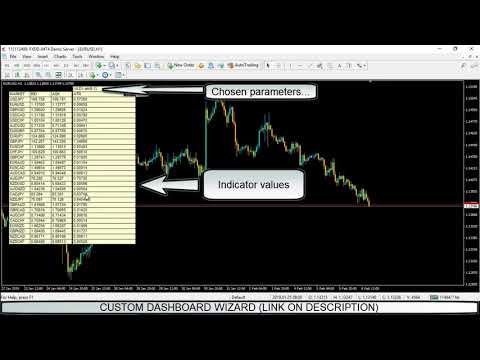
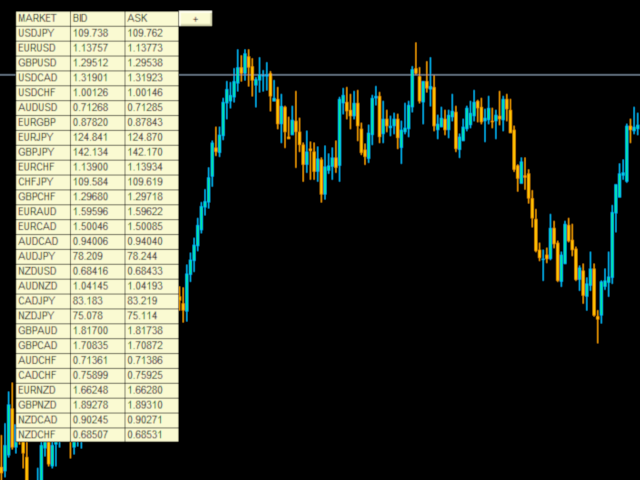
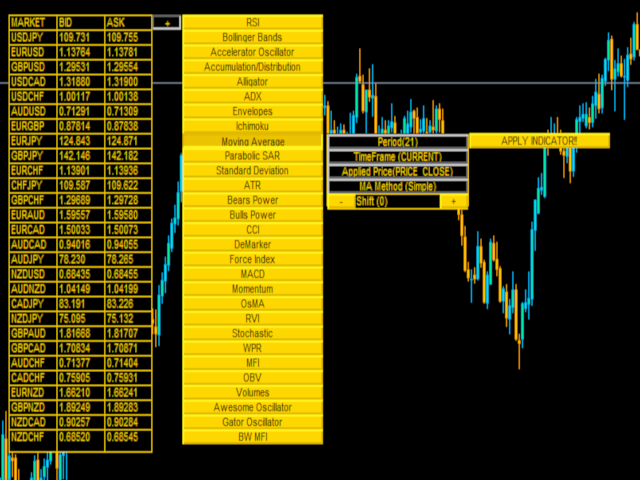
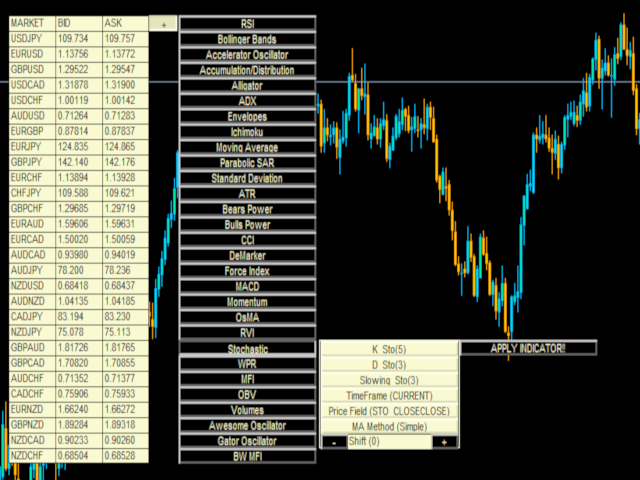
The main panel will be composed of three columns:

  1. Market: analyzed market

  2. Bid: sell price

  3. Ask: Buying price

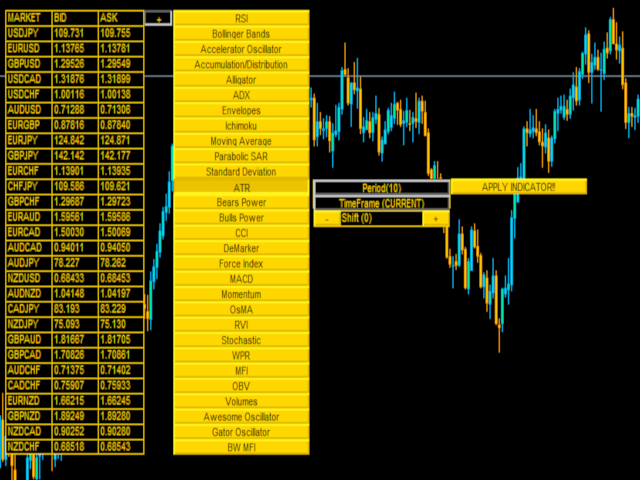
On the right of the main panel you'll notice a button marked with + .

Clicking on it will open a list of buttons representing the platform standard indicators. Now you are able to choose the indicator you like, applying it on the new column on the right, setting all the paramters to apply it after have clicked on the indicator. (please watch the video for more infos).

Once chosen indicator and parameters click on the button "apply indicator"...and there you go!!

The limit of the wievable indicators is given only by the power of your cpu and your monitor!

Once created the new panels with your chosen indicator, you can eraseeach panel simply clicking on the "DEL" button that will be created above on the right

Advantages you get :

Possibility to create your own personalized Dashboard wihtout any programming knowledge!!!

Input parameters:

Graphical Settings:

  • Font Type: Font type to use;

  • Font Size: The size font;

  • BackGround Color: The background color of the panels;

  • Front Color: The front color of the panels;

  • Panel X: Distance (from left to right) of the main panel;

  • Panel Y: Distance (from the top to the bottom) of the main panel;

  • Panel Width:Width of the panel;

  • Panel Height: Height of the panel;

CURRENCIES:

Markets to analyze. As said above, you can analyze any market you want, listed on MarketWatch (up to 60!!).

You'd like to add a Custom Indicator? Contact us and you'll receive your own personalized version!

おすすめのプロダクト
Graphic Shapes -using history, it projects four types of graphical shapes at the moment, allowing you to determine the main ranges of price movement in the future, as well as gives an understanding of the main market reversals, while giving entry points by priority!The panel contains three types of figure sizes expressed by timeframes. They allow you to conduct a complete market analysis without using additional tools! The indicator is a powerful tool for forecasting price movements in the forex
The Trend Analysis Indicator is an innovative tool designed for traders and investors who seek to navigate the complexities of the financial markets with greater precision and insight. This powerful indicator is engineered to adeptly identify whether a market is trending or not, offering users a vital edge in their trading strategy. Key Features: Accurate Trend Detection : The core functionality of the Trend Analysis Indicator lies in its ability to accurately detect market trends. It analyzes p
Market Ticker
John Louis Fernando Diamante
The only Market Ticker on the market! Add a professional novelty to your workspace, with built in mini-charts A scrolling Market Ticker that displays price changes from all symbols in the Market Watch list. Provides an easy snapshot of symbol prices, and keeps scrolling automatically while you trade and analyse the chart. The ticker color (+/- price changes) are based on either the current or completed candle, and the previous candle. Options include: - MTF, eg choose to show price changes
XFlow shows an expanding price channel that helps determine the trend and the moments of its reversal. It is also used when accompanying transactions to set take profit/stop loss and averages. It has practically no parameters and is very easy to use - just specify an important moment in the history for you and the indicator will calculate the price channel. DISPLAYED LINES ROTATE - a thick solid line. The center of the general price rotation. The price makes wide cyclical movements around the
ToolBox 360 is the swiss knife of all indicators. It is full packed with useful tools to help you with your trading. It can be used to find best entry and exit points and help you to decide if you should open a trade or not. It shows market trends, candlestick formations outside / inside bars and you can sett time based allerts. Main features: Time based Fibonacci lines Choose a start and end time and the indicator shows you Fibonacci lines within the selected time range including range high
This is a professional Trend Sim indicator. The intelligent algorithm of the Trend Sim indicator accurately detects the trend, filters out market noise and generates input signals and exit levels. Functions with advanced statistical calculation rules improve the overall performance of this indicator. The indicator displays signals in a simple and accessible form in the form of arrows (when to buy and when to sell). Knowing the entry point of each of the currencies is very important for every
Cancer indicator is great for trend trading! An intelligent indicator algorithm with high probability shows the points of potential market reversal. If you are trading in a trend, then a trading strategy built on the basis of this indicator is perfect for you. The indicator filters out market noise, almost everything and all the necessary functions for working with a thread are built into one tool. It works on all currency pairs and on all timeframes, indicator setting - according to your desire
Oscillator helps determine the direction of the market Shows the direction of the price movement and is painted in the appropriate color. Allows you to conduct trend and counter trend trading It works on all timeframes, on any currency pairs, metals and cryptocurrency Can be used when working with binary options Distinctive features Does not redraw; Simple and clear settings; It works on all timeframes and on all symbols; Suitable for trading currencies, metals, options and cryptocurrency (Bitco
FREE
The Trend Champion indicator works on all timeframes and currency pairs. The indicator should be used as an auxiliary tool for technical analysis, it helps to determine the direction of the trend: either upward or downward price movement for a particular currency pair. Can be used along with oscillators as filters. Trend Champion is a trend indicator. Arrows indicate favorable moments and directions for entering the market. The indicator can be used both for pipsing on small periods and for l
MicroMini FFMV Dashboard+CSM This is a custom indicator created to give Traders a full view of what is going on in the market. It uses a real time data to access the market and display every bit of information needed to make successful trading. To add value to the trading operation, Currency Strength Meter is added to it in order to consolidate the effective work of this indicator. THIS IS A MicroMini size of the FULL FOREX MARKET VIEW DASHBOARD INDICATOR with CSM added. This is for those who
Global Trend Indicator, shows the signals for entry. Displays both entry points and the trend itself. Shows statistically calculated moments for entering the market with arrows. When using the indicator, the risk factor can be optimally distributed. Settings: Uses all one parameter for settings. Choosing a parameter, it is necessary to visually resemble it so that the appropriate graph has a projection of extremes. Parameters: Length - the number of bars for calculating the indicator.
Renko Starは、練行チャートを取引するように設計されたMT4矢印タイプのインジケーターです。このインジケーターには、勝率や獲得ポイントなどの役立つ情報をトレーダーに伝えるバックテストダッシュボードがあり、ATR x乗算のtpとslも提供されます。バーオープンまたはイントラバーのシグナルであり、シグナルが与えられた正確な価格を示す黄色のマークが付いています。このインジケーターの使用方法は、インジケーターが示す矢印に従って買いまたは売りを開始し、tpを設定することです。インジケーターによって与えられる sl や sl も、インジケーターの設定をいじってみると結果が良くなったり最悪になったりするため、信頼できるダッシュボードで良い結果が得られるまでインジケーター設定を変更する必要があります。 このインジケーターは再ペイントまたはバックペイントを行いません パラメーター : atr tp : atrに基づくtp値 atr sl : atrに基づくsl値 atr期間 星期 スターフィルター History : バックテストする履歴の量 スプレッド : 計算にスプレッドを使用した
CANADIAN TAIGAは、ボラティリティーブレイクアウトとサポート/レジスタンスレベルのブレイクアウトの原則に基づいたトレンドフォロー型の取引システムを使用したプロフェッショナルポートフォリオEAです。すべてのカナダドルのペアで動作します。カナディアン・タイガの中核となる原理は、洗練されたヘッジモジュールを使用して、すべてのCADペアで取引機会を捉えることです。 CANADIAN TAIGAをダウンロードして、推奨されているようにすべてのカナダドルペアでテストしてみて、説明されているように意図されていることができない場合は、購入しないでください。主に最低時間枠(M5)で動作するため、モデリングの質の高さはあまり気にしないでください。 自動売買ボタンを無効にした状態でEAをチャート上で起動し、初期化後に自動売買を再度有効にするか、市場の時間外、できれば週末にチャート上で自動売買を有効にすることが非常に重要であり、強く推奨されます。なぜならば、EAは高速実行品質テストを行うために、初期化時に1回の迅速な単一取引(即時のオープンおよびクローズポジション)を実行する可能性があり、お
The Trend Professor is a moving average based indicator designed for the purpose of helping the community of traders to analyse the price trend. The indicator will be displayed in the main chart as it is indicated on the screenshot section. How it works The indicator has lines of moving averages and colored histograms to depict the direction of the trend. There will be a fast signal line colored blue/yellow/red at some points. The red/yellow colored lines stands for bearish trend/signal while th
Power Average
Khurram Mustafa
4.25 (8)
This Indicator is a  affordable trading tool  because with the help of  Popular Developers & Support of M Q L Platform  I have programmed this strategy. I tried to combine logic of  Moving Averages, Parabolic Stop And Reverse, Trend Strength, Oversold, Overbought . Furthermore, I have also care about  Support Resistance  that Trader can easily get in touch with market by selecting one indicator only. What is in for Trader? Trading Modes:  This selection is for  activate whole strategy  "Power
FREE
Indicator for binary options arrow is easy to use and does not require configuration works on all currency pairs, cryptocurrencies buy signal blue up arrow sell signal red down arrow tips do not trade during news and 15-30 minutes before their release, as the market is too volatile and there is a lot of noise it is worth entering trades one or two candles from the current period (recommended for 1 candle) timeframe up to m 15 recommended money management fixed lot or fixed percentage of the depo
Hello Guys! I want to share with you a very useful tools. Anyone of us who has used MT4 for some time knows how impractical this platform can be for discretionary trading. That's why I created this graphical interface!  Interface is very simple, all the info that you need are in the video and in the screenshot. NB: Before to run the EA Interface, remember to copy the file in the comment in your MT4 folder "Controls". PATH: .../MQL4/INCLUDE/CONTROLS NB: unfortunately the interface can't be t
My new system... This is not a regular channel. Who is it for: - For people who want to understand the market. Tested and used in the real market (I use and not just encodes) Important !!! The system requires thinking. Only for real traders. If you are looking for a holy grail - please don't bother me. Is it possible? Trading has never been so easy. A combination of fibonacci and an intelligent channel plus levels of support and resistance. Setting out a channel is now very easy.
Targets
Jose Miranda Ramos
5 (1)
Targets is an indicator to determine potential turning  points , targets  are calculated to determine levels in which the sentiment of the market could change from "bullish" to "bearish." This indicator can be used in any timeframe and any currency pair: IN CASE YOU DON'T SEE THE INDICATOR WHEN YOU ADD IT TO YOUR CHARTS JUST OPEN THE INDICATOR MENU AND CLOSE THE MENU AGAIN PLEASE TAKE NOTICE: For best results use this indicator as an extra tools after you have completed your regular analysis an
FREE
Calculated trend indicator, can be used with an optimal risk to profit ratio, shows successful signals. Uses two options for settings. Shows favorable moments for entering the market with arrows. The probability of a successful trend is not very bad! The indicator can be used both for pipsing on small periods, and for long-term trading. The indicator does not redraw and does not lag. It works on all currency pairs and on all timeframes.
Ema Dashboard is an innovative dashboard that allows you to monitor Moving Average on multiples symbols and different timeframes. This dashboard allows you to analyze information on 28 pairs on an unique chart. Its functionality includes analysis of All Time Frames. This configuration allows you to identify the Long Term Trend with extreme ease. This panel allows you to take very important directional movements. A click on button opens a new chart (symbol and timeframe). Graphic Object Symbol
Algo Trading Indicaor  With this indicator , you’ll have zones and trends that hight probability the price will reverse from it. so will gives you all the help that you need  Why should you join us !?  1-This indicator is logical since it’s working in previous days movement , to predict the future movements. 2-Algo trading indicator will help you to draw trends which is special and are too strong than the basics trend , trends will change with the frame time that you work on . 3-We can
What Is Currency StrengtT Indicator? A currency strengthT indicator is a graphical tool that shows the strength of a currency. Common indicators usually show the strength of a currency in relation to another currency, however, with some calculations it is possible to find the absolute strength of each individual currency. Therefore, a currency strength matrix indicator (or meter) is a tool that tries to express the absolute strength of a currency, so that you can compare this strength with
SSA stands for ' Singular Spectrum Analysis '. It combines elements of classical time series decomposition, statistics, multivariate geometry, dynamical systems and signal processing. SSA decomposes time series into a sum of components (ETs), with each component representing a lower smoothing, using several SVD ( Singular Value Decompositions ). It is a powerful filtering process used in many fields of research (climatology, biomedical, aerospace, etc), where high quality forecasting and smoo
️️ Attention:      The price will soon be raised to what it was before ($500).      Please go to the comments to see daily signals charts from the indicator. And contact me on tel gram to show you how it work.       No more losses with this indicator, test it for years ago and see if there is losses in one day results. but before testing it please see the explaining video down here.    FxBears Powers is working on all forex pairs, metals, commodities, futures, indices, energies, crypto, and ev
The Omega Trend Oscillator is a trend indicator based on Moving averages and Bollinger bands. I made it simple for you to have easy and soft market analysis approach. The indicator can be used for the following purpose. 1. For trend analysis 2. For determining the overbought and oversold market condition 3. For discovering market selling and buying opportunities.  Meaning of colors on the indicator FOR BULLISH MARKET (Buy) 1. Lime color is for bullish market/trend 2. Blue color is for very
PowerXXX
Marco Fornero Monia
PowerXXX measures the power of the current candlestick and displays it in numerical format and colors. The indicator can cover multiple timeframes and can be placed on the main chart or on the charts of the underlying indicators. The number of timeframes is selectable, as well as the color levels according to the power expressed. In the latest version, the power can be expressed as a function of the opening of the candle itself or as a function of the opening of the total candles before. There
Heaven Assistant: Simplify Your MT4 Management Simplify the management of the MetaTrader 4 (MT4) platform with the Heaven Assistant . This Expert Advisor (EA) is a robust tool that allows you to control and customize your trading environment in an efficient and user-friendly manner. Key Features: Multiple Pairs Opening: Quick access to most currency pairs, both major and minor, plus exotic pairs. The ability to open indices, metals, and cryptocurrencies with a single click. Template Change: Easi
This indicator calculates the strength of the major currencies (EUR, USD, CAD, GBP, CHF, NZD, USD, JPY) and shows the top 4 strongest currency pairs that are currently in a high probability trend for the day or for the week. Usage The indicator displays 8 currency pairs with a trend direction (e.g. "EURUSD-DOWN") and ranked according to strength, with 1 being ths strongest. There will be 4 pairs for intraday and 4 pairs for intraweek If a currency pair is present in the top 4 intraday, it is i
「一目均衡表」の専門的な使い方は、一目均衡表を正しく解釈してグラフを分析することです! はトレーダーが価格グラフ上の指定された点間の比率を素早く簡 単に測定できるようにするグラフィックプログラムです。この時間と価格の指標は、MT4 プラットフォームの一目の戦略に従って図表を分析するための基本的なツールです。この ツールを使用すると、 非常に短期間での価格波だけでなく、時間波の洞察に満ちた完全な 分析も可能になります。分析の実行に費やされる労力は、エクセルを使用して実行される 同様の測定および計算と比較して、何度も最小限に抑えられます。指標は、一目均衡表戦 略を使用するトレーダーの知識と経験、およびそれらの期待を考慮して設計されています。 提示されたツールは私たちの仕事の結果です。 指標のモジュール構造により、論理的な順序で分析を実行できます。このプロセスは過去 の波に関するデータを収集することから始まり、それが将来の市場の動きを計算するため の基礎となります。 計算で考慮されるデータは、予測の正確さにとって非常に重要です。 この操作は最小限に抑えられ、即座に測定値が得られます。 この測
このプロダクトを購入した人は以下も購入しています
まず第一に、この取引インジケーターは再描画されず、再描画されず、遅延しないことを強調する価値があります。これにより、手動取引とロボット取引の両方に理想的なものになります。 アトミックアナリストは、価格の強さとモメンタムを利用して市場でより良いエッジを見つけるためのPA価格アクションインジケーターです。ノイズや誤ったシグナルを除去し、取引ポテンシャルを高めるための高度なフィルターを備えています。複雑なインジケーターの複数のレイヤーを使用して、アトミックアナリストはチャートをスキャンし、複雑な数学的計算をシンプルなシグナルと色に変換します。これにより、どのような初心者トレーダーでも理解して使用し、一貫した取引の決定を行うことができます。 「アトミックアナリスト」は、新規および経験豊富なトレーダー向けにカスタマイズされた包括的な取引ソリューションです。プレミアムインジケーターとトップノッチの機能を1つの取引戦略に組み合わせ、すべてのタイプのトレーダーにとって汎用性のある選択肢にします。 デイリートレーディングとスキャルピング戦略:高速で正確なデイトレーディングおよび短期トレード
TPSpro TRENDPRO  - is a trend indicator that automatically analyzes the market and provides information about the trend and each of its changes, as well as giving signals for entering trades without redrawing! The indicator uses each candle, analyzing them separately. referring to different impulses - up or down impulse. Exact entry points into transactions for currencies, crypto, metals, stocks, indices!  -  Version MT5               DETAILED DESCRIPTION        /       TRADING SETUPS           
ご紹介   クォンタム トレンド スナイパー インジケーターは 、トレンド反転を特定して取引する方法を変革する画期的な MQL5 インジケーターです。 13年以上の取引経験を持つ経験豊富なトレーダーのチームによって開発されました。     クォンタムトレンドスナイパーインジケーター   は、非常に高い精度でトレンドの反転を識別する革新的な方法で、あなたのトレーディングの旅を新たな高みに押し上げるように設計されています。 ***Quantum Trend Sniper Indicatorを購入すると、Quantum Breakout Indicatorを無料で入手できます!*** クォンタム ブレイクアウト インジケーターは、トレンドの反転を特定するとアラートを発し、矢印を示し、3 つのテイクプロフィットレベルを提案します。 初心者トレーダーにもプロのトレーダーにも適しています。 量子EAチャネル:       ここをクリック MT5のバージョン:       ここをクリック 推奨事項: 期間: すべての時間枠。最良の結果を得るには、
A key element in trading is zones or levels from which decisions to buy or sell a trading instrument are made. Despite attempts by major players to conceal their presence in the market, they inevitably leave traces. Our task was to learn how to identify these traces and interpret them correctly. Reversal First Impulse levels (RFI)   -  Version MT5                INSTRUCTIONS                 RUS                 ENG                                       R ecommended to use with an indicator   -  
現在26%オフ 初心者やエキスパートトレーダーに最適なソリューション! このインジケーターは、独自の機能と新しい計算式を取り入れた、ユニークで高品質、かつ手頃な価格のトレーディングツールです。たった1枚のチャートで28の為替ペアの通貨強度を読み取ることができます。新しいトレンドやスキャルピングチャンスの引き金となるポイントを正確に特定することができるので、あなたのトレードがどのように改善されるか想像してみてください。 ユーザーマニュアルはこちら  https://www.mql5.com/en/blogs/post/697384 これが最初の1本、オリジナルだ! 価値のないクローンを買わないでください。 特別な サブウィンドウの矢印で強い通貨の勢いを表示 GAPがあなたのトレードを導く! 基準通貨や気配値が売られすぎ・買われすぎのゾーン(外相フィボナッチレベル)にあるとき、個別チャートのメインウィンドウに警告表示。 通貨がレンジの外側から反落した場合、プルバック/リバーサルのアラート。 クロスパターンの特別なアラート 複数の時間枠を選択可能で、トレンドを素早く
現在20%OFF! 初心者やエキスパートトレーダーのためのベストソリューション! このダッシュボードソフトウェアは、28の通貨ペアで動作しています。それは私達の主要な指標(高度な通貨の強さ28と高度な通貨インパルス)の2に基づいています。それは全体の外国為替市場の大きい概観を与えます。それは、すべての(9)時間枠で28の外国為替ペアのための高度な通貨の強さの値、通貨の動きの速度と信号を示しています。チャート上で1つのインディケータを使用して市場全体を観察し、トレンドやスキャルピングの機会をピンポイントで見つけることができたら、あなたのトレードがどのように改善されるか想像してみてください。 このインディケータには、強い通貨と弱い通貨の識別、潜在的な取引の識別と確認がより簡単になるような機能が搭載されています。このインディケータは、通貨の強さや弱さが増加しているか減少しているか、また、すべての時間枠でどのように機能しているかをグラフィカルに表示します。 新機能として、現在の市場環境の変化に適応するダイナミックなマーケットフィボナッチレベルが追加され、すでに当社のAdvan
Advanced Supply Demand
Bernhard Schweigert
4.92 (310)
現在33%オフ 初心者にもエキスパートトレーダーにも最適なソリューション このインジケーターは独自の機能と新しい公式を多数内蔵しており、ユニークで高品質かつ手頃な取引ツールです。このアップデートでは、2つの時間枠ゾーンを表示できるようになります。より長いTFだけでなく、チャートTFとより長いTF(ネストゾーンを表示)の両方を表示できます。すべてのSupply Demandトレーダーの皆さんのお気に召すはずです。:) 重要情報の公開 Advanced Supply Demandの可能性を最大化するには、 https://www.mql5.com/ja/blogs/post/720245 にアクセスしてください。   エントリーまたはターゲットの正確なトリガーポイントを正確に特定できれば取引がどのように改善されるか想像してみてください。新しい基盤となるアルゴリズムに基づいて構築されているため、買い手と売り手の間の潜在的な不均衡をさらに簡単に特定できます。これは、最も強い需要と供給のゾーンと、過去のパフォーマンス(古いゾーンを表示)がグラフィカルに表現されるためです。これらの機能は、最適
TrendMaestro
Stefano Frisetti
5 (2)
note: this indicator is for METATRADER4, if you want the version for METATRADER5 this is the link: TRENDMAESTRO recognizes a new TREND in the bud, he never makes mistakes. The certainty of identifying a new TREND is priceless. DESCRIPTION TRENDMAESTRO identifies a new TREND in the bud, this indicator examines the volatility, volumes and momentum to identify the moment in which there is an explosion of one or more of these data and therefore the moment in which prices have strong probability of f
驚異的なFXインジケーター「Miraculous」をご紹介します。完璧な結果を得るための1時間足を含むすべてのタイムフレームで効果的に機能する、最強の強力な特殊MT4フォレックスインジケーターです。 すべてのタイムフレームで優れた結果を提供する最高のFXインジケーターを探し続けるのに疲れましたか?これ以上探す必要はありません!「Miraculous」フォレックスインジケーターをご紹介します。このインジケーターは、トレーディングの経験を変革し、収益を新たなレベルに引き上げるために設計されました。 先進のテクノロジーと長年にわたる緻密な開発に基づいて構築された「Miraculous」フォレックスインジケーターは、FX市場における力と正確さの頂点となります。この素晴らしいツールは、すべてのレベルのトレーダーのニーズを満たすように設計されており、一貫した収益性を追求する上で比類のない優位性を提供します。 「Miraculous」フォレックスインジケーターの他との違いは、その非常に適応性にあります。デイトレーダー、スウィングトレーダーであろうと、長期ポジションを好む方であろうと、このインジケータ
mql5と Telegramの モーニング・ブリーフィングで、詳細とスクリーンショットを含む毎日のマーケット・アップデートをご覧 ください! FX Power MT4 NGは 、長年の人気を誇る通貨強度計FX Powerの次世代モデルです。 この次世代ストレングスメーターは何を提供するのでしょうか?初代FXパワーの魅力すべて プラス GOLD/XAUの強さ分析 より正確な計算結果 個別に設定可能な分析期間 カスタマイズ可能な計算上限値により、さらに優れたパフォーマンスを実現 もっと見たい人のための特別なマルチインスタンス設定 すべてのチャートでお好みの色を無限に設定可能 数え切れないほどの通知オプションにより、重要なことを見逃すことはありません。 Windows 11とmacOSのスタイルで角を丸くした新しいデザイン 魔法のように動くインジケーターパネル FXパワーの主な機能 すべての主要通貨の強さの完全な履歴 すべての時間枠における通貨の強さの履歴 すべてのブローカーとチャートで同一の計算結果 100%信頼できるリアルタイム計算 -> リペイントなし ドロップダウン・リストから
これはMT4のインジケーターで、再描画なしで取引に参入するための正確なシグナルを提供します。 外国為替、暗号通貨、金属、株式、インデックスなど、あらゆる金融資産に適用できます。かなり正確な見積もりを提供し、取引を開始して終了するのに最適な時期を教えてくれます。1つのシグナルを処理しただけでインジケーターの元が取れた例の 動画 (6:22)をご覧ください。Entry PointsPro インジケーターの助けを借りたほとんどのトレーダーの最初の1週間の結果が改善しています。 Telegramグループ に登録してください。Entry Points Proインジケーターのメリットは次の通りです。 再描画のないエントリーシグナル 再描画されるインジケーターでは一度表示されたシグナルが削除されて大きな金銭的損失につながることがありますが、これと異なり、表示されて確認されたシグナルは消えることがありません。 エラーなしの取引開始 インジケーターアルゴリズムによって取引を開始する(資産を売買する)理想的な瞬間を見つけることができます。それを使用するすべてのトレーダーの成功率が向上します。
ご紹介     Quantum Breakout PRO は 、ブレイクアウト ゾーンの取引方法を変革する画期的な MQL5 インジケーターです。 13年以上の取引経験を持つ経験豊富なトレーダーのチームによって開発された Quantum Breakout PROは 、革新的でダイナミックなブレイクアウトゾーン戦略により、あなたの取引の旅を新たな高みに押し上げるように設計されています。 クォンタム ブレイクアウト インジケーターは、5 つの利益ターゲット ゾーンを備えたブレイクアウト ゾーン上のシグナル矢印と、ブレイクアウト ボックスに基づいたストップロスの提案を提供します。 初心者トレーダーにもプロのトレーダーにも適しています。 量子EAチャネル:       ここをクリック MT5バージョン:   ここをクリック 重要!購入後、インストールマニュアルを受け取るためにプライベートメッセージを送ってください。 推奨事項: 時間枠: M15 通貨ペア: GBPJPY、EURJPY、USDJPY、NZDUSD、XAUUSD アカウントの種類: ECN、Raw、また
SALE NOW! Limited Time Offer! An exclusive indicator that utilizes an innovative algorithm to swiftly and accurately determine the market trend. The indicator automatically calculates opening, closing, and profit levels, providing detailed trading statistics. With these features, you can choose the most appropriate trading instrument for the current market conditions. Additionally, you can easily integrate your own arrow indicators into Scalper Inside Pro to quickly evaluate their statistics and
FX Volume
Daniel Stein
4.6 (35)
mql5と Telegramの モーニング・ブリーフィングで、詳細とスクリーンショットを含む毎日のマーケット・アップデートをご覧 ください! FX Volumeは、ブローカーの視点から市場のセンチメントをリアルに洞察する、最初で唯一の出来高インジケーターです。 ブローカーのような機関投資家が外国為替市場でどのようなポジションをとっているか、COTレポートよりもはるかに速く、素晴らしい洞察を提供します。 この情報をチャート上で直接見ることは、あなたの取引にとって真のゲームチェンジャーであり、画期的なソリューションです。 以下のようなユニークなマーケットデータ洞察から利益を得てください。 比率は 、通貨のロングポジションとショートポジションの比率をパーセントで表示します。 比率の変化は 、選択した期間内のロング比率とその変化率を表示します。 Volumes Totalは 、通貨の取引量(ロングとショート)の合計をロット単位で表示します。 Volumes Long :全通貨のロングポジションの取引量を表示します。 Volumes(ショート )は、全通貨のショートポジションの取引量を表示
Cycle Sniper
Elmira Memish
4.41 (34)
NEW YEAR SALE PRICE FOR LIMITED TIME!!! Please contact us after your purchase and we will send you the complimentary indicators to complete the system Cycle Sniper is not a holy grail but when you use it in a system which is explained in the videos, you will feel the difference. If you are not willing to focus on the charts designed with Cycle Sniper and other free tools we provide, we recommend not buying this indicator. We recommend watching the videos about the indiactor and system before pu
このインジケータは、手動および自動的な方法でチャートに描かれたハーモニックパターンを検出します。ユーザーマニュアルは、このリンクから参照できます: あなたのレビューを追加し、入手するために私たちに連絡してください。 この製品をmt4で試すための無料版があります。 GartleyおよびNenstarパターンを検出するために使用できます。 https://www.mql5.com/en/market/product/30181 完全なMT4バージョンを購入するには、次の場所から購入できます。 https://www.mql5.com/en/market/product/15212 注 インジケータにはコントロールパネルがあり、すべての(チャート&時間枠)設定が保存されます。チャート上でスペースをより多く確保するために、最小化することができ、他の分析ツールで作業する場合は、すべてのインジケータデータを非表示にするために閉じるボタンを押すことができます。 このインジケータを使用して設定を変更し、移動平均やボリンジャーバンドなどのインジケータを追加すると、編集のテンプレートが自動的に保存され、必
TakePropips Donchian Trend Pro
Eric John Pajarillaga Aldana
4.82 (17)
TakePropips Donchian Trend Pro   (MT4) は、ドンチャン チャネルを使用してトレンドの方向を自動的に検出し、エントリーとエグジットの取引シグナルを提供する強力で効果的なツールです! この多機能インジケーターには、トレンド スキャナー、取引シグナル、統計パネル、スクリーナー、取引セッション、およびアラート履歴ダッシュボードが含まれます。取引シグナルを提供し、チャートを分析する時間を節約するように設計されています! ユーザー マニュアルとインストール ガイドは、ブログ投稿 (   https://www.mql5.com/en/blogs/post/751368   ) からダウンロードできます。 今日は 50% オフ! 98ドルから49ドルに値下げ! このインジケーターは、ストラテジー テスターでテストできます (ビジュアル モードを有効にします)。ライブ チャートでテストしたい場合は、7 日間の試用版を入手するようにメッセージを送ることもできます。 詳細については、説明の下にあるビデオ チュートリアルも利用できます。 ご不明な点やサポートが必
今、147ドル(いくつかの更新後に499ドルに増加します) - 無制限のアカウント(PCSまたはMac) RelicusRoad ユーザー マニュアル + トレーニング ビデオ + プライベート Discord グループへのアクセス + VIP ステータス 市場の新しい見方 RelicusRoad は、外国為替、先物、暗号通貨、株式、および指数の世界で最も強力な取引インジケーターであり、トレーダーに収益を維持するために必要なすべての情報とツールを提供します。初心者から上級者まで、すべてのトレーダーが成功するためのテクニカル分析と取引計画を提供します。これは、将来の市場を予測するのに十分な情報を提供する重要な取引指標です。意味をなさないチャート上のいくつかの異なる指標ではなく、完全な解決策を信じています.これは、信号、矢印 + 価格アクション情報を表示するオールインワンのインジケーターで、他に類を見ない非常に正確です。 強力な AI に基づいて、RelicusRoad は不足している情報とツールを提供して、あなたを教育し、トレーディングのプロ、成功したトレーダーにします。
Step into the realm of Forex trading with confidence and precision using XQ, a cutting-edge Forex indicator designed to elevate your trading game to unprecedented heights. Whether you're a seasoned trader or just stepping into the world of currency exchange,   XQ Forex Indicator   empowers you with the insights and signals needed to make informed trading decisions. The signal conditions are a combination of three indicators, and XQ Forex Indicator only display  medium and long-term trends . The
ON Trade Waves Patterns Harmonic Elliot Wolfeをご紹介します。これは手動および自動の方法を使用して市場のさまざまなパターンを検出するために設計された高度なインジケーターです。以下はその動作方法です: ハーモニックパターン: このインジケーターは、チャートに表示されるハーモニックパターンを識別できます。これらのパターンは、Scott Carneyの「Harmonic Trading vol 1および2」で説明されているように、ハーモニックトレーディング理論を実践するトレーダーにとって重要です。手動で描画するか、自動検出に頼るかにかかわらず、ON Trade Waves Patternsがお手伝いします。 コントロールパネル: このインジケーターはユーザーフレンドリーなコントロールパネルを備えています。チャートと時間枠の設定を保存し、異なる構成間をスムーズに切り替えることができます。チャートスペースを最大限に活用するために最小化することもできます。他の分析ツールで作業することを好む場合、閉じるボタンをクリックするだけで、すべてのインジケーターデ
現在20%OFF! 初心者やエキスパートトレーダーに最適なソリューションです。 このインディケータは、エキゾチックペア・コモディティ・インデックス・先物など、あらゆるシンボルの通貨の強さを表示することに特化したインディケータです。金、銀、原油、DAX、US30、MXN、TRY、CNHなどの通貨の強さを表示するために、9行目にどのシンボルでも追加することができます。独自の機能を多数搭載し、新しい計算式を採用したため、ユニークで高品質、かつ手頃な価格のトレーディングツールとなっています。新しいトレンドやスキャルピングチャンスのトリガーポイントを正確に把握することができるため、あなたのトレードがどのように改善されるか想像してみてください。 ユーザーマニュアル:ここをクリック   https://www.mql5.com/en/blogs/post/708876 すべての時間枠に対応します。あなたはすぐにトレンドを見ることができるようになります! 新しいアルゴリズムに基づいて設計されているため、潜在的な取引の特定と確認がより簡単になります。これは、8つの主要通貨と1つのシンボ
Th3Eng PipFinite PRO Indicator This product is distinct from the Th3Eng PipFinite Original, utilizing a different logic and algorithms. The Th3Eng PipFinite Pro indicator offers analysis of trend directions using custom algorithms. It provides indications of trend direction, entry points, a stop loss point, and three take profit points. The indicator also displays pivot points, dynamic support and resistance channels, and a side-box with detailed current signal information. How to Trade with
This Indicator does not repaint itself at all, it's identifies a new TREND in the bud, this indicator examines the volatility, volumes and momentum to identify the moment in which there is an explosion of one or more of these data and therefore the moment in which prices have strong probability of following a new TREND. CandleBarColorate never misses a beat, he always identifies a new TREND in the bud without error. This indicator facilitates the reading of charts on METATRADER; on a single wi
Ultimate Sniper Dashboard
Hispraise Chinedum Abraham
4.84 (25)
299ドルで割引中! 今後値上げの可能性あり! 下の説明を読んでください! 究極のスナイパーダッシュボードのための最高のエントリーシステム。究極のダイナミックレベル。(私の製品をチェックしてください) 究極のスナイパーダッシュボードはMT4多通貨テスト制限のため、ライブマーケットでのみ作動します。 究極のスナイパーダッシュボードをご紹介します。HA-Sniper、MA-Sniper、その他多くの特別なモードが含まれる最高の製品です。究極のスナイパーダッシュボードは絶対的な獣です! 初心者やエキスパートトレーダーにとって最高のソリューションです。もう二度と動きを見逃さない! シンプルさとピップを愛するトレーダーのために、特別な製品をご用意しました。シンプルでありながら、ダッシュボードは複数のカスタムアルゴリズムに基づき28の通貨ペアを監視し、すべての作業を行います。たった一つのチャートで、プロのように市場を読み解くことができます。もし、為替ペアが動き出したときに、その方向性を正確に特定することができれば、あなたの取引はどれほど改善されることでしょう。   当社のシ
もちろんです。以下は、提供いただいたテキストの日本語への翻訳です: MT4用の天文学指標をご紹介します:究極の天体トレーディングコンパニオン トレーディング体験を天空の高みに高める準備はできていますか?私たちの革命的なMT4用の天文学指標をご紹介します。この革新的なツールは、複雑なアルゴリズムの力を借りて、類まれなる天文学的洞察と精密な計算を提供します。 あなたの指先で宇宙の情報を: 宝のような天文学的データが明らかになる包括的なパネルをご覧ください。惑星の地理的/太陽中心座標、太陽と地球の距離、星の大きさ、伸び、星座、黄道座標および赤道座標、さらには水平座標まで、それぞれが綿密に計算され美しく表示されています。指標によって生成される垂直線は時間値に対応し、トレーディングの旅に宇宙の視点を提供します。 惑星のラインと関係: グラフを飾る惑星のラインの魔法を体験し、スケールと角度をカスタマイズできます。直感的なコントロールパネルを介して各惑星のラインの表示を簡単に切り替えることができます。指定された時刻範囲内での合会、六分会、四分会、三分会、対会、逆行の指標で天体の関係の芸術を発見してく
このインディケータは、当社の2つの製品 Advanced Currency IMPULSE with ALERT  +   Currency Strength Exotics . のスーパーコンビネーションです。 このインジケーターは全ての時間枠で作動し、8つの主要通貨と1つのシンボルの強弱のインパルスをグラフで表示します。 このインジケータは、金、エキゾチックペア、商品、インデックス、先物など、あらゆるシンボルの通貨強度の加速度を表示することに特化されています。金、銀、原油、DAX、US30、MXN、TRY、CNHなどの通貨強度の加速度(インパルスまたは速度)を表示するために、任意のシンボルを9行目に追加できる、この種の最初のものです。 新しいアルゴリズムに基づいて構築され、潜在的な取引の特定と確認がさらに容易になりました。これは、通貨の強さや弱さが加速しているかどうかをグラフィカルに表示し、その加速の速度を測定するためです。加速すると物事は明らかに速く進みますが、これはFX市場でも同じです。つまり、反対方向に加速している通貨をペアリングすれば、潜在的に利益を生む取
現在20%OFF! このダッシュボードは、複数のシンボルと最大9つのタイムフレームで動作するソフトウェアの非常に強力な部分です。 このソフトは、弊社のメインインジケーター(ベストレビュー:Advanced Supply Demand)をベースにしています。    Advanced Supply Demand ダッシュボードは、素晴らしい概要を提供します。それは示しています。  ゾーン強度評価を含むフィルタリングされた需給値。 ゾーン内/ゾーンへのPips距離。 ネストされたゾーンがハイライトされます。 選択されたシンボルの4種類のアラートを全ての(9)時間枠で提供します。 それはあなたの個人的なニーズに合わせて高度に設定可能です。 あなたの利益! すべてのトレーダーにとって最も重要な質問です。 市場に参入するのに最適なレベルはどこか? 成功のチャンスとリスク/リターンを得るために、強力な供給/需要ゾーン内またはその近くで取引を開始します。 損切りの最適な位置はどこですか? 最も安全なのは、強力な供給/需要ゾーンの下/上にストップを置くことで
Price Action Entry Alerts
Stephen Sanjeeve Sahayam
5 (3)
このインジケーターは、売買圧力についてすべてのバーをスクリーニングし、最大量の 4 種類のローソク足パターンを特定します。次に、これらのローソク足はいくつかの線形フィルターを使用してフィルター処理され、買いまたは売りのシグナルが表示されます。シグナルは、より高い時間枠の方向と組み合わせて、取引量が多い時間帯に取引される場合に最も効果的に機能します。すべてのフィルターはカスタマイズ可能で、独立して動作します。ボタンをクリックするだけで単一方向の信号を表示できます。 このインジケーターには、意思決定プロセスに役立つ最も重要な価格アクションとスマート マネーの概念も組み込まれています。 シグナルとトレードに関する教育をすべて 1 つのツールにまとめました。 特徴: 信号は再描画されません。 飲み込むキャンドル、拒否キャンドル、拡張範囲キャンドル、ピンバーを識別します。 有効なシグナルごとに複数のエントリー、ストップロス、複数のテイクプロフィットレベルを表示します。 大容量セッションでフィルタリングします。 サポート/レジスタンスレベルとローソク足の構造でフィルターします。 MACD ヒ
The indicator is designed to work on any trading platform. The program is based on proprietary algorithms and W.D.Ganna's mathematics, allowing you to calculate target levels of price movement based on three points with the highest degree of certainty. It is a great tool for stock trading. The indicator has three buttons: NEW - call up a triangle for calculation. DEL - delete the selected triangle. DELS - completely remove all constructions. The probability of achieving the goals is more than 80
MonsterDash Harmonic Indicator is a harmonic pattern dashboard. It recognizes all major patterns. MonsterDash is a dashboard that displays all detected patterns for all symbols and (almost) all timeframes in sortable and scrollable format. Users can add their own user defined patterns . MonsterDash can open and update charts with the pattern found. Settings MonsterDash's default settings are good enough most of the time. Feel free to fine tune them to your needs. The color settings are for tho
作者のその他のプロダクト
With this indicator you'll have a general reading of the market's range using Gann's calculating modes. Gann's swing is used to have a quick reading to the market latest movements at first glance. The foundation of this swing calculation is in the count of candles in relation to the break-up and break-down of the price. When the price breaks-up the last maximum, the swing will get traced if a certain number of candles is exceeded from the last minimum. It can be used a "pure Gann" or not: If set
Read Elliott wave principle automatically. With the Swing Reader, you can easily read the Elliott Wave Principle through an automatic system. With swing, we mean a ZigZag market that is created by a breakout of its standard deviation. You can set the deviation manually, or you can let the indicator do it automatically (setting the deviation to zero). Advantages you get Never repaints. Points showing a horizontal line, in which statistically a long wave ends. Candles showing a vertical line in
Trade with Gann on your side!! MASTER CIRCLE 360 CIRCLE CHART, originally created by Gann admitted that this is “The Mother of all charts”. It is one of the last studies that this great trader left for us. The numeric tab le is apparently quite simple like all the tables and is based on square numbers, the SQUARE OF 12 and is by evolution, one of the most important square numbers. Here we can find CYCLE, PRICE AND TIME thanks to angles and grades, to show past and future support and resistance.
Currencies Cleaner  panel will give you an overview of all the most traded market's currencies in a single click. First of all the panel will refresh all your charts, opening them four times in all timeframes needed. 1 - CURRENCIES It uses a complex algorithm to study the movement of 17 different indicators. It means that the algorithm not only "reads" the actual value of an indicator, but also creates a probability of success using the position of this value on the indicator and the last move
FREE
This software will give you the possibility to do different things (both in live markets and in strategy tester) . You'll have at your disposal 5 operative panels, each one of these have buttons that let you interact easily at market: 1. Opened Orders Manager (screenshot 1): 6 buttons: Close all buy orders. Close all sell orders. Close all orders. Close all profitable buy orders. Close all profitable sell orders. Hedge orders. 2. Stop Orders Manager (screenshot 1): 2 informative sections: Nume
Currencies Cleaner panel will give you an overview of all the most traded market's currencies in a single click. First of all the panel will refresh all your charts, opening them four times in all timeframes needed. 1 - CURRENCIES It uses a complex algorithm to study the movement of 17 different indicators. It means that the algorithm not only "reads" the actual value of an indicator, but also creates a probability of success using the position of this value on the indicator and the last movem
Stay updated with Multicurrency Overview!! The algorithm of this EA releases an average of the movement percentage of all the Forex currencies linked to a single currency, isolating it, letting us to comprehend its real and specific trend. Above on the left, a panel show us efficiently the trend of the currency, in the timeframe actually used. The second panel will keep you updated on macroeconomic news. P.N.:The news time is based on your pc clock time, this way you won't have any problem r
This software will give you the possibility to preset your management strategy (both in live markets and in strategy tester). You will have at your disposal 8 operative buttons. 4 for Buy positions (from left to right): Buy at market. Buy limit. Buy stop. Set buying time. 4 for Sell positions: Sell at market. Sell limit. Sell stop. Set selling time. After you have decided one of the 4 options you can easily preset: Lot size. Stop loss, both in points and average volatility (D1 timeframe). Ta
Easily access to a deep knowledge of the market movement with "M.M. Deepness Arrows"!! This indicator will give you advices on buys and sells after having analized the deepness of the market. The entrance "trigger" will be given after studying each candles' max and min avoiding, this way, the misleading data released by the opening and closure prices (given by the brokers). Thanks to the use of these arrows you'll be able to easily understand if i'ts the right time to buy or sell. If you want th
Easily and rapidly access to the average range of all the markets with "A.R. Dashboard"!! This professional multi-timeframe indicator will show you the average range of all desired markets (till 50) with one click!!  Choose the number of bars to calculate the average range and this indicator will show you, automatically, this average range in points of the chosen markets for each timeframe. You'll have at your disposal two panels: AR Dashboard : Main panel. Notifications Settings : Here you can
Welcome all to the famous Gann's "Square Of 9"!! This method was used by one of the best traders in the history, a person who made his way among the top traders. An "Holy Grail" for whoever wants to learn trading. The "Square of 9" was used by this genius to find the market's future supports and future resistances. Nowadays is possible to find them with just a click, thanks to softwares. At the time Gann was using just his set of square and goniometer!! Gann describes, partially, the tecnique on
This indicator will allow you to evaluate single currency linear regression. WHAT IS LINEAR REGRESSION?(PIC.3) Linear regression is an attempt to model a straight-line equation between two variables considering a set of data values. The aim of the model is to find the best fit that can serve the two unknown values without putting the other at a disadvantage. In this case, the two variables are price and time, the two most basic factors in the Forex market. Linear regression works in such a wa
This indicator will let you have at disposal Gann's Eighth, with few clicks!! Gann's Eighth were used by this great Trader to obtain the maximum fluctuation price and the possible inversion points of it. Gann have always given importance to the number 8 in his studies, an it is the reason why we find the retracement points as 0.25(10/8=1.25). Other than the number 8, also the numer 3 had is own importance in Gann, number founded in the eighth division, infact we have three eighth describing the
Read Elliott wave principle automatically. With the Swing Reader, you can easily read the Elliott Wave Principle through an automatic system. With swing, we mean a ZigZag market that is created by a breakout of its standard deviation. You can set the deviation manually, or you can let the indicator do it automatically (setting the deviation to zero). Advantages you get Never repaints. Points showing a horizontal line, in which statistically a long wave ends. Candles showing a vertical line in
フィルタ:
レビューなし
レビューに返信