MM Currencies Linear Regression
- インディケータ
- バージョン: 1.0
- アクティベーション: 20

| This indicator will allow you to evaluate single currency linear regression. |
|---|
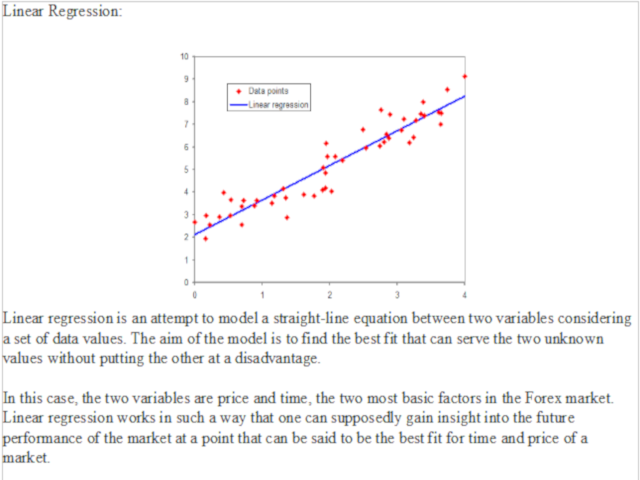
WHAT IS LINEAR REGRESSION?(PIC.3)
Linear regression is an attempt to model a straight-line equation between two variables considering a set of data values. The aim of the model is to find the best fit that can serve the two unknown values without putting the other at a disadvantage.
In this case, the two variables are price and time, the two most basic factors in the Forex market. Linear regression works in such a way that one can supposedly gain insight into the future performance of the market at a point that can be said to be the best fit for time and price of a market.
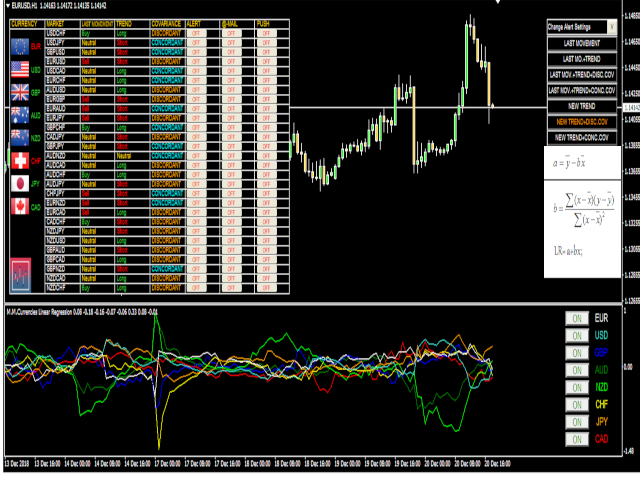
You will be able to see the linear regression for each individual currency that you want, switching between them using the ON/OFF buttons in the indicator sub window.
The Indicator is divided into three main parts:
LAST MOVEMENT;
TREND;
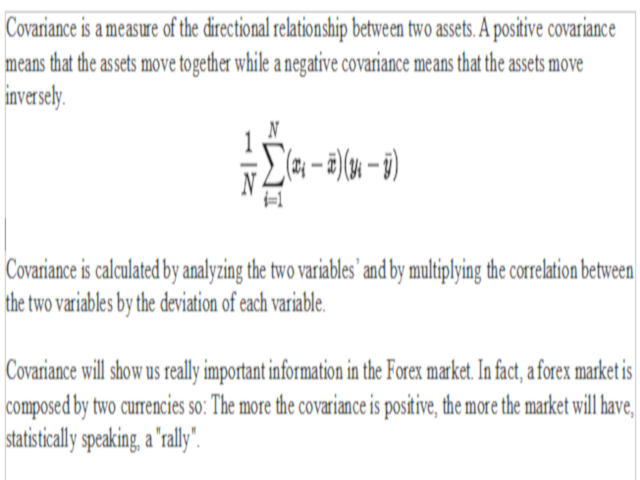
COVARIANCE;(PIC.4)
Here the indicator will tell you if the last movement of calculated linear regression for a new candle was discordant between two currencies in the forex market. If in the case that it was concordant, i.e. Euro rising up and US dollar rising up, the last movement for currency pair EURUSD will be neutral. In case Euro is rising up and US dollar is moving down, the last movement will be a buy, in the opposite situation the last movement will be a sell.
The Trend column is given by a single currency linear regression value. If the Euro value is bigger than the US dollar value, EURUSD trend will be long, and in the opposite situation EURUSD trend will be short.
The third part is about covariance between two currencies. When the covariance is discordant we have more possibilities to enter in a market which is starting a new trend, but we are augmenting the risk per position. When there is covariance in a concordant market we will have a higher probability of a rally before starting a real trend, so fewer probabilities to continue the last movement, but less risk per position too.
On the first column you will be able to see the last movement of a particular currency thanks to the coloration based on what you will choose in the input parameters.
On the upper right of the chart you have the “Change Alert Settings Menu”. You will be able to customize your notifications, and you will be able to choose between 7 notification options:
Last Movement: You will receive an alert on every new bar if there will be a new buy or a sell signal.
Last Mov.+Trend: You will receive an alert on every new bar if there will be a new buy or a sell signal confirmed by the trend column.
Last Mov.+Trend+discordant covariance: You will receive an alert on every new bar if there will be a new buy or a sell signal confirmed by the trend column and discordant covariance.
Last Mov.+Trend+concordant covariance: You will receive an alert on every new bar if there will be a new buy or a sell signal confirmed by the trend column and concordant covariance.
New Trend: You will receive an alert when the trend column is changed.
New Trend+discordant covariance: You will receive an alert when the trend column is changed and covariance column is showing discordant.
New Trend+concordant covariance: You will receive an alert when the trend column is changed and covariance column is showing concordant.
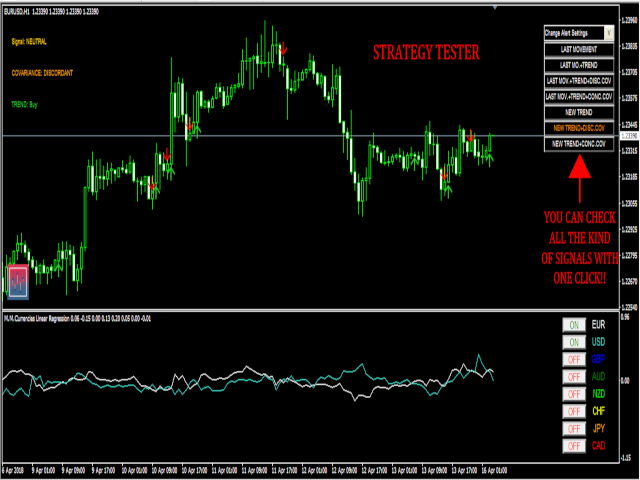
Using the Indicator on Strategy Tester:
During back test you will be able to choose the kind of signal you want to receive seeing differences by the signals thanks to up arrows and down arrows and choosing the "alert" kind with the same menu that you'd have on the live version above on the right.
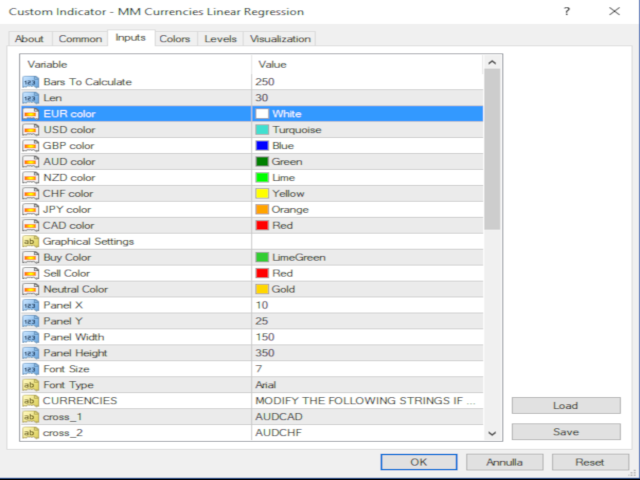
Input parameters:
Bars To Calculate;
Len: Bars to calculate linear regression;
EUR color;
USD color;
GBP color;
AUD color;
NZD color;
CHF color;
JPY color;
CAD color;
Graphical Settings:
Buy Color;
Sell Color;
Neutral Color;
Panel X: Choose the pixel distance to apply the main panel (from left to right);
Panel Y: Choose the pixel distance to apply the main panel (from up to down);
Panel Width: Choose you favourite width for the main panel;
Panel Height: Choose you favourite height for the main panel;
Font Size: Choose you favourite font size for the main panel;
Font Type: Choose you favourite font type for the main panel;
Finally, you'll be able to change the markets name if your personal broker uses any particular names with prefix or suffix.