Trend Signal Multitimeframe mt5 FREE
- インディケータ
- バージョン: 1.5
- アップデート済み: 20 12月 2018

Free version. Only works on EURUSD
Do you want to always know in a quick glance where price is going? Are you tired of looking back and forth between different timeframes to understand that?
This indicator might just be what you were looking for.
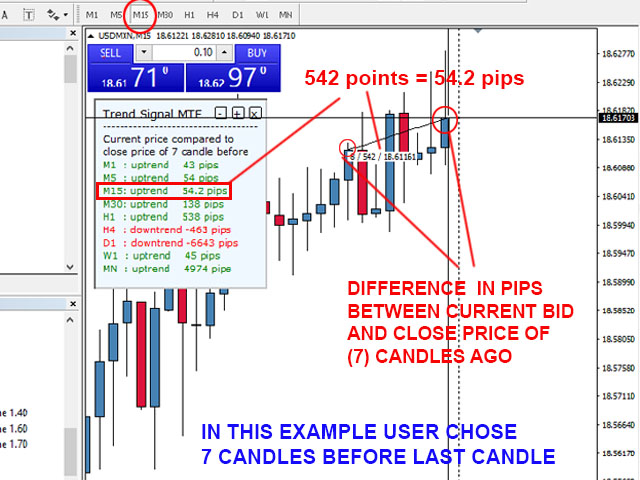
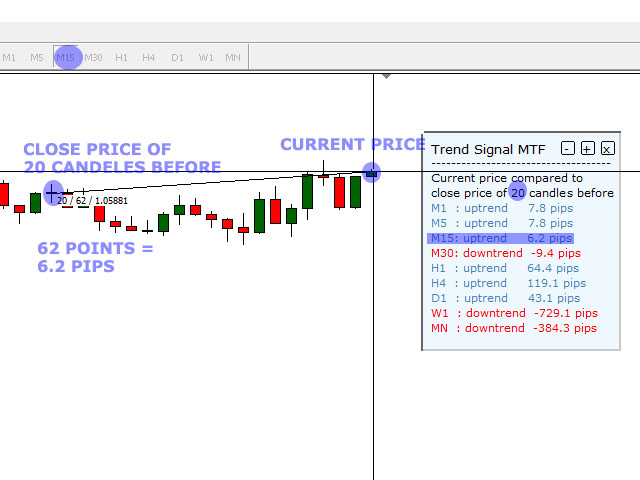
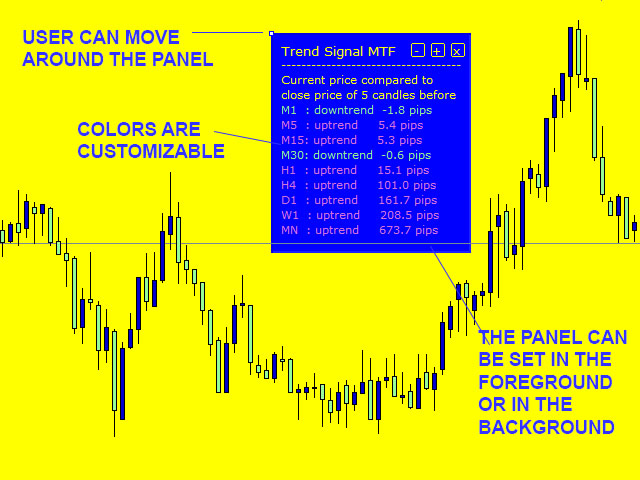
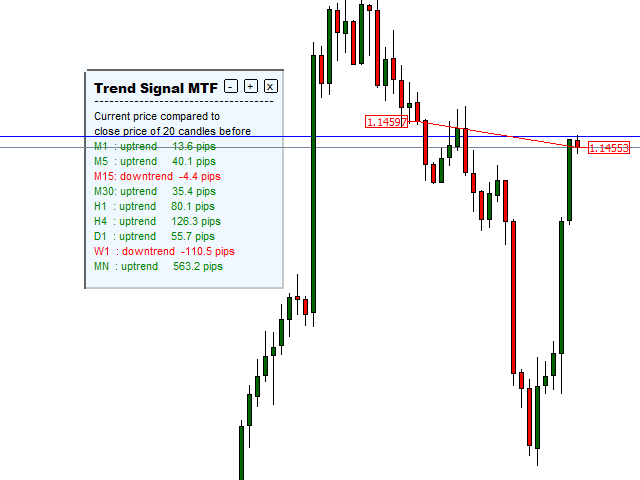
Trend Signal Multitimeframe shows you if the current price is higher or lower than N. candles ago, on the various timeframes. It also displays how many pips higher or lower current price is compared to N. candles ago.
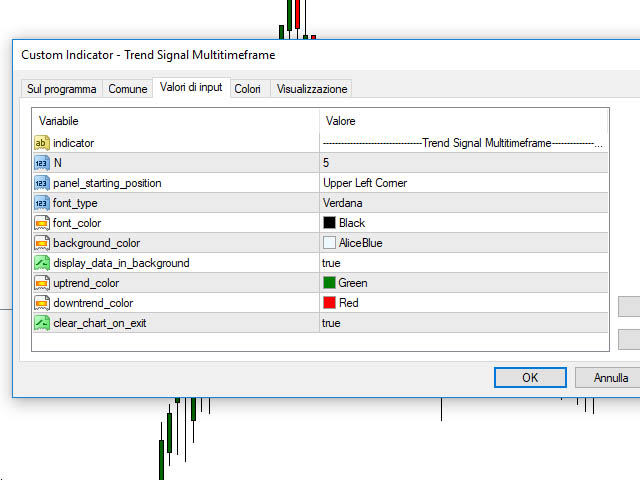
- Number N. is customizable
- The data is shown in a window that you can move around.
- Colors are also customizable.
- You can also choose if you want data to be shown in foreground or background compared to the chart candles.
Settings
- N: Number of the candle of reference
- panel_starting_position: Position on the screen where you want data to first appear
- font_type: Font of the writings
- font_color: Color of the main writings
- background_color: Background color of the data displayed
- display_data_in background: if false, data will cover the candles on the chart
- uptrend_color: Color of the writings when trend is up
- downtrend_color: Color of the writings when trend is down
- clear_chart_on_exit: Select true if you want data to disappear on indicator close


I like it. It is accurate. I´d prefer to have the option to display -or not- the current price and the price of the ¨N¨ candle