Notifications outside of Bollinger bands MT4
- インディケータ
- バージョン: 1.4
- アップデート済み: 1 7月 2022
- アクティベーション: 5

Notifications outside of Bollinger Bands:
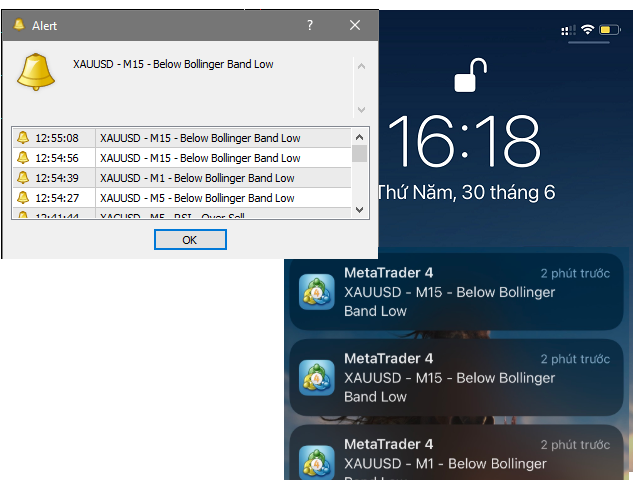
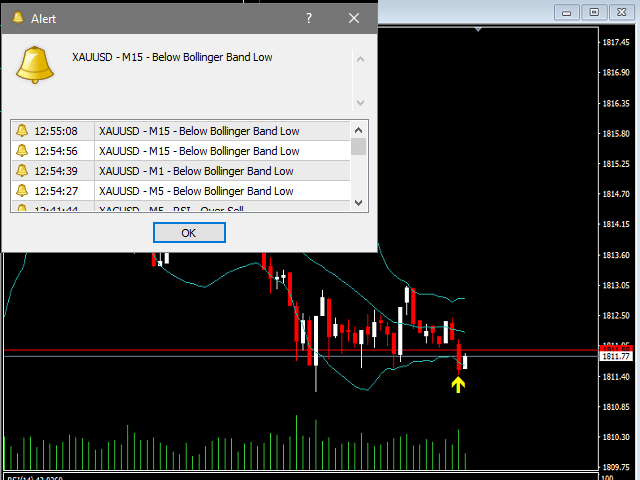
Send phone Notification and window alerts when price breaks out of Bollinger bands Low & High.
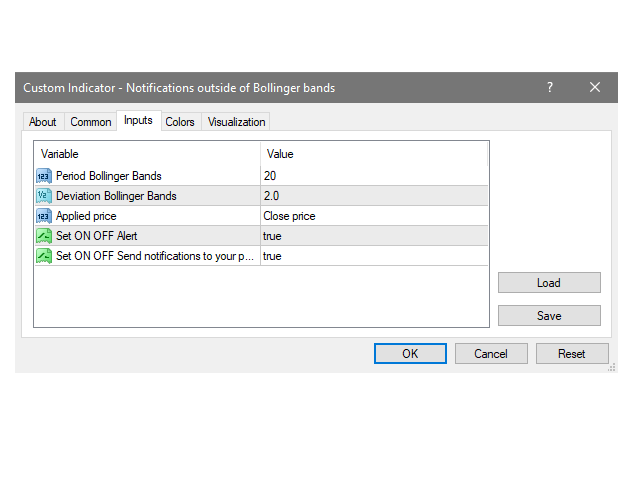
You can set the value Alert, Notification.
And On OFF Alert on Terminal, Notification on Smartphone.
Notifications - Client Terminal Settings - MetaTrader 4 Help
How to Setup MT4/MT5 Mobile Alerts Right to Your Phone (forexschoolonline.com)