Jade Dragon

3.33

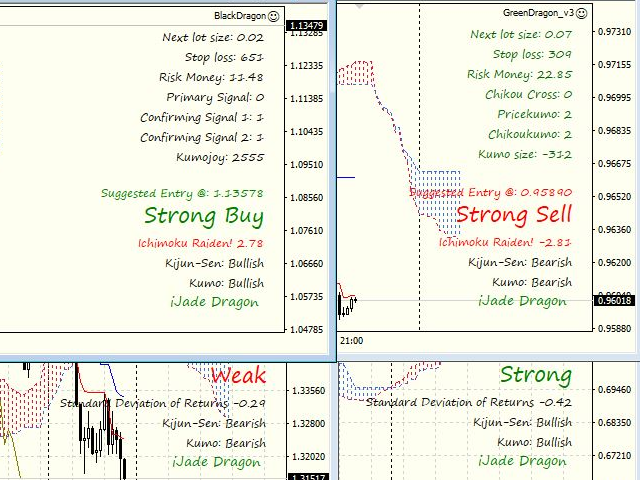
This simple indicator takes information from Ichimoku Kinko Hyo to establish strong and weak currencies to pair together for ideal trending situations. It also generates buy or sell signals based on the standard deviation of returns together with currency strength.

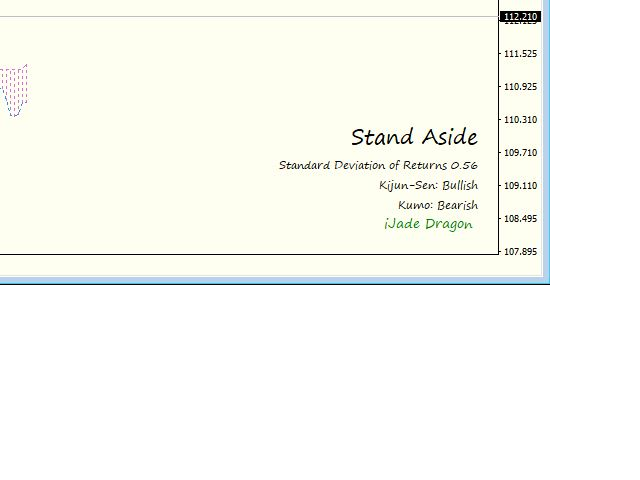
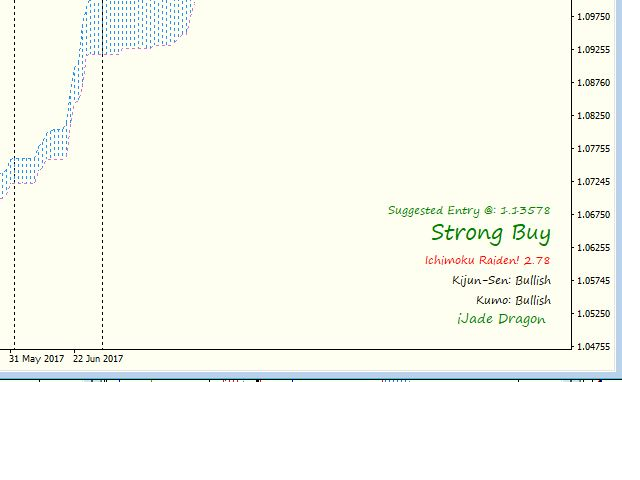
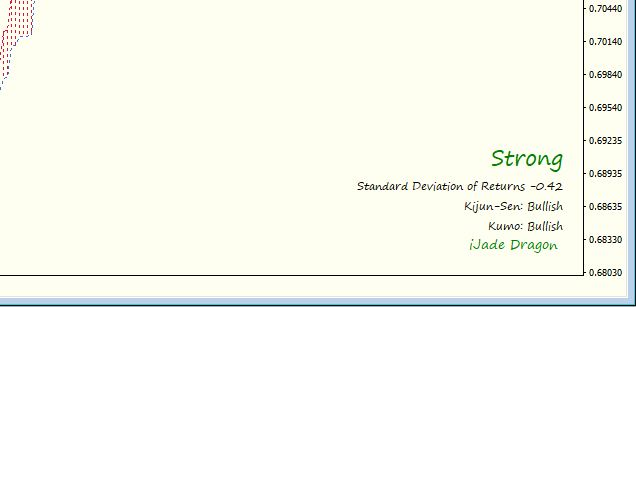
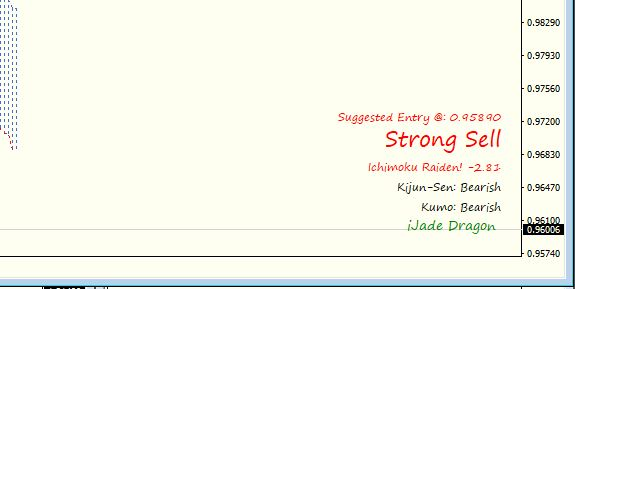
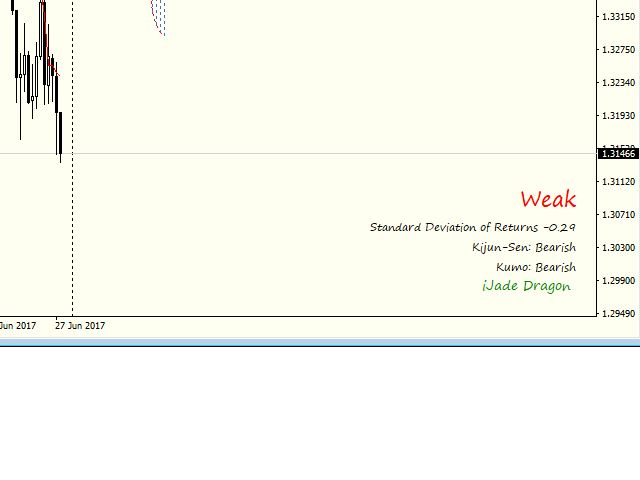
A currency is said to be strong or weak depending on where the price is in relation to two factors: if the price is above the daily kumo and above the 26 day Kijun-sen, it is said to be strong. Likewise, when trading below the daily kumo and below the Kijun-sen it is weak, and by matching a strong and a weak pair together there is a better chance of capturing a trend or a strong move.

In certain situations when the price is strong or weak and a large daily return occurs, it generates a buy or sell signal with a suggested entry price. These large moves are traditionally called Ichimoku Raiden, or "Lightning Strike" because of the visual artifact that is created by the Ichimoku kinko hyo indicator. The visual my be just an artifact but the spike in returns is not. In currencies (as opposed to equities), when there is a return greater than 1.5 times the standard deviation of returns, the price tends to continue rather than revert to the mean, giving an opportunity to trade the continuation. The signal is calculated by taking the prior days returns, adjusting for volatility of the returns of the last twenty days, and dividing by the standard deviation. This gives a ratio of the returns to standard deviation and anything over 1.5 generates the trade signal. The indicator is coded to use daily values, so you can put it on any timeframe and it will still use daily values.

The best way to use the indicator is by attaching it to multiple currencies trading against a common currency, such as EURUSD, GBPUSD, USDJPY, USDCHF, USDCAD, AUDUSD, NZDUSD... By using the same base currency, you can see which currency is strong or weak relative to USD. Then you can take a strong and weak pair to trade the cross. After choosing strong/weak pairs, you can then use Ichimoku trading to establish and manage your trades. The Green Dragon EA and the Black Dragon EA are excellent EAs to use with the Jade Dragon indicator. You can attach them on all the charts you use the Jade Dragon on and activate them when a signal is generated.

レビュー 5
вano30061960 Томин
53
вano30061960 Томин 2021.07.01 16:56 
 

Качество на хорошо 60 - 65 % из десяти , Спасибо Mick Prate за качество .

おすすめのプロダクト
Free informative Indicator-helper. It'll be usefull for traders who trade many symbols or using grid systems (Averaging or Martingale). Indicator counts drawdown as percent and currency separate. It has a number of settings: Count deposite drawdown according equity value and send e-mail or notifications to user if DD more than set; Sending e-mail when max open orders reached; Shows price and remaining pips amount before MarginCall on current chart and Account generally; Display summary trade lot
FREE
Discover the power of precision and efficiency in your trading with the " Super Auto Fibonacci " MT4 indicator. This cutting-edge tool is meticulously designed to enhance your technical analysis, providing you with invaluable insights to make informed trading decisions. Key Features: Automated Fibonacci Analysis: Say goodbye to the hassle of manual Fibonacci retracement and extension drawing. "Super Auto Fibonacci" instantly identifies and plots Fibonacci levels on your MT4 chart, saving you tim
FREE
価格波形パターン MT4へようこそ --(ABCD パターン)--     ABCD パターンは、テクニカル分析の世界で強力で広く使用されている取引パターンです。 これは、トレーダーが市場での潜在的な売買機会を特定するために使用する調和的な価格パターンです。 ABCD パターンを使用すると、トレーダーは潜在的な価格変動を予測し、いつ取引を開始および終了するかについて十分な情報に基づいた決定を下すことができます。 EA バージョン :   Price Wave EA MT4 MT5バージョン: Price Wave Pattern  MT5 特徴 :  ABCDパターンの自動検出。 強気パターンと弱気パターン。  任意のシンボルと任意の時間枠で機能します。 主要なレベルと価格目標。 カスタマイズ可能な設定と繊維レベルの調整。 アラートと通知。 今後さらに多くの機能が追加される予定です。 
FREE
GTAS STrend
Riviera Systems
4.5 (2)
GTAS S-Trend is a momentum indicator that helps to determine trends using combination of MACD, RSI and moving averages. This indicator was created by Bernard Prats Desclaux, proprietary trader and ex-hedge fund manager, founder of E-Winvest. Description The indicator oscillates between -65 and +65 with a neutral zone between -25 and +25 around a 0 equilibrium line. S-Trend between -25 and +25 indicates congestion zones with a bullish bias between 0 and +25, and a bearish bias between 0 and -25.
FREE
Sentinel Arrow 主な機能: ⊗トレンド、反転、そしてモメンタムの変化を迅速かつ正確に特定する独自のアルゴリズム。 ⊗プロフェッショナル向けに設計されており、遅延や誤更新を排除する堅牢なシグナルロジックを備えています。 ⊗様々な時間枠に対応しています。 ⊗過去のシグナルを再描画、削除、または変更することはありません。 ⊗すべての買いシグナルと売りシグナルはローソク足自体に生成され、固定されたままです。 ⊗実際の取引では、シグナルの再描画は行われず、シグナルはローソク足自体に即座に表示されます。 ⊗安定性、正確性、柔軟性を保証します。 ⊗高い勝率のシグナルを提供します。 ⊗各シグナルは一度だけトリガーされ、重複はありません。 ⊗すべての通貨ペア、指数、株式、FX、貴金属、暗号通貨に適しています。 ⊗トレンドトレード、スイングトレード、反転確認。 ⊗信頼性が高く明確なプロフェッショナルシグナルを求めるトレーダー向け。 ⊗完全にカスタマイズ可能。
FREE
+ 2 bonus strategies! Alerts! I recommend watching my advisor -   Night Zen EA The indicator combines the most popular moving average strategies: Simple moving average crossover. Moving average crossover relative to the position of the slower moving average. 2 bonus strategies : The crossing of the fast moving average with the calculation of the opening prices of the slow moving average with the calculation of the closing prices taking into account the slower moving average. (The settings for th
FREE
QualifiedEngulfing - は ProEngulfing インジケーターの無料版です。 ProEngulfing - は Advance Engulf インジケーターの有料版で、 こちらからダウンロードできます。 ProEngulfing の無料版と有料版の違いは何ですか?無料版は1日に1つのシグナルの制限があります。 QualifiedEngulfingをご紹介します - あなたのMT4用のプロフェッショナルエンゴルフパターンインジケーター Precisionの力を解放して、QualifiedEngulfingを使用して外国為替市場での資格のあるエンゴルフパターンを特定および強調する先進的なインジケーターです。MetaTrader 4用に開発されたQualifiedEngulfingは、外国為替市場のエンゴルフパターンを確認およびハイライトするために設計された切り立ったアプローチを提供し、取引の決定に対して最も信頼性の高いシグナルのみを受け取ることを確認します。 QualifiedEngulfingの動作方法: QualifiedEngulfingは、エンゴルフパター
FREE
FFx Force Index
Eric Venturi-Bloxs
5 (1)
The purpose of this new version of the MT4 standard indicator provided in your platform is to display in a sub-window multiple timeframes of the same indicator. See the example shown in the picture below. But the display isn’t like a simple MTF indicator. This is the real display of the indicator on its timeframe. Here's the options available in the FFx indicator: Select the timeframes to be displayed (M1 to Monthly) Define the width (number of bars) for each timeframe box Alert pop up/sound/ema
FREE
Smart FVG インジケーター MT4 – MetaTrader 4 向け高度なフェアバリューギャップ検出 Smart FVG インジケーター MT4 は、MetaTrader 4 上で Fair Value Gap(FVG)をプロフェッショナルレベルで検出・監視し、アラートまで行うツールです。ATR ベースのフィルタリングと相場構造を考慮したロジックを組み合わせることで、ノイズを取り除き、流動性に応じて適応し、本当に重要な不均衡だけを残して精度の高い判断をサポートします。 主な特長 正確な FVG 検出:単なるローソク足のギャップではなく、市場の本質的な非効率を捉えます。 ATR ベースの精度:市場や時間軸が変わっても、低品質なシグナルを自動的にフィルタリング。 有効性のリアルタイム追跡:価格がゾーンを埋める/ブレイクすると、ゾーンが自動で延長・調整・削除されます。 カスタマイズ可能な表示:色・ラインスタイル・塗りつぶしを自由に設定し、どんなテンプレートにも合わせられます。 実用的なアラート:新規 FVG や、埋められた/無効化されたゾーンをリアルタイム通知。 パフォーマンス
FREE
FFx MACD
Eric Venturi-Bloxs
4.2 (5)
The purpose of this new version of the MT4 standard indicator provided in your platform is to display in a sub-window multiple timeframes of the same indicator. See the example shown in the picture below. But the display isn’t like a simple MTF indicator. This is the real display of the indicator on its timeframe. Here's the options available in the FFx indicator: Select the timeframes to be displayed (M1 to Monthly) Define the width (number of bars) for each timeframe box Alert pop up/sound/ema
FREE
This indicator calculates average speed of moving average indicator. Here is parameters: BarsToProcess - indicator calculating period; MaPeriod - period of Moving Average indicator; AveragingPeriod - period (MA values) of the basis of which the average value is calculated; MA_Method, MA_Apply_to - using to set MA indicator parameters; Thats all! Good luck.
FREE
Enhanced Volume Profile: The Ultimate Order Flow & Liquidity Analysis Tool Overview Enhanced Volume Profile   is an indicator for MetaTrader 5 that displays the traded volume at specific price levels over a defined period. It separates the total volume into buy and sell components, presenting them as a side-by-side histogram on the chart. This allows users to observe the volume distribution and the proportion of buy and sell volumes at each price level. Graphics Rendering The indicator uses t
FREE
Accuracy Meter
Ashkan Hazegh Nikrou
5 (2)
精度メーターの紹介: 精度メーターは、戦略の勝率を決定する強力なツールであり、メタトレーダー戦略テスターのようなすべてのトレードのエントリーポイントとエグジットポイントを示します。チャート上のインジケーターとしてシンプルなストラテジーテスターを使用し、さまざまなペアとタイムフレームにアタッチして調べることができます。戦略の正確さのパーセンテージ、ストップロスとリスクを報酬要素に変更し、それがトレーディングのアイデアにどのように影響するかを確認します。 Accuracy Meterはシンプルな戦略テスターです。この製品は、戦略テスターと同じチャート上の戦略の入口と出口にアクセスするのに役立ちます。この製品を使用すると、コストを節約し、不利益なEAを構築するためにお金を無駄にすることがありません。 よくある質問 : どのように私はこの指標に私の戦略を定義できますか? 精度メーターには、カスタムインジケーターのパスと名前を調整できる入力設定があり、買いバッファーと売りバッファーの番号も定義できます。 以下の設定を使用できます。     カスタム指標名     バッファ番号を購入
FREE
Highlights trading sessions on the chart The demo version only works on the AUDNZD chart!!! The full version of the product is available at: (*** to be added ***) Trading Session Indicator displays the starts and ends of four trading sessions: Pacific, Asian, European and American. the ability to customize the start/end of sessions; the ability to display only selected sessions; works on M1-H2 timeframes; The following parameters can be configured in the indicator: TIME_CORRECTION = Correct
FREE
Follow The Line
Oliver Gideon Amofa Appiah
3.94 (16)
FOLLOW THE LINE GET THE FULL VERSION HERE: https://www.mql5.com/en/market/product/36024 This indicator obeys the popular maxim that: "THE TREND IS YOUR FRIEND" It paints a GREEN line for BUY and also paints a RED line for SELL.  It gives alarms and alerts of all kinds. IT DOES NOT REPAINT and can be used for all currency pairs and timeframes. Yes, as easy and simple as that. Even a newbie can use it to make great and reliable trades. NB: For best results, get my other premium indicators for more
FREE
This indicator is a perfect tool able to compare which brokers have the lower latency. It shows us immediately which brokers are slower or faster. When you see the dot icon on the line, it means this broker is the faster one and the red line (Broker_A) is the slower one. See the example on the screenshot. How It Works? This indicator shares the prices information to and from the "shared" common data folder. It compares all the prices. The price is based on average by (Ask + Bid) / 2. There are
FREE
Magic Supply Demand Indicator works on all products and timeframes. It is a new formula, and   the very new features are two zone strength functions adjustable by user input!   This is a great advantage in trading. When you learn how to use the proprietary features such as the zone strength with   min X-factor of price travel away, you will be able to tell whether the zone is strong or not. The supply and demand zones are used as an alert trigger.   You can use popup alert with sound on MetaTra
FREE
TradeDashboard Comprehensive MT4 Indicator for Trade Visualization and Analysis Overview TradeDashboard is a powerful MetaTrader 4 indicator designed to enhance your trading experience by providing real-time visualization of take-profit levels for all open positions. This advanced tool goes beyond basic TP indicators by displaying comprehensive metrics including potential profits, losses, and total lot sizes, all directly on your chart. Key Features Take-Profit Visualization : Clearly displays h
FREE
Pipsurfer Tide Meter
Clinton Keenan Obinna Butler
Pipsurfer Tide Meter is a Momentum Indicator that is designed to help trades know which way the "Tide" is turning. This indicator is a great supporting indicator to the pipsurfer main indicator that is listed in MQL5 under "Pipsurfer Indicator"  The Strategy Behind the Tide Meter is that youll see the blue bars and the red bars. Blue bars are for bullish momentum  Red bars are for bearish momentum  Use price action to find a trading zone then wait for the tide meter to change color then you ent
FREE
Rainbow MT4 is a technical indicator based on Moving average with period 34 and very easy to use. When price crosses above MA and MA changes color to green, it’s a signal to buy. When price crosses below MA and MA changes color to red, it’s a signal to sell. The Expert advisor ( Rainbow EA MT4) based on Rainbow MT4 indicator, as you can see in the short video below is now available here .
FREE
Tipu Heikin-Ashi Panel is the modified version of the original Heiken Ashi indicator published by MetaQuotes here . A professional version of this indicator is available here . Features An easy to use Panel that shows the Heiken Ashi trend of selected timeframe. Customizable Buy/Sell alerts, push alerts, email alerts, or visual on-screen alerts. Customizable Panel. The panel can be moved to any place on the chart or minimized to allow more space. Heikin means "the average", and Ashi means "foot
FREE
FFx RVI
Eric Venturi-Bloxs
5 (1)
The purpose of this new version of the MT4 standard indicator provided in your platform is to display in a sub-window multiple timeframes of the same indicator. See the example shown in the picture below. But the display isn’t like a simple MTF indicator. This is the real display of the indicator on its timeframe. Here's the options available in the FFx indicator: Select the timeframes to be displayed (M1 to Monthly) Define the width (number of bars) for each timeframe box Alert pop up/sound/ema
FREE
The Starting Points indicator for MetaTrader 4 is a technical analysis tool that shows the monthly, weekly, and daily starting points, as well as the 1000-point and 500-point levels, in the forex market. The indicator is displayed as a series of horizontal lines that represent the starting points and levels. Benefits of Using the Starting Points Indicator Identify potential trend changes:   The Starting Points indicator can help traders identify potential trend changes by highlighting areas wher
FREE
SX Supply Demand Zones accurately identifies and draws high-probability Supply and Demand zones using a sophisticated algorithm. Unlike traditional indicators that clutter your chart, this indicator is designed with a focus on performance and a clean user experience. New Unique Feature: Interactive Legend System What truly sets this indicator apart from everything else is the Interactive Control Legend. You have a professional dashboard directly on your chart that allows you to: Show/Hide: Ins
FREE
無限からの通貨の強さを測定するためのこの革新的な指標は、長い間取引されているダフ屋やトレーダーにとって不可欠な助手です。 通貨の強さ/弱さを分析するためのシステムは、世界の主要なトレーダーによって市場で長い間知られており、使用されてきました。 任意の裁定取引は、この分析なしでは完全ではありません。 私たちの指標は、互いに関連して基本通貨の強さを簡単に決定します。 これは、インスタント分析を可能にし、最強のエントリポイントを検索し、すべてまたは現在の通貨ペアの折れ線グラフが表示されます。 インジケータは直感的で、すぐに見つけて任意のペアに切り替えることができ、地下室とメインチャートの両方に配置できるモバイルパネルがあります。 通貨の強さの変化の通知のタイマーモードは、トレーダーに電話で通知を受け取る機会を与えます。  通貨パワーメーターインフィニティ指標を使用するためのいくつかの戦略: 1. 通貨の強さの線形表示のチャートを使用して、交差点を新興トレンドの信号として検索します 2. トレンド反転信号が表示された後、強い通貨の方向に頭皮 3. 通貨の強さの発散分析を使用して、現在の
FREE
The purpose of this new version of the MT4 standard indicator provided in your platform is to display in a sub-window multiple timeframes of the same indicator. See the example shown in the picture below. But the display isn’t like a simple MTF indicator. This is the real display of the indicator on its timeframe. Here's the options available in the FFx indicator: Select the timeframes to be displayed (M1 to Monthly) Define the width (number of bars) for each timeframe box Alert pop up/sound/ema
FREE
FFx Fractals
Eric Venturi-Bloxs
4.5 (2)
The purpose of this new version of the MT4 standard indicator provided in your platform is to display in a sub-window multiple timeframes of the same indicator. See the example shown in the picture below. But the display isn’t like a simple MTF indicator. This is the real display of the indicator on its timeframe. Here's the options available in the FFx indicator: Select the timeframes to be displayed (M1 to Monthly) Define the width (number of bars) for each timeframe box Alert pop up/sound/ema
FREE
Please Good Review on this indicator, and i will maybe produce more indicators,  Coming soon, EA base on this indicators Linear Weighted Moving Average with HLCC applied price, and Bollinger bands with LWMA as applied price. Interesing Buy and Sell arrow based on this indicator , non Lag indicator as arrow will appear 1 candle after crossed...............
FREE
The indicator displays signals according to the strategy of Bill Williams on the chart. Demo version of the indicator has the same features as the paid, except that it can work only on a demo account . Signal "First Wise Man" is formed when there is a divergent bar with angulation.  Bullish divergent bar - with lower minimum and closing price in the upper half. Bearish divergent bar - higher maximum and the closing price at the bottom half. Angulation is formed when all three lines of Alligator
FREE
このプロダクトを購入した人は以下も購入しています
Gann Made Easy は、ミスター・ギャンの理論を使用した取引の最良の原則に基づいた、プロフェッショナルで使いやすい外国為替取引システムです。 W・D・ガン。このインジケーターは、ストップロスとテイクプロフィットレベルを含む正確な買いと売りのシグナルを提供します。 PUSH通知を利用して外出先でも取引可能です。 ご購入後、取引方法の説明と優れた追加インジケーターを無料で入手するには、私にご連絡ください! おそらく、ギャンの取引手法についてはすでに何度も聞いたことがあるでしょう。通常、ギャンの理論は初心者のトレーダーだけでなく、すでにある程度の取引経験がある人にとっても非常に複雑なものです。なぜなら、ギャンの取引手法は理論的にはそれほど簡単に適用できるものではないからです。私はその知識を磨き、最良の原則を私の外国為替インジケーターに組み込むために数年を費やしました。 このインジケーターは非常に簡単に適用できます。必要なのは、それをチャートに添付し、簡単な取引推奨事項に従うだけです。このインジケーターは常に市場分析の仕事を行い、取引の機会を探します。適切なエントリーポイントを検出す
「 Dynamic Scalper System 」インジケーターは、トレンド波の中でスキャルピング取引を行う手法のために設計されています。 主要通貨ペアと金でテスト済みで、他の取引商品との互換性があります。 トレンドに沿った短期的なポジションオープンのシグナルを提供し、追加の価格変動サポートも提供します。 インジケーターの原理 大きな矢印はトレンドの方向を決定します。 トレンド波の中では、小さな矢印の形でスキャルピングシグナルを生成するアルゴリズムが機能します。 赤い矢印は強気方向、青い矢印は弱気方向です。 トレンドの方向には敏感な価格変動ラインが描かれ、小さな矢印のシグナルと連動します。 シグナルは次のように機能します。適切なタイミングでラインが現れるとエントリーシグナルが形成され、ラインが開いている間はポジションが保持され、完了すると取引が終了します。 推奨される動作時間枠はM1~H4です。 矢印は現在のローソク足に形成され、次のローソク足が開いている場合は、前のローソク足の矢印は再描画されません。 入力パラメータ Trend Wave Period - トレンド方向
M1 SNIPER は使いやすいトレーディングインジケーターシステムです。M1時間足向けに設計された矢印インジケーターです。M1時間足でのスキャルピングのためのスタンドアロンシステムとして、また既存のトレーディングシステムの一部としても使用できます。このトレーディングシステムはM1時間足での取引に特化して設計されていますが、他の時間足でも使用できます。元々、この手法はXAUUSDとBTCUSDの取引用に設計しましたが、他の市場においても役立つと考えています。 インジケーターのシグナルは、トレンドの方向と逆方向に取引できます。インジケーターのシグナルを利用して両方向に取引するのに役立つ特別な取引テクニックをご紹介します。この手法は、特別な動的なサポートとレジスタンスの価格帯を利用することに基づいています。 ご購入後、M1 SNIPER矢印インジケーターをすぐにダウンロードできます。さらに、M1 SNIPERツールのすべてのユーザーに、以下のスクリーンショットに表示されているApollo Dynamic SRインジケーターを無料で提供しています。この2つのインジケーターを組み合わせることで
An exclusive indicator that utilizes an innovative algorithm to swiftly and accurately determine the market trend. The indicator automatically calculates opening, closing, and profit levels, providing detailed trading statistics. With these features, you can choose the most appropriate trading instrument for the current market conditions. Additionally, you can easily integrate your own arrow indicators into Scalper Inside Pro to quickly evaluate their statistics and profitability. Scalper Inside
Linear Trend Predictor ー - エントリ ポイントと方向サポート ラインを組み合わせたトレンド インジケーター。高値/安値チャネルを突破するという原理に基づいて機能します。 インジケーターのアルゴリズムは市場のノイズをフィルタリングし、ボラティリティと市場の動向を考慮します。 インジケーターの機能  平滑化手法を使用して、市場のトレンドと、買い注文または売り注文を開くためのエントリー ポイントを表示します。  任意の時間枠のチャートを分析して、短期および長期の市場の動きを判断するのに適しています。  あらゆる市場や時間枠に適応可能な入力パラメータにより、トレーダーはインジケーターを独自にカスタマイズできます。  設定されたインジケーター信号は消えず、再描画もされません。ローソク足の終値で決定されます。  いくつかの種類の通知が矢印と組み合わされています。  このインジケーターは、独立した取引システムとして使用することも、他の取引システムへの追加として使用することもできます。  あらゆるレベルの経験を持つトレーダーが使用できます。 主なパラメータ Vol
まず第一に、この取引インジケーターは再描画されず、再描画されず、遅延しないことを強調する価値があります。これにより、手動取引とロボット取引の両方に理想的なものになります。 ユーザーマニュアル:設定、入力、戦略。 アトミックアナリストは、価格の強さとモメンタムを利用して市場でより良いエッジを見つけるためのPA価格アクションインジケーターです。ノイズや誤ったシグナルを除去し、取引ポテンシャルを高めるための高度なフィルターを備えています。複雑なインジケーターの複数のレイヤーを使用して、アトミックアナリストはチャートをスキャンし、複雑な数学的計算をシンプルなシグナルと色に変換します。これにより、どのような初心者トレーダーでも理解して使用し、一貫した取引の決定を行うことができます。 「アトミックアナリスト」は、新規および経験豊富なトレーダー向けにカスタマイズされた包括的な取引ソリューションです。プレミアムインジケーターとトップノッチの機能を1つの取引戦略に組み合わせ、すべてのタイプのトレーダーにとって汎用性のある選択肢にします。 デイリートレーディングとスキャルピング戦略:高速で正確な
トレンドラインプロ   市場の真の方向転換点を理解するのに役立ちます。この指標は、真のトレンド反転と主要プレーヤーが再び参入するポイントを示します。 分かりますか     BOSライン   複雑な設定や不要なノイズなしに、より長い時間足でのトレンドの変化と重要なレベルを把握できます。シグナルは再描画されず、バーが閉じた後もチャート上に残ります。 VERSION MT 5     -     RFI LEVELS PRO インジケーター と組み合わせることで、その潜在能力を最大限に発揮します。 インジケーターが示す内容: 本当の変化   トレンド(BOSライン) 一度シグナルが現れたら、それは有効です!これは、リペイント機能を持つインジケーターとの重要な違いです。リペイント機能を持つインジケーターは、シグナルを発した後、それを変更し、資金の損失につながる可能性があります。これにより、より高い確率と精度で市場に参入できます。また、矢印が現れた後、目標値(利益確定)に達するか、反転シグナルが現れるまで、ローソク足の色を変更する機能もあります。 繰り返しエントリ       主要プレーヤーの
まず第一に、この取引ツールはノンリペイント、ノンリドロー、ノンラグの指標であり、プロの取引に理想的ですことを強調する価値があります。 オンラインコース、ユーザーマニュアル、デモ。 スマートプライスアクションコンセプトインジケーターは、新米から経験豊富なトレーダーまで、非常 に強力なツールです。Inner Circle Trader AnalysisやSmart Money Concepts Trading Strategiesなど、20以上の有用な指標を1つに組み合わせています。このインジケーターはスマートマネーコンセプトに焦点を当て、大手機関の取引方法を提供し、彼らの動きを予測するのに役立ちます。 特に、流動性分析に優れており、機関がどのように取引しているかを理解しやすくしています。市場のトレンドを予測し、価格の動きを慎重に分析するのに優れています。機関の戦略とトレードを合わせることで、市場の動向についてより正確な予測ができます。このインジケーターは多目的であり、市場構造を分析し、重要な注文ブロックを特定し、さまざまなパターンを認識するのに優れています。 このインジケーターは
NAM Order Blocks
NAM TECH GROUP, CORP.
3.67 (3)
MT4マルチタイムフレームオーダーブロック検出インジケーター。 特徴 -チャートコントロールパネルで完全にカスタマイズ可能で、完全な相互作用を提供します。 -必要な場所でコントロールパネルを表示および非表示にします。 -複数の時間枠でOBを検出します。 -表示するOBの数量を選択します。 -さまざまなOBユーザーインターフェイス。 -OBのさまざまなフィルター。 -OB近接アラート。 -ADRの高線と低線。 -通知サービス(画面アラート|プッシュ通知)。 概要 注文ブロックは、金融機関や銀行からの注文収集を示す市場行動です。著名な金融機関と中央銀行が外国為替市場を牽引しています。したがって、トレーダーは市場で何をしているのかを知る必要があります。市場が注文ブロックを構築するとき、それは投資決定のほとんどが行われる範囲のように動きます。 注文の構築が完了すると、市場は上向きと下向きの両方に向かって急激に動きます。注文ブロック取引戦略の重要な用語は、機関投資家が行っていることを含むことです。それらは主要な価格ドライバーであるため、機関投資家の取引を含むあらゆる戦
GOLD Impulse with Alert
Bernhard Schweigert
4.67 (12)
このインディケータは、当社の2つの製品 Advanced Currency IMPULSE with ALERT  +   Currency Strength Exotics . のスーパーコンビネーションです。 このインジケーターは全ての時間枠で作動し、8つの主要通貨と1つのシンボルの強弱のインパルスをグラフで表示します。 このインジケータは、金、エキゾチックペア、商品、インデックス、先物など、あらゆるシンボルの通貨強度の加速度を表示することに特化されています。金、銀、原油、DAX、US30、MXN、TRY、CNHなどの通貨強度の加速度(インパルスまたは速度)を表示するために、任意のシンボルを9行目に追加できる、この種の最初のものです。 新しいアルゴリズムに基づいて構築され、潜在的な取引の特定と確認がさらに容易になりました。これは、通貨の強さや弱さが加速しているかどうかをグラフィカルに表示し、その加速の速度を測定するためです。加速すると物事は明らかに速く進みますが、これはFX市場でも同じです。つまり、反対方向に加速している通貨をペアリングすれば、潜在的に利益を生む取引を特定
Auto Optimized Parabolic RSI: 高度な3Dモメンタムエンジン ほとんどのリテール向けインジケーターは、市場のボラティリティが変化した瞬間に破綻する静的な入力値に依存しているため、失敗に終わります。Auto Optimized Parabolic RSIは、自らの数学的優位性を継続的に再計算することで「インジケーターの陳腐化」問題を解決し、機関投資家レベルの定量的適応力をMT5ターミナルに直接もたらします。 最大の強み: カスタムインメモリ3D最適化   標準的な自動最適化ツールは、インジケーターの呼び出しで端末に過負荷をかけるため、頻繁にMT5プラットフォームをフリーズさせます。本ツールは、このボトルネックを完全に回避しています。RAMベースのカスタムネイティブ計算機を内蔵した内部エンジンは、チャートを読み込んだりタイムフレームを変更したりするたびに、超高速の3Dグリッド探索を実行します。RSI期間(頻度)、SARステップ(加速度)、SAR最大値(制限速度)を同時にスイープし、プラットフォームを遅延させることなく、数万通りものパラメーターの組み合わせを絶対的
MTF Supply Demand Zones
Georgios Kalomoiropoulos
4.82 (22)
次世代の自動化された需要と供給のゾーン。どのチャートでも機能する新しい革新的なアルゴリズム。すべてのゾーンは、市場の価格行動に従って動的に作成されています。 2種類のアラート --> 1) 価格がゾーンに達したとき 2) 新しいゾーンが形成されたとき もう 1 つの役に立たない指標はありません。実績のある完全な取引戦略を手に入れることができます。     新機能:     価格が需給ゾーンに達したときにアラートを出す     新しい需給ゾーンが作成されたときにアラートを発します     プッシュ通知アラート     ピップ単位のゾーン幅ラベル     MTF のもう 1 つのタイムフレーム。したがって、現在より 2 時間足高いのではなく、現在より 3 時間足し上に見えるようになります。     アラート/ゾーン/MTF 機能を有効/無効にするボタン あなたが得る利点:     取引から感情を取り除きます。     取引エントリをオブジェクト化します。     確率の高いセットアップで利益を上げましょう。     描画ゾーンから時間を節約します。
現在20%OFF! 初心者やエキスパートトレーダーに最適なソリューションです。 このインディケータは、エキゾチックペア・コモディティ・インデックス・先物など、あらゆるシンボルの通貨の強さを表示することに特化したインディケータです。金、銀、原油、DAX、US30、MXN、TRY、CNHなどの通貨の強さを表示するために、9行目にどのシンボルでも追加することができます。独自の機能を多数搭載し、新しい計算式を採用したため、ユニークで高品質、かつ手頃な価格のトレーディングツールとなっています。新しいトレンドやスキャルピングチャンスのトリガーポイントを正確に把握することができるため、あなたのトレードがどのように改善されるか想像してみてください。 ユーザーマニュアル:ここをクリック   https://www.mql5.com/en/blogs/post/708876 すべての時間枠に対応します。あなたはすぐにトレンドを見ることができるようになります! 新しいアルゴリズムに基づいて設計されているため、潜在的な取引の特定と確認がより簡単になります。これは、8つの主要通貨と1つのシンボルの強弱
MetaForecast M4
Vahidreza Heidar Gholami
5 (2)
MetaForecastは、価格データのハーモニクスに基づいて、どんな市場の未来を予測し視覚化します。市場が常に予測可能ではありませんが、価格にパターンがある場合、MetaForecastは可能な限り正確な未来を予測できます。他の類似製品と比較して、MetaForecastは市場のトレンドを分析することでより正確な結果を生成することができます。 入力パラメータ Past size (過去のサイズ) MetaForecastが将来の予測を生成するために使用するバーの数を指定します。モデルは選択したバー上に描かれた黄色の線で表されます。 Future size (将来のサイズ) 予測すべき将来のバーの数を指定します。予測された将来は、ピンクの線で表示され、その上に青い回帰線が描かれます。 Degree (程度) この入力は、MetaForecastが市場で行う分析のレベルを決定します。 Degree 説明  0 Degree 0の場合、価格の全てのピークや谷、そして詳細をカバーするために、「Past size」の入力に大きな値を使用することが推奨されています。  1 (推奨) Degre
Introducing the Delta Volume Profile Indicator - Unleash the Power of Institutional Precision!  Technical Indicator: Are you ready to trade like the pros? The Delta Volume Profile Indicator is no ordinary tool. It’s a high-precision, cutting-edge indicator that puts the power of institutional-grade trading in your hands. This unique indicator analyses delta volume distribution in real-time, revealing the market's hidden buy/sell imbalances that the biggest financial institutions rely on to antic
The Super Arrow Indicator provides non-repainting buy and sell signals with exceptional accuracy. Key Features No repainting – confirmed signals remain fixed Clear visual arrows: green for buy, red for sell Real-time alerts via pop-up, sound, and optional email Clean chart view with no unnecessary clutter Works on all markets: Forex, gold, oil, indices, crypto Adjustable Parameters TimeFrame Default: "current time frame" Function: Sets the time frame for indicator calculation Options: Can be set
ブレーカートレーダーになり、価格が反転すると市場構造からの利益が変化します。 注文ブロックブレーカーインジケーターは、トレンドまたは価格の動きが枯渇に近づいており、逆転の準備ができていることを識別します。通常、反転または大規模なプルバックが発生しようとしているときに発生する市場構造の変化について警告します。 この指標は、ブレイクアウトと価格の勢いを識別する独自の計算を使用します。使い果たされる可能性のあるポイントの近くで新しい高値が形成されるたびに、インディケーターはその高値の作成を担当する最後の注文ブロックを描きます。次に、移動する価格とともに注文ブロックを追跡します。その後、価格が反対方向にシフトし、その注文ブロックを突破すると、新しい市場構造を作成し、トレンドまたは大きな後退の可能性のある反転の開始を警告します。 注文ブロックは、高値/安値が作成される前の最後の反対色のろうそくであり、価格がこれらの重要な領域を下抜けすると、トレンドの短期的ま​​たは長期的な反転の兆候です。 特徴 重要な枯渇点での市場構造の変化を警告します 価格が使い果たされるレベルに近づくと、自動的に
Order Block Hunter
Noha Mohamed Fathy Younes Badr
5 (10)
Order block hunter indicator is the best indicator for  hunt the order blocks that area where there has been a large concentration of limit orders waiting to be executed Order blocks are identified on a chart by observing previous price action and looking for areas where the price experienced significant movement or sudden changes in direction .This indicator does that for you by using very complicated codes and helps you to take the best areas To buy and sell because it make marks at the best a
Dynamic Forex28 Navigator - 次世代の Forex 取引ツール。 現在 49% オフ。 Dynamic Forex28 Navigator は、長年人気のインジケーターを進化させたもので、3 つの機能を 1 つにまとめています。 Advanced Currency Strength28 インジケーター (レビュー 695 件)  + Advanced Currency IMPULSE with ALERT (レビュー 520 件) + CS28 コンボ シグナル (ボーナス)。 インジケーターの詳細 https://www.mql5.com/en/blogs/post/758844 次世代の Strength インジケーターが提供するもの  オリジナルで気に入っていたすべての機能が、新機能と精度の向上によって強化されました。 主な機能: 独自の通貨強度計算式。 すべての時間枠でスムーズかつ正確な強度ライン。 トレンドの特定と正確なエントリーに最適です。 ダイナミックマーケットフィボナッチレベル (マーケットフィボナッチ)。 このインジケーターに固有
Advanced Supply Demand
Bernhard Schweigert
4.91 (299)
現在40%オフ 初心者にもエキスパートトレーダーにも最適なソリューション このインジケーターは独自の機能と新しい公式を多数内蔵しており、ユニークで高品質かつ手頃な取引ツールです。このアップデートでは、2つの時間枠ゾーンを表示できるようになります。より長いTFだけでなく、チャートTFとより長いTF(ネストゾーンを表示)の両方を表示できます。すべてのSupply Demandトレーダーの皆さんのお気に召すはずです。:) 重要情報の公開 Advanced Supply Demandの可能性を最大化するには、 https://www.mql5.com/ja/blogs/post/720245 にアクセスしてください。   エントリーまたはターゲットの正確なトリガーポイントを正確に特定できれば取引がどのように改善されるか想像してみてください。新しい基盤となるアルゴリズムに基づいて構築されているため、買い手と売り手の間の潜在的な不均衡をさらに簡単に特定できます。これは、最も強い需要と供給のゾーンと、過去のパフォーマンス(古いゾーンを表示)がグラフィカルに表現されるためです。これらの機能は、最適な
このインジケーターは、反転ポイントと価格戻りゾーンを正確に表示します。     主要プレーヤー 。新たなトレンドが形成される場所を把握し、最大限の精度で意思決定を行い、すべての取引をコントロールします。 TREND LINES PRO インジケーターと組み合わせることで、その潜在能力を最大限に発揮します。 VERSION MT5 インジケーターが示す内容: 新しいトレンドの始まりに活性化する反転構造と反転レベル。 リスクと報酬の比率を最小限に抑えた利益 確定 と 損失停止の レベルの表示     RR 1:2   。 インテリジェントな削減ロジックによるストップロス。 指定されたインジケーターから 2 つのトレンド タイプの反転パターンを表示します。 指標: トレンドを追う   TREND LINES PRO   (世界的なトレンドの変化) TREND PRO   (クイックトレンド変更) シンプルで効果的   スキャナー   リアルタイムトレンド(新機能)。 マルチタイムフレームのインストゥルメント フィルタリング。 画面   利益     LOGIC AI信号の後。 当日プラス方
Adaptive Volatility Range [AVR] is a powerful tool for identifying key trend reversal points. AVR accurately reflects the Average True Range (ATR) of volatility, taking into account the Volume-Weighted Average Price (VWAP). The indicator adapts to any market volatility by calculating the average volatility over a specific period, ensuring a stable rate of profitable trades. You receive not just an indicator but a professional automated trading system , AVR-EA . Advantages: Automated Trading Sys
説明書(ロシア語)  /  説明書 (英語)  /  バージョン MT5 主な機能: 売り手と買い手のアクティブなゾーンを表示します。 このインジケーターは、買いと売りの適切な最初のインパルスレベル/ゾーンをすべて表示します。これらのレベル/ゾーンがアクティブになると、エントリーポイントの探索が始まり、レベルの色が変わり、特定の色で塗りつぶされます。状況をより直感的に把握できるように、矢印も表示されます。 LOGIC AI - テンプレートをアクティブ化するときにエントリポイントを検索するためのゾーン(円)の表示 視認性を向上させるため、人工知能を用いて進入ポイントを探索したゾーンを表示する機能が追加されました。 より高い時間枠からのレベル/ゾーンの表示(MTFモード) より長い時間間隔でレベル/ゾーンを表示する機能を追加しました。また、インジケーターに自動トレンド検出機能(   TPSproTREND PRO   )を実装しました。 取引のための個別の専門的なステップバイステップのアルゴリズム このアルゴリズムは、トレンドの方向と逆方向の両方でデイトレードを行うために設計されていま
通貨強さウィザードは、取引を成功させるためのオールインワン ソリューションを提供する非常に強力な指標です。このインジケーターは、複数の時間枠のすべての通貨のデータを使用して、このまたはその外国為替ペアのパワーを計算します。このデータは、使いやすい通貨インデックスと通貨パワーラインの形式で表され、特定の通貨のパワーを確認するために使用できます。 必要なのは、取引したいチャートにインジケーターを接続することだけです。インジケーターは、取引する通貨の実際の強さを示します。このインジケーターは、トレンドに合わせて取引するときに有利に利用できる売買高の圧力の極値も示します。このインジケーターには、フィボナッチに基づく可能なターゲットも表示されます。 このインジケーターは、PUSH 通知を含むあらゆるタイプのアラートを提供します。 購入後ご連絡下さい。私の取引のヒントをあなたと共有し、素晴らしいボーナスインジケーターを無料で提供します! 幸せで有益な取引をお祈りします。
BTMM State Engine Pro is a MetaTrader 4 indicator for traders who use the Beat The Market Maker approach: Asian session context, kill zone timing, level progression, peak formation detection, and a multi-pair scanner from a single chart. It combines cycle state logic with a built-in scanner dashboard so you do not need the same tool on many charts at once. What it does Draws the Asian session range; session times can follow broker server offset or be set in inputs. Tracks level progression (L
TrendLine PRO MT4
Evgenii Aksenov
4.83 (167)
The Trend Line PRO indicator is an independent trading strategy. It shows the trend change, the entry point to the transaction, as well as automatically calculates three levels of Take Profit and Stop Loss protection. Trend Line PRO is perfect for all Meta Trader symbols: currencies, metals, cryptocurrencies, stocks and indices. The indicator is used in trading on real accounts, which confirms the reliability of the strategy. Robots using   Trend Line PRO   and real Signals can be found here:   
Volatility Trend System - a trading system that gives signals for entries. The volatility system gives linear and point signals in the direction of the trend, as well as signals to exit it, without redrawing and delays. The trend indicator monitors the direction of the medium-term trend, shows the direction and its change. The signal indicator is based on changes in volatility and shows market entries. The indicator is equipped with several types of alerts. Can be applied to various trading ins
Looking for a powerful yet lightweight swing detector that accurately identifies market structure turning points? Want clear, reliable buy and sell signals that work across any timeframe and any instrument? Buy Sell Arrow MT Swing is built exactly for that — precision swing detection made simple and effective. This indicator identifies Higher Highs (HH) , Higher Lows (HL) , Lower Highs (LH) , and Lower Lows (LL) with remarkable clarity. It is designed to help traders easily visualize market stru
Trend indicator AI
Ramil Minniakhmetov
4.49 (84)
Trend Ai indicatorは、トレンドの識別と実用的なエントリポイントと反転アラートを組み合わせることで、トレーダーの市場分析を強化する優れたツールです。 この指標は、ユーザーが自信と正確さで外国為替市場の複雑さをナビゲートすることを可能にします トレンドAiインジケーターは、主要なシグナル以外にも、プルバックやリトレースメント中に発生するセカンダリエントリポイントを識別し、トレーダーが確立されたトレンド内の価格修正を活用できるようにします。 重要な利点: *MT4およびMT5の仕事 *明確な買いまたは売りシグナル *再描画しません ·すべての資産で動作します 私はeaやセットをtelegram it詐欺で販売しないように注意してください。 すべての設定はここでブログで無料です。  重要! 指示とボーナスを得るために購入後すぐに私に連絡してください! 私の他のプロダクトと同様、実質操作の監視はここに見つけることができます: https://www.mql5.com/en/users/mechanic/seller&nbsp ; 設定および入力: すべての
Matrix Arrow Indicator MT4
Juvenille Emperor Limited
5 (3)
マトリックスアローインジケーターMT4は、すべてのシンボル/商品(外国為替、商品、暗号通貨、インデックス、株式)で使用できる100%再描画されていないマルチタイムフレームインジケーターに続くユニークな10in1トレンドです。マトリックスアローインジケーターMT4は、初期段階で現在のトレンドを判断し、最大10の標準インジケーターから情報とデータを収集します。 平均方向移動指数(ADX) 商品チャネルインデックス(CCI) クラシック平研アシキャンドル 移動平均 移動平均収束発散(MACD) 相対活力指数(RVI) 相対力指数(RSI) 放物線SAR ストキャスティクス ウィリアムズのパーセント範囲 すべてのインジケーターが有効な買いまたは売りシグナルを与えると、対応する矢印がチャートに印刷され、次のろうそく/バーの開始時に強い上昇トレンド/下降トレンドを示します。ユーザーは、使用するインジケーターを選択し、各インジケーターのパラメーターを個別に調整できます。マトリックスアローインジケーターMT4は選択されたインディケーターからのみ情報を収集し、それらのデータのみに基づいてアローを印刷
作者のその他のプロダクト
The Green Dragon is a strategy that uses the Ichimoku Kinko Hyo system to place trades. The primary element of the Green Dragon is the use of the Chinkou Span as it crosses price action to place trades. This is a classic strategy of the Ichimoku even though its not as popular as some of the other strategies. The Chinkou Span is normally thought of as a market momentum indicator and used to give a trade set up more conviction when analyzing price movement. I find this description somewhat vague a
FREE
Standard deviation of returns is a popular way to view how the return of one bar relates to history. By knowing that you can better understand the magnitude of any return. The signal is calculated by taking the prior periods returns, adjusting for volatility of the returns of the last twenty periods, and dividing by the standard deviation. It is displayed in a separate panel as a histogram.
FREE
Overview Discover the power of automated scalping with KumoJoy , a smart Expert Advisor (EA) for MetaTrader 4. KumoJoy blends the trusted Ichimoku Kinko Hyo indicator with dynamic scalp zones to capture fast price reversals in active forex markets. Designed for traders who want hassle-free trading, KumoJoy delivers high-probability trades with low costs and built-in risk controls. With KumoJoy, you’ll enjoy: Easy Setup : Simple settings for beginners and pros alike. Live Insights : Chart labels
フィルタ:
ERozen
205
ERozen 2024.06.03 08:36 
 

ユーザーは評価に対して何もコメントを残しませんでした

topline8000
1144
topline8000 2022.05.03 11:55 
 

average

вano30061960 Томин
53
вano30061960 Томин 2021.07.01 16:56 
 

Качество на хорошо 60 - 65 % из десяти , Спасибо Mick Prate за качество .

Ron Devito
147
Ron Devito 2021.02.13 14:39 
 

The indicator remains on the chart even after you remove it, requiring you to close the chart completely and re-open. I don't quite understand the standard deviation of return and how it's supposed to influence a trading decision. The indicator works by tracking price in relation to the Ichimoku Kumo Cloud and Kijun Sen line. You long when price is above both; short when it's below both and don't take a trade when the cloud and line are giving conflicting signals. It's a lot less busy on your screen than loading the full Ichimoku, and probably best used on the D1 chart.

Tim Eubanks
5763
Tim Eubanks 2018.03.14 13:21 
 

ユーザーは評価に対して何もコメントを残しませんでした

レビューに返信