TradeDashboard

TradeDashboard

Comprehensive MT4 Indicator for Trade Visualization and Analysis

Overview

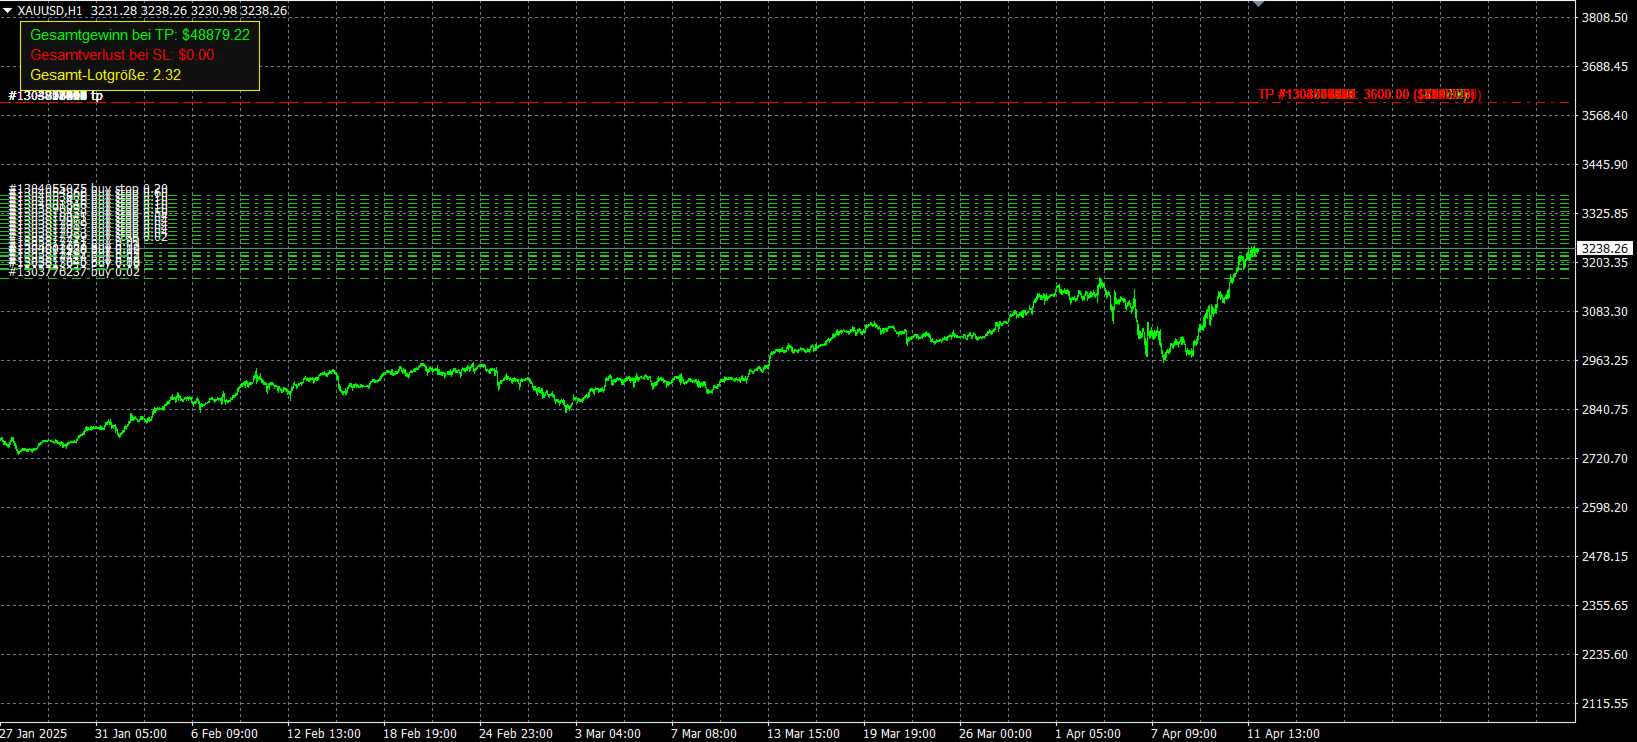
TradeDashboard is a powerful MetaTrader 4 indicator designed to enhance your trading experience by providing real-time visualization of take-profit levels for all open positions. This advanced tool goes beyond basic TP indicators by displaying comprehensive metrics including potential profits, losses, and total lot sizes, all directly on your chart.

Key Features

  • Take-Profit Visualization: Clearly displays horizontal lines at each take-profit level for all open positions on the current chart symbol
  • Profit/Loss Calculation: Automatically calculates and displays potential profit or loss for each trade at its respective take-profit level
  • Total Profit Analysis: Shows aggregated potential profit and loss figures for all open positions
  • Lot Size Monitoring: Displays the total lot size of all your open positions for quick risk assessment
  • Customizable Display Options: Adjust colors, line styles, and label positions to suit your trading platform theme
  • Above-Line Labels: Option to display information labels above the TP lines for better visibility
  • Real-Time Updates: Refreshes automatically every second to provide the most current information

Technical Details

TradeDashboard operates entirely within your MT4 platform and analyzes only open positions for the current chart symbol. The indicator:

  • Scans all open positions at regular intervals
  • Calculates potential profits and losses based on entry prices, take-profit levels, and lot sizes
  • Displays position-specific information adjacent to each take-profit line
  • Provides an information dashboard in the top left corner with aggregated statistics

Customization Options

The indicator includes multiple customization parameters:

  • LabelFontSize: Adjust text size for better readability
  • LongTPColor/ShortTPColor: Set different colors for long and short position take-profit lines
  • LineStyle/LineWidth: Modify the appearance of take-profit lines
  • ShowTotalProfit: Toggle the display of the profit/loss dashboard
  • LabelAboveLine: Position labels above or directly on take-profit lines
  • TotalProfitColor: Change the color of the totals dashboard

Usage Benefits

  • Enhanced Trade Visualization: See all your take-profit levels at a glance without manually drawing lines
  • Risk Management: Quickly assess your total exposure with lot size information
  • Profit Potential Analysis: Easily see the combined profit/loss potential of all positions
  • Time Efficiency: Eliminate the need to manually calculate potential outcomes for multiple positions
  • Trade Planning: Make more informed decisions about modifying take-profit levels
  • Performance Tracking: Monitor the potential performance of your current trading strategy

Installation Instructions

  1. Copy the TradeDashboard.mq4 file to your MetaTrader 4 Indicators directory (typically located at /MQL4/Indicators/)
  2. Restart MetaTrader 4 or refresh the Navigator window
  3. Drag and drop the TradeDashboard indicator onto any chart
  4. Adjust parameters in the indicator settings dialog if desired
  5. The indicator will automatically display take-profit levels for all open positions on the current chart symbol

Requirements

  • MetaTrader 4 platform
  • Active trading account with open positions to visualize
  • Standard MT4 permissions for reading order information

Technical Support

For questions, feature requests, or technical support, please contact the developer through the support channels provided in your purchase package.

TradeDashboard - Elevate your trading with comprehensive position analysis and visualization.


おすすめのプロダクト
QualifiedEngulfing - は ProEngulfing インジケーターの無料版です。 ProEngulfing - は Advance Engulf インジケーターの有料版で、 こちらからダウンロードできます。 ProEngulfing の無料版と有料版の違いは何ですか?無料版は1日に1つのシグナルの制限があります。 QualifiedEngulfingをご紹介します - あなたのMT4用のプロフェッショナルエンゴルフパターンインジケーター Precisionの力を解放して、QualifiedEngulfingを使用して外国為替市場での資格のあるエンゴルフパターンを特定および強調する先進的なインジケーターです。MetaTrader 4用に開発されたQualifiedEngulfingは、外国為替市場のエンゴルフパターンを確認およびハイライトするために設計された切り立ったアプローチを提供し、取引の決定に対して最も信頼性の高いシグナルのみを受け取ることを確認します。 QualifiedEngulfingの動作方法: QualifiedEngulfingは、エンゴルフパター
FREE
Accuracy Meter
Ashkan Hazegh Nikrou
5 (2)
精度メーターの紹介: 精度メーターは、戦略の勝率を決定する強力なツールであり、メタトレーダー戦略テスターのようなすべてのトレードのエントリーポイントとエグジットポイントを示します。チャート上のインジケーターとしてシンプルなストラテジーテスターを使用し、さまざまなペアとタイムフレームにアタッチして調べることができます。戦略の正確さのパーセンテージ、ストップロスとリスクを報酬要素に変更し、それがトレーディングのアイデアにどのように影響するかを確認します。 Accuracy Meterはシンプルな戦略テスターです。この製品は、戦略テスターと同じチャート上の戦略の入口と出口にアクセスするのに役立ちます。この製品を使用すると、コストを節約し、不利益なEAを構築するためにお金を無駄にすることがありません。 よくある質問 : どのように私はこの指標に私の戦略を定義できますか? 精度メーターには、カスタムインジケーターのパスと名前を調整できる入力設定があり、買いバッファーと売りバッファーの番号も定義できます。 以下の設定を使用できます。     カスタム指標名     バッファ番号を購入
FREE
The product   Divergence Cci Force Stddev Ac Atr   is designed to find the differences between indicators and price. It allows you to open orders or set trends using these differences. The indicator has 4 different divergence features. Divergence types Class A Divergence Class B Divergence Class C Divergence Hidden Divergence Product Features and Rec ommendations There are 5 indicators on the indicator Indicators =   CCI, Force, Stdandard Deviation, Acelereator, Atr 4 different divergence type
FREE
Discover the power of precision and efficiency in your trading with the " Super Auto Fibonacci " MT4 indicator. This cutting-edge tool is meticulously designed to enhance your technical analysis, providing you with invaluable insights to make informed trading decisions. Key Features: Automated Fibonacci Analysis: Say goodbye to the hassle of manual Fibonacci retracement and extension drawing. "Super Auto Fibonacci" instantly identifies and plots Fibonacci levels on your MT4 chart, saving you tim
FREE
TrendBite v1.5 - プロフェッショナルトレンド追跡インジケーター 開発者: 8aLt4 バージョン: 1.5 プラットフォーム: MetaTrader 4  概要 TrendBite v1.5 は、市場のトレンドの変化を検知し、投資家に明確な売買シグナルを提供するために設計された、高度なテクニカル分析インジケーターです。ボリンジャーバンドのアルゴリズムに基づいて、トレンドの転換を正確に捉えるこのツールは、初心者にも経験豊富なトレーダーにも最適です。  主な機能  トレンドの検知 自動トレンド分析:市場の上昇トレンドと下降トレンドを瞬時に検出 ボリンジャーバンドベース:信頼性の高い数学的モデルに基づく計算システム 視覚的な明瞭さ:緑(上昇)と黄色(下降)のヒストグラムバーでトレンド状況を明確に表示  売買シグナル 緑色の矢印(↑):買い機会を示します 赤色の矢印(↓):売り機会を示します 明確な視覚化:トレンドラインにより、ポジションの方向を簡単に追跡できます ヒストグラム表示:トレンドの強さを視覚的に評価可能  警告システム 音声警告:新しいシグナルが発生すると自動
FREE
Hello.  Another free indicator from Sepehr! ;) You can determine the trend with this tool. Using crosses of two Moving averages, you can say that the trend is going to be bullish or bearish; A fast-moving average and a slow one. When the fast-moving crosses up the slow-moving, it's going to be an uptrend and when it crosses down the slow-moving, it means that you are going to have a downtrend. That's easy ;) Hope to enjoy it Sepehr(Faran)
FREE
Индикатор показывает максимальное отклонение от скользящей средней за заданный период. Границы канала могут послужить своего рода зонами перекупленности/перепроданности, от которых может произойти откат цены к центру канала. За этими уровнями и стоит искать дополнительные сигналы для входа в сделку.  В настройках индикатора всего 2 параметра -  период, за который будет расчитываться индикатор и метод усреднения скользящей средней.
FREE
Schaff Trend Cycleとは Schaff Trend Cycle(STC)は、トレンドの転換点をタイムリーに捉えるために設計されたオシレーター系インジケーターです。従来の移動平均やMACDと比較して、サイクル的な動きとモメンタムを組み合わせることで、トレンドの始まりと終わりをより明確に把握できます。 主な特徴 トレンド転換シグナルの明確化:上昇トレンドではサイクルラインが上向きに、下降トレンドでは下向きに推移します。 レンジ相場でのだましを抑制:サイクル周期を考慮した平滑化処理により、短期的なノイズを減少させます。 パラメーター調整が容易:期間や平滑化係数を変更するだけで、動作感度を初心者から上級者まで幅広く調整可能です。 計算ロジック概要 モメンタムの算出 指定期間の価格変化をもとに、短期および長期のモメンタムを計算します。 サイクル平滑化 モメンタムに対し、二重平滑化(ダブル・スムージング)を適用し、サイクル的な振動成分を抽出します。 正規化処理 0~100の範囲に正規化し、オシレーターとして表示します。 シグナル生成 水平ライン(通常は25と75)を上下に抜
FREE
*This is TradingView indicator converted to mql4* The SuperTrend V indicator is a popular technical analysis tool used to identify trends and potential trend reversals in financial markets. It is based on the concept of the SuperTrend indicator but incorporates additional features and variations. The SuperTrend V indicator uses a combination of price action and volatility to determine the trend direction and generate trading signals. Here are the key components and features of the indicator: Ca
IMA Finder MT4
Mubashir Mohamed Quraish Albarakat
This indicator is designed based on the Moving Origin indicator When the moving origin indicator breaks the price, this indicator gives a signal It is useful for better viewing of signals and analysis on them Attributes: Can be used in all symbols Can be used in all time frames Too many signals Simple and quick settings Easy way to work Settings: period: like moving average settings alarmShow: If you want to receive an alert in Metatrader after receiving the signal, enable this setting alarmS
FREE
CCI in MA
Nikolaos Pantzos
4.75 (4)
iCC in iMA is indicator to change color in iMA if iCCI crosses level up (up trend) or crosses level down (down trend). It is a useful tool to track when the upside and the downside iCCI on iMA. You can to get source code from here . Parameters MA_Periods —Period for iMA. MA_Method — Method for iMA. CCI_Periods —Period for iCCI. CCI_ApliedPrice — Price used for iCCI. CCI_LevelsUp — Level iCCI for up trend. CCI_LevelsDN — Level iCCI for down trend. BarsCount — How many bars will show the line. R
FREE
The Magic SMA indicator is of great help in determining trend direction. It can be an excellent addition to your existing strategy or the basis of a new one. We humans can make better decisions when we see better visually. So we designed it to show a different color for rising and falling trends. Everyone can customize this in the way that suits them best. By setting the Trend Period, we can optimize it for longer or shorter trends for our strategy. It is great for all time frames. IF YOU NEED
FREE
A simple but effective helper that will allow you to track both global and local market trends. The indicator combines the work of two oscillators: Stochastic and RSI. Both indicators can be set to any timeframe. Advantages of Use Multitimeframe - you can adjust both indicators to the desired timeframes. To obtain the entry points, you can use the Elder's triple screen system. Highly customizable - you can configure not only the parameters of the indicators, but also their appearance (color and
FREE
With this system you can spot high-probability trades in direction of strong trends. You can profit from stop hunt moves initiated by the smart money! Important Information How you can maximize the potential of the scanner, please read here: www.mql5.com/en/blogs/post/718109 Please read also the blog about the usage of the indicator: Professional Trading With Strong Momentum This FREE Version of the indicator works only on EURUSD and GBPUSD. The full version of the indicator can be found here:
FREE
Supply Demand Ribbon is an indicator with moving supply and demand lines that help you identify price zones more easily. The indicator helps you determine flexible entry, stop loss, and take profit areas. There are also strategies for algorithmically changing ribbon colors. From there you can come up with many trading strategies for yourself! MT5 Version:   Click here! You can explore many feature in   Advanced   version   here ! You can combine it with our indicators below to make your tradin
FREE
Basic Supply Demand
Mehran Sepah Mansoor
4.33 (3)
基本的な需給インジケータは、あなたの市場分析を強化し、あらゆるチャート上の重要な機会領域を特定するために設計された強力なツールです。直感的で使いやすいインターフェイスで、この無料のメタトレーダー用インディケータは、需給ゾーンを明確に表示し、より多くの情報に基づいた正確な取引判断を可能にします /  MT5無料版 この指標のダッシュボードスキャナー: ( Basic Supply Demand Dashboard ) 特徴 チャートの需給ゾーンを自動的にスキャンし、面倒な手動分析を不要にします。 直近の需給ゾーンまでの残り距離をグラフィカルに表示 供給ゾーンは特徴的な色で強調表示され、需要ゾーンは別の色で表示されるため、迅速かつ正確な解釈が可能。 このインディケータは、最も近い供給ゾーンまたは需要ゾーンとチャート上の現在価格との距離をpips単位で自動的に計算し、明確かつ定量的な指標を提供します。pips単位の距離はチャート上にはっきりと見やすく表示され、現在価 格との距離が大きい、または小さいエリアを素早く特定できます。 需給ゾーンの接近やブレイクを警告 どのタイムフレームでも機
FREE
無限からの通貨の強さを測定するためのこの革新的な指標は、長い間取引されているダフ屋やトレーダーにとって不可欠な助手です。 通貨の強さ/弱さを分析するためのシステムは、世界の主要なトレーダーによって市場で長い間知られており、使用されてきました。 任意の裁定取引は、この分析なしでは完全ではありません。 私たちの指標は、互いに関連して基本通貨の強さを簡単に決定します。 これは、インスタント分析を可能にし、最強のエントリポイントを検索し、すべてまたは現在の通貨ペアの折れ線グラフが表示されます。 インジケータは直感的で、すぐに見つけて任意のペアに切り替えることができ、地下室とメインチャートの両方に配置できるモバイルパネルがあります。 通貨の強さの変化の通知のタイマーモードは、トレーダーに電話で通知を受け取る機会を与えます。  通貨パワーメーターインフィニティ指標を使用するためのいくつかの戦略: 1. 通貨の強さの線形表示のチャートを使用して、交差点を新興トレンドの信号として検索します 2. トレンド反転信号が表示された後、強い通貨の方向に頭皮 3. 通貨の強さの発散分析を使用して、現在の
FREE
The free version of the Hi Low Last Day MT4 indicator . The Hi Low Levels Last Day MT4 indicator shows the high and low of the last trading day . The ability to change the color of the lines is available . Try the full version of the Hi Low Last Day MT4 indicator , in which additional indicator features are available : Displaying the minimum and maximum of the second last day Displaying the minimum and maximum of the previous week Sound alert when crossing max . and min . levels Selecting an arb
FREE
Bitcoin 999
Ahmed Ragab Ramadan Abdelfattah
Bitcoin 999  - is a trend indicator that automatically analyzes the market and provides information about the trend and each of its changes, as well as giving signals for entering trades without redrawing! The indicator uses each candle, analyzing them separately. referring to different impulses - up or down impulse. Exact entry points into transactions for currencies, crypto, metals, stocks, indices!  Main functions: Accurate entry signals WITHOUT REPAINTING! Once a signal appears, it remains
FREE
MACD is well known indicator that still can be use for prediction where price will go next few minutes, hours or even weekly  With colored bar of Macd, your eyes can easily catch when color is changed based what market price movement to find any early trend on market. here is the parameter of the indicator: TF_MACD , default is 1 Hour , this mean you can see clearly MACD of 1 Hour TimeFrame on Lower TimeFrame. InpPrice , default is Price Close , this is original MACD parameter from Metaquotes st
FREE
FFx Bollinger Bands
Eric Venturi-Bloxs
4.75 (4)
The purpose of this new version of the MT4 standard indicator provided in your platform is to display in a sub-window multiple timeframes of the same indicator. See the example shown in the picture below. But the display isn’t like a simple MTF indicator. This is the real display of the indicator on its timeframe. Here's the options available in the FFx indicator: Select the timeframes to be displayed (M1 to Monthly) Define the width (number of bars) for each timeframe box Alert pop up/sound/ema
FREE
製品名 Smart Accumulation (MT4) – SmartView シリーズ 短い説明 MetaTrader プラットフォームで独特なユーザー体験を提供する Accumulation インジケーター。以前は利用できなかった高度な機能を提供し、ダブルクリックで設定を開く、削除せずにインジケーターを非表示/表示する、インジケーターウィンドウをチャート全体のサイズで表示するなどの機能を備えています。SmartView Indicators シリーズの残りの部分とシームレスに連携するように設計されています。 概要 SmartView シリーズは、革新的な機能を通じて MetaTrader プラットフォーム上のインジケーターに独特で特徴的なユーザー体験を提供し、インジケーター管理をより速く、より簡単にします。各インジケーターには、チャート上のスマートコントロールパネルが装備されており、基本情報を表示し、すべての重要な機能への迅速なアクセスを提供します。 以前は利用できなかった独自の機能 SmartView シリーズは、インジケーターでの作業をより簡単で迅速にする高度な機能を提供しま
FREE
What is Squeeze Momentum? Squeeze Momentum is an innovative technical analysis indicator popularized by John Carter in "Mastering the Trade" that detects compression periods in markets. This indicator analyzes volatility changes using a combination of Bollinger Bands and Keltner Channel. What Does It Do? Squeeze Detection : Identifies periods when Bollinger Bands move inside the Keltner Channel Momentum Measurement : Shows momentum changes through linear regression calculations Color-Coded Signa
FREE
updated hidden market support and resistance. this indicator is made for new current market that has new support and resistance that some traders struggle to see. The indicator works on all timeframes from the 1-minute timeframe to the monthly One Trading tip to use When price is at resistance and the indicator appears wait for a bearish candle to close then enter a sell trade. Same applies for a buy trade when price reaches support level, and the indicator appears wait for the bullish candle
FREE
Multi RsIBB MT4
Mansour Babasafary
4 (2)
A combined indicator of two famous indicators: RSI , Bollinger Bands Can be used in all currency pairs Can be used in all time frames with many signals Very simple and fast to use Description: This indicator is made from the combination of RSI and Bollinger Bands indicators As you can see, it shows good signals and is worth using and testing We hope you are satisfied with this indicator Settings: show past show candle: Displays the number of candles that the indicator calculates. For example
FREE
Smart RSI MT4
Mostafa Saad Saeed Shawara
製品名 Smart RSI (MT4) – SmartView シリーズ 短い説明 MetaTrader プラットフォームで独特なユーザー体験を提供する RSI インジケーター。以前は利用できなかった高度な機能を提供し、ダブルクリックで設定を開く、削除せずにインジケーターを非表示/表示する、インジケーターウィンドウをチャート全体のサイズで表示するなどの機能を備えています。SmartView Indicators シリーズの残りの部分とシームレスに連携するように設計されています。 概要 SmartView シリーズは、革新的な機能を通じて MetaTrader プラットフォーム上のインジケーターに独特で特徴的なユーザー体験を提供し、インジケーター管理をより速く、より簡単にします。各インジケーターには、チャート上のスマートコントロールパネルが装備されており、基本情報を表示し、すべての重要な機能への迅速なアクセスを提供します。 以前は利用できなかった独自の機能 SmartView シリーズは、インジケーターでの作業をより簡単で迅速にする高度な機能を提供します: ダブルクリックで設定を開く:
FREE
MACD indicator in MetaTrader 4/5 looks different than MACD does in most other charting software. That is because the MetaTrader 4/5 version of MACD displays the MACD line as a histogram when it is traditionally displayed as a line. Additionally, the MetaTrader 4/5 version computes the Signal line using an SMA, while according to MACD definition it is supposed to be an EMA. The MetaTrader 4/5 version also does not compute a true MACD Histogram (the difference between the MACD/Signal lines). This
FREE
The indicator identifies when a divergence occurs between price and an indicator or oscillator. It identifies bullish and bearish hidden or regular (classical) divergences. Combined with your own rules and techniques, this indicator will allow you to create (or enhance) your own powerful system. For higher probability setups I can recommend you to use my  Supply Demand indicator  and trade only if the divergence occurs inside a zone. Supply zone for bearish div and demand zone for bullish div. T
FREE
FFx MACD
Eric Venturi-Bloxs
4.2 (5)
The purpose of this new version of the MT4 standard indicator provided in your platform is to display in a sub-window multiple timeframes of the same indicator. See the example shown in the picture below. But the display isn’t like a simple MTF indicator. This is the real display of the indicator on its timeframe. Here's the options available in the FFx indicator: Select the timeframes to be displayed (M1 to Monthly) Define the width (number of bars) for each timeframe box Alert pop up/sound/ema
FREE
Free informative Indicator-helper. It'll be usefull for traders who trade many symbols or using grid systems (Averaging or Martingale). Indicator counts drawdown as percent and currency separate. It has a number of settings: Count deposite drawdown according equity value and send e-mail or notifications to user if DD more than set; Sending e-mail when max open orders reached; Shows price and remaining pips amount before MarginCall on current chart and Account generally; Display summary trade lot
FREE
このプロダクトを購入した人は以下も購入しています
Gann Made Easy は、ミスター・ギャンの理論を使用した取引の最良の原則に基づいた、プロフェッショナルで使いやすい外国為替取引システムです。 W・D・ガン。このインジケーターは、ストップロスとテイクプロフィットレベルを含む正確な買いと売りのシグナルを提供します。 PUSH通知を利用して外出先でも取引可能です。 ご購入後、取引方法の説明と優れた追加インジケーターを無料で入手するには、私にご連絡ください! おそらく、ギャンの取引手法についてはすでに何度も聞いたことがあるでしょう。通常、ギャンの理論は初心者のトレーダーだけでなく、すでにある程度の取引経験がある人にとっても非常に複雑なものです。なぜなら、ギャンの取引手法は理論的にはそれほど簡単に適用できるものではないからです。私はその知識を磨き、最良の原則を私の外国為替インジケーターに組み込むために数年を費やしました。 このインジケーターは非常に簡単に適用できます。必要なのは、それをチャートに添付し、簡単な取引推奨事項に従うだけです。このインジケーターは常に市場分析の仕事を行い、取引の機会を探します。適切なエントリーポイントを検出す
M1 SNIPER は使いやすいトレーディングインジケーターシステムです。M1時間足向けに設計された矢印インジケーターです。M1時間足でのスキャルピングのためのスタンドアロンシステムとして、また既存のトレーディングシステムの一部としても使用できます。このトレーディングシステムはM1時間足での取引に特化して設計されていますが、他の時間足でも使用できます。元々、この手法はXAUUSDとBTCUSDの取引用に設計しましたが、他の市場においても役立つと考えています。 インジケーターのシグナルは、トレンドの方向と逆方向に取引できます。インジケーターのシグナルを利用して両方向に取引するのに役立つ特別な取引テクニックをご紹介します。この手法は、特別な動的なサポートとレジスタンスの価格帯を利用することに基づいています。 ご購入後、M1 SNIPER矢印インジケーターをすぐにダウンロードできます。さらに、M1 SNIPERツールのすべてのユーザーに、以下のスクリーンショットに表示されているApollo Dynamic SRインジケーターを無料で提供しています。この2つのインジケーターを組み合わせることで
Ultimate Sniper Dashboard
Hispraise Chinedum Abraham
4.82 (22)
299ドルで割引中! 今後値上げの可能性あり! 下の説明を読んでください! 究極のスナイパーダッシュボードのための最高のエントリーシステム。究極のダイナミックレベル。(私の製品をチェックしてください) 究極のスナイパーダッシュボードはMT4多通貨テスト制限のため、ライブマーケットでのみ作動します。 究極のスナイパーダッシュボードをご紹介します。HA-Sniper、MA-Sniper、その他多くの特別なモードが含まれる最高の製品です。究極のスナイパーダッシュボードは絶対的な獣です! 初心者やエキスパートトレーダーにとって最高のソリューションです。もう二度と動きを見逃さない! シンプルさとピップを愛するトレーダーのために、特別な製品をご用意しました。シンプルでありながら、ダッシュボードは複数のカスタムアルゴリズムに基づき28の通貨ペアを監視し、すべての作業を行います。たった一つのチャートで、プロのように市場を読み解くことができます。もし、為替ペアが動き出したときに、その方向性を正確に特定することができれば、あなたの取引はどれほど改善されることでしょう。   当社のシステムは、高い確率
After purchase, contact me privately to receive 1 month of free testing with EA Forex Proton! This advanced MT4 trading robot automatically executes signals from any MT4 indicator, including Market Makers. The latest version also includes AI integration, allowing each trade signal to be analyzed using Artificial Intelligence. Live Signal with EA Forex Proton: Click here Market Makers is a powerful price action trading system designed to identify high-probability Buy and Sell opportunities based
Trend Screener
STE S.S.COMPANY
4.79 (95)
トレンドインジケーター、1つのツールに組み込まれたすべての重要なトレンド機能を備えたトレンドトレーディングとフィルタリングのための画期的なユニークなソリューション! これは、すべてのシンボル/商品(外国為替、商品、暗号通貨、インデックス、株式)で使用できる100%再描画されていないマルチタイムフレームおよびマルチ通貨インジケーターです。 期間限定オファー: サポートおよびレジスタンス スクリーナー インジケーターは、たった 50 ドルで永久的にご利用いただけます。(元の価格 250 ドル) (オファー延長) トレンドスクリーナーは、チャート内のドットで矢印トレンドシグナルを提供するインジケーターに続く効率的なインジケーターです。 トレンド分析インジケーターで使用できる機能: 1.トレンドスキャナー。 2.最大利益分析を備えたトレンドライン。 3.トレンド通貨強度メーター。 4.アラート付きのトレンド反転ドット。 5.アラート付きの強いトレンドドット。 6.トレンド矢印 毎日の分析例、毎日のシグナルパフォーマンス...など、トレンドスクリーナーインジケーターを使用して、ここで見つけること
「 Dynamic Scalper System 」インジケーターは、トレンド波の中でスキャルピング取引を行う手法のために設計されています。 主要通貨ペアと金でテスト済みで、他の取引商品との互換性があります。 トレンドに沿った短期的なポジションオープンのシグナルを提供し、追加の価格変動サポートも提供します。 インジケーターの原理 大きな矢印はトレンドの方向を決定します。 トレンド波の中では、小さな矢印の形でスキャルピングシグナルを生成するアルゴリズムが機能します。 赤い矢印は強気方向、青い矢印は弱気方向です。 トレンドの方向には敏感な価格変動ラインが描かれ、小さな矢印のシグナルと連動します。 シグナルは次のように機能します。適切なタイミングでラインが現れるとエントリーシグナルが形成され、ラインが開いている間はポジションが保持され、完了すると取引が終了します。 推奨される動作時間枠はM1~H4です。 矢印は現在のローソク足に形成され、次のローソク足が開いている場合は、前のローソク足の矢印は再描画されません。 入力パラメータ Trend Wave Period - トレンド方向
Scalper Inside PRO – Since 2020. An exclusive indicator that utilizes an innovative algorithm to swiftly and accurately determine the market trend. The indicator automatically calculates opening, closing, and profit levels, providing detailed trading statistics. With these features, you can choose the most appropriate trading instrument for the current market conditions. Additionally, you can easily integrate your own arrow indicators into Scalper Inside Pro to quickly evaluate their statistics
Super Signal – Skyblade Edition プロ仕様のノンリペイント / ノーラグ・トレンドシグナルシステム。卓越した勝率を実現 | MT4 / MT5 対応 1分足、5分足、15分足などの低い時間足で最も効果を発揮します。 主な特徴: Super Signal – Skyblade Edition は、トレンド取引に特化したスマートなシグナルシステムです。マルチレイヤーのフィルターロジックを用いて、明確な方向性と実際のモメンタムに支えられた強力なトレンドのみを検出します。 このシステムは 天井や底を予測するものではありません 。次の3つの条件がすべて満たされた場合にのみシグナルを発生させます: 明確なトレンド方向 モメンタムの増加 健全なボラティリティ構造 市場セッションに基づく流動性分析と組み合わせることで、シグナルの精度とタイミングがさらに向上します。 シグナルの特性: すべての矢印シグナルは 100% 非リペイント / 遅延なし 一度出現したシグナルは固定され、点滅・消失しません チャート上の矢印、情報パネル、ポップアップ通知、音声アラート、プッシュ通知
まず第一に、この取引ツールはノンリペイント、ノンリドロー、ノンラグの指標であり、プロの取引に理想的ですことを強調する価値があります。 オンラインコース、ユーザーマニュアル、デモ。 スマートプライスアクションコンセプトインジケーターは、新米から経験豊富なトレーダーまで、非常 に強力なツールです。Inner Circle Trader AnalysisやSmart Money Concepts Trading Strategiesなど、20以上の有用な指標を1つに組み合わせています。このインジケーターはスマートマネーコンセプトに焦点を当て、大手機関の取引方法を提供し、彼らの動きを予測するのに役立ちます。 特に、流動性分析に優れており、機関がどのように取引しているかを理解しやすくしています。市場のトレンドを予測し、価格の動きを慎重に分析するのに優れています。機関の戦略とトレードを合わせることで、市場の動向についてより正確な予測ができます。このインジケーターは多目的であり、市場構造を分析し、重要な注文ブロックを特定し、さまざまなパターンを認識するのに優れています。 このインジケーターは
Ultimate Dynamic Levels
Hispraise Chinedum Abraham
4.7 (10)
現在、ホリデーディスカウントで399ドル! 今後値上がりする可能性があります。以下の説明をお読みください。 Ultimate Dynamic Levelsの紹介 - Ultimate Sniper DashboardのBESTエントリーインジケーター! 極めてローリスクなタイムリーエントリーと高RR!!! アルティメットスナイパーダッシュボードはこちら。 初心者はもちろん、プロのトレーダーにとっても最も重要な能力は、いつどこで相場が転換するかを正確に判断し、いかに安全に参入し、利益を得て退場するかを見極めることです。 アルティメット・ダイナミック・レベルズ・インディケーターは、相場が転換する可能性が最も高い場所を簡単に教えてくれるので、極めてローリスクなトレードを自信を持って行うことができ、同時にチャートをクリーンでシンプルに保ちながら、$$$を稼ぐことができるのです! アルティメット・ダイナミック・レベルズ・インディケーターは、複数の時間枠で重要な隠れたレベルを一度に見つけるユニークで強力なアルゴリズムを持っています。また、他の典型的なSRインジケーターのように、レベルを再描
まず第一に、この取引インジケーターは再描画されず、再描画されず、遅延しないことを強調する価値があります。これにより、手動取引とロボット取引の両方に理想的なものになります。 ユーザーマニュアル:設定、入力、戦略。 アトミックアナリストは、価格の強さとモメンタムを利用して市場でより良いエッジを見つけるためのPA価格アクションインジケーターです。ノイズや誤ったシグナルを除去し、取引ポテンシャルを高めるための高度なフィルターを備えています。複雑なインジケーターの複数のレイヤーを使用して、アトミックアナリストはチャートをスキャンし、複雑な数学的計算をシンプルなシグナルと色に変換します。これにより、どのような初心者トレーダーでも理解して使用し、一貫した取引の決定を行うことができます。 「アトミックアナリスト」は、新規および経験豊富なトレーダー向けにカスタマイズされた包括的な取引ソリューションです。プレミアムインジケーターとトップノッチの機能を1つの取引戦略に組み合わせ、すべてのタイプのトレーダーにとって汎用性のある選択肢にします。 デイリートレーディングとスキャルピング戦略:高速で正確な
Route Lines Prices -は、価格の方向性を予測するために設計されたインジケーターです。シンプルなインターフェースには、価格変動と将来の方向性を計算するための複数のアルゴリズムが搭載されています。これらのアルゴリズムには、使用する時間枠に基づいたボラティリティ計算と価格平滑化が含まれています。 このインジケーターには、「 Calculating price values 」値を変更するためのパラメーターが1つだけあります。デフォルト値の1は、バランスの取れた自動計算を提供し、インジケーターを手動で設定することなく使用できます。 値を2から500まで手動で変更することで、インジケーターを独自のトレーディングシステムに合わせてカスタマイズできます。 このインジケーターは、M1からH4の時間枠での使用を推奨します。あらゆる取引銘柄で使用できます。 シグナル矢印はローソク足の終値で生成され、過去の履歴には再描画されません。 メインチャートには、重複した矢印が表示されます。 複数のアラートタイプが利用可能です。内蔵のライン軌跡カウンターは、終値に基づいて動作します。これ
PRO Renko Systemは、特別にRENKOチャートを取引するために設計された高精度の取引システムです。 これは、様々な取引商品に適用することができる普遍的なシステムです。 システムは効果的に正確な逆転信号へのアクセスを与えるいわゆる市場の騒音を中和する。 表示器は非常に使いやすく、信号の生成に責任がある1つの変数だけがあります。 あなたは簡単にお好みの任意の取引ツールとレンコバーのサイズにツールを適応させることができます。 私はいつもあなたが私のソフトウェアで収益性の高い取引を支援するために余分なサポートを提供する準備ができています! 私はあなたに幸せで収益性の高い取引をしたいです! ご購入後にご連絡ください! 私はあなたに私のレンコチャートジェネレータを送信します。 私はまた、私の個人的な推奨事項やシステムの他のモジュールを無料で共有します!
Apollo SR Master は、サポート/レジスタンスゾーンを利用した取引をより容易かつ確実にする特別な機能を備えたサポート/レジスタンスインジケーターです。このインジケーターは、ローカル価格の高値と安値を検出することで、タイムラグなしでリアルタイムにサポート/レジスタンスゾーンを計算します。そして、新たに形成されたSRゾーンを確認するために、インジケーターは特別なシグナルを表示します。このシグナルは、SRゾーンを実際の売りまたは買いシグナルとして考慮して使用できることを示します。この場合、SRゾーンの強度が高まり、SRエリアからの取引が成功する確率も高まります。これがこのインジケーターの基本的な考え方です。 SRゾーンは、ストップロスとテイクプロフィットの設定を容易にします。シグナルの方向に応じて、SRゾーンの上または下のスペースをストップロスとして設定できます。さらに、反対側のSRゾーンは、潜在的なテイクプロフィットエリアとして設定できます。 また、Apollo SRマスターインジケーターをご利用のすべてのユーザーには、「Apollo Price Action System」
通貨強さウィザードは、取引を成功させるためのオールインワン ソリューションを提供する非常に強力な指標です。このインジケーターは、複数の時間枠のすべての通貨のデータを使用して、このまたはその外国為替ペアのパワーを計算します。このデータは、使いやすい通貨インデックスと通貨パワーラインの形式で表され、特定の通貨のパワーを確認するために使用できます。 必要なのは、取引したいチャートにインジケーターを接続することだけです。インジケーターは、取引する通貨の実際の強さを示します。このインジケーターは、トレンドに合わせて取引するときに有利に利用できる売買高の圧力の極値も示します。このインジケーターには、フィボナッチに基づく可能なターゲットも表示されます。 このインジケーターは、PUSH 通知を含むあらゆるタイプのアラートを提供します。 購入後ご連絡下さい。私の取引のヒントをあなたと共有し、素晴らしいボーナスインジケーターを無料で提供します! 幸せで有益な取引をお祈りします。
現在20%OFF! 初心者やエキスパートトレーダーに最適なソリューションです。 このインディケータは、エキゾチックペア・コモディティ・インデックス・先物など、あらゆるシンボルの通貨の強さを表示することに特化したインディケータです。金、銀、原油、DAX、US30、MXN、TRY、CNHなどの通貨の強さを表示するために、9行目にどのシンボルでも追加することができます。独自の機能を多数搭載し、新しい計算式を採用したため、ユニークで高品質、かつ手頃な価格のトレーディングツールとなっています。新しいトレンドやスキャルピングチャンスのトリガーポイントを正確に把握することができるため、あなたのトレードがどのように改善されるか想像してみてください。 ユーザーマニュアル:ここをクリック   https://www.mql5.com/en/blogs/post/708876 すべての時間枠に対応します。あなたはすぐにトレンドを見ることができるようになります! 新しいアルゴリズムに基づいて設計されているため、潜在的な取引の特定と確認がより簡単になります。これは、8つの主要通貨と1つのシンボルの強弱
BTMM State Engine Pro is a MetaTrader 4 indicator for traders who use the Beat The Market Maker approach: Asian session context, kill zone timing, level progression, peak formation detection, and a multi-pair scanner from a single chart. It combines cycle state logic with a built-in scanner dashboard so you do not need the same tool on many charts at once. What it does Draws the Asian session range; session times can follow broker server offset or be set in inputs. Tracks level progression (L
Advanced Supply Demand
Bernhard Schweigert
4.91 (299)
現在40%オフ 初心者にもエキスパートトレーダーにも最適なソリューション このインジケーターは独自の機能と新しい公式を多数内蔵しており、ユニークで高品質かつ手頃な取引ツールです。このアップデートでは、2つの時間枠ゾーンを表示できるようになります。より長いTFだけでなく、チャートTFとより長いTF(ネストゾーンを表示)の両方を表示できます。すべてのSupply Demandトレーダーの皆さんのお気に召すはずです。:) 重要情報の公開 Advanced Supply Demandの可能性を最大化するには、 https://www.mql5.com/ja/blogs/post/720245 にアクセスしてください。   エントリーまたはターゲットの正確なトリガーポイントを正確に特定できれば取引がどのように改善されるか想像してみてください。新しい基盤となるアルゴリズムに基づいて構築されているため、買い手と売り手の間の潜在的な不均衡をさらに簡単に特定できます。これは、最も強い需要と供給のゾーンと、過去のパフォーマンス(古いゾーンを表示)がグラフィカルに表現されるためです。これらの機能は、最適な
現在40%オフ 初心者やエキスパートトレーダーに最適なソリューション! このインジケーターは、独自の機能と新しい計算式を取り入れた、ユニークで高品質、かつ手頃な価格のトレーディングツールです。たった1枚のチャートで28の為替ペアの通貨強度を読み取ることができます。新しいトレンドやスキャルピングチャンスの引き金となるポイントを正確に特定することができるので、あなたのトレードがどのように改善されるか想像してみてください。 ユーザーマニュアルはこちら  https://www.mql5.com/en/blogs/post/697384 これが最初の1本、オリジナルだ! 価値のないクローンを買わないでください。 特別な サブウィンドウの矢印で強い通貨の勢いを表示 GAPがあなたのトレードを導く! 基準通貨や気配値が売られすぎ・買われすぎのゾーン(外相フィボナッチレベル)にあるとき、個別チャートのメインウィンドウに警告表示。 通貨がレンジの外側から反落した場合、プルバック/リバーサルのアラート。 クロスパターンの特別なアラート 複数の時間枠を選択可能で、トレンドを素早く確認できます
- Real price is 80$ - 40% Discount (It is 49$ now) Contact me for instruction, add group and any questions! - Non-repaint - I just sell my products in Elif Kaya profile, any other websites are stolen old versions, So no any new updates or support. - Lifetime update free Related product:   Bitcoin Expert Introduction The breakout and retest strategy is traded support and resistance levels. it involves price breaking through a previous level.  The break and retest strategy is designed to help tr
GOLD Impulse with Alert
Bernhard Schweigert
4.67 (12)
このインディケータは、当社の2つの製品 Advanced Currency IMPULSE with ALERT  +   Currency Strength Exotics . のスーパーコンビネーションです。 このインジケーターは全ての時間枠で作動し、8つの主要通貨と1つのシンボルの強弱のインパルスをグラフで表示します。 このインジケータは、金、エキゾチックペア、商品、インデックス、先物など、あらゆるシンボルの通貨強度の加速度を表示することに特化されています。金、銀、原油、DAX、US30、MXN、TRY、CNHなどの通貨強度の加速度(インパルスまたは速度)を表示するために、任意のシンボルを9行目に追加できる、この種の最初のものです。 新しいアルゴリズムに基づいて構築され、潜在的な取引の特定と確認がさらに容易になりました。これは、通貨の強さや弱さが加速しているかどうかをグラフィカルに表示し、その加速の速度を測定するためです。加速すると物事は明らかに速く進みますが、これはFX市場でも同じです。つまり、反対方向に加速している通貨をペアリングすれば、潜在的に利益を生む取引を特定
Trend indicator AI
Ramil Minniakhmetov
4.53 (83)
Trend Ai indicatorは、トレンドの識別と実用的なエントリポイントと反転アラートを組み合わせることで、トレーダーの市場分析を強化する優れたツールです。 この指標は、ユーザーが自信と正確さで外国為替市場の複雑さをナビゲートすることを可能にします トレンドAiインジケーターは、主要なシグナル以外にも、プルバックやリトレースメント中に発生するセカンダリエントリポイントを識別し、トレーダーが確立されたトレンド内の価格修正を活用できるようにします。 重要な利点: *MT4およびMT5の仕事 *明確な買いまたは売りシグナル *再描画しません ·すべての資産で動作します 私はeaやセットをtelegram it詐欺で販売しないように注意してください。 すべての設定はここでブログで無料です。  重要! 指示とボーナスを得るために購入後すぐに私に連絡してください! 私の他のプロダクトと同様、実質操作の監視はここに見つけることができます: https://www.mql5.com/en/users/mechanic/seller&nbsp ; 設定および入力: すべての
Cycle Sniper
Elmira Memish
4.39 (36)
Please contact us after your purchase and we will send you the complimentary indicators to complete the system Cycle Sniper is not a holy grail but when you use it in a system which is explained in the videos, you will feel the difference. If you are not willing to focus on the charts designed with Cycle Sniper and other free tools we provide, we recommend not buying this indicator. We recommend watching the videos about the indiactor and system before purchasing. Videos, settings  and descri
Auto Optimized Parabolic RSI: 高度な3Dモメンタムエンジン ほとんどのリテール向けインジケーターは、市場のボラティリティが変化した瞬間に破綻する静的な入力値に依存しているため、失敗に終わります。Auto Optimized Parabolic RSIは、自らの数学的優位性を継続的に再計算することで「インジケーターの陳腐化」問題を解決し、機関投資家レベルの定量的適応力をMT5ターミナルに直接もたらします。 最大の強み: カスタムインメモリ3D最適化   標準的な自動最適化ツールは、インジケーターの呼び出しで端末に過負荷をかけるため、頻繁にMT5プラットフォームをフリーズさせます。本ツールは、このボトルネックを完全に回避しています。RAMベースのカスタムネイティブ計算機を内蔵した内部エンジンは、チャートを読み込んだりタイムフレームを変更したりするたびに、超高速の3Dグリッド探索を実行します。RSI期間(頻度)、SARステップ(加速度)、SAR最大値(制限速度)を同時にスイープし、プラットフォームを遅延させることなく、数万通りものパラメーターの組み合わせを絶対的
Market Structure Order Block Dashboard MT4 は、市場構造と価格の主要な反応ゾーンをチャート上で直接読み取りたいトレーダーのために設計された MetaTrader 4 用インジケーターです。BOS、ChoCH、Order Blocks、Fair Value Gaps (FVG)、流動性、Kill Zones、Volume Profile、そして素早い分析のためのコンパクトなダッシュボードを統合しています。 このインジケーターは、市場構造、ICT および Smart Money の概念を意思決定の枠組みとして使用するトレーダーを対象としています。トレンド継続、潜在的反転、価格不均衡、流動性ターゲット、関心ゾーンをより構造的に把握するのに役立ちます。 購入者向けリソース 購入後に MQL5 プライベートメッセージで簡単にリクエストするだけで、完全な PDF ユーザーガイドとパラメーター設定のヒントが入手可能です。MQL5 プライベートメッセージで直接技術サポートを提供します。 この MT4 バージョンは MT5 バージョン 1.20 のすべての機能を
Volatility Trend System - a trading system that gives signals for entries. The volatility system gives linear and point signals in the direction of the trend, as well as signals to exit it, without redrawing and delays. The trend indicator monitors the direction of the medium-term trend, shows the direction and its change. The signal indicator is based on changes in volatility and shows market entries. The indicator is equipped with several types of alerts. Can be applied to various trading ins
Linear Trend Predictor ー - エントリ ポイントと方向サポート ラインを組み合わせたトレンド インジケーター。高値/安値チャネルを突破するという原理に基づいて機能します。 インジケーターのアルゴリズムは市場のノイズをフィルタリングし、ボラティリティと市場の動向を考慮します。 インジケーターの機能  平滑化手法を使用して、市場のトレンドと、買い注文または売り注文を開くためのエントリー ポイントを表示します。  任意の時間枠のチャートを分析して、短期および長期の市場の動きを判断するのに適しています。  あらゆる市場や時間枠に適応可能な入力パラメータにより、トレーダーはインジケーターを独自にカスタマイズできます。  設定されたインジケーター信号は消えず、再描画もされません。ローソク足の終値で決定されます。  いくつかの種類の通知が矢印と組み合わされています。  このインジケーターは、独立した取引システムとして使用することも、他の取引システムへの追加として使用することもできます。  あらゆるレベルの経験を持つトレーダーが使用できます。 主なパラメータ Vol
After purchase, contact me in private to get 7 days of FREE testing with EA Forex Proton where the robot automatically takes the trade alerts from MBFX Timing! MBFX Timing is an indicator that was developed and created by Mostafa Belkhayate, one of the best traders in the world. We decided to create a modified version that takes inspiration from the Stochastic Oscillator and the Relative Strength Quality Index indicators to improve your trading.  One of the main reasons we released MBFX Timing
Easy Reversal is designed to help traders spot turning points in the market with clear buy and sell signals. The indicator is based on the Keltner Channel but improved with a custom calculation that uses ATR and EMA confirmation. This makes it more reliable and less noisy than standard reversal tools.  The signals from Easy Reversal appear directly from peak candlestick behavior, showing you when price action is reaching exhaustion. A buy signal is generated when a candlestick forms a strong r
Miraculous Indicator – ガン・スクエア・オブ・ナインに基づく100%非リペイントのFXおよびバイナリーツール この動画では、FXおよびバイナリーオプションのトレーダー向けに特別に開発された、非常に正確で強力な取引ツールである Miraculous Indicator を紹介しています。このインジケーターがユニークなのは、伝説的な ガン・スクエア・オブ・ナイン と ガンの振動の法則 に基づいている点で、現代の取引で利用できる最も正確な予測ツールの一つとなっています。 Miraculous Indicatorは 完全に非リペイント であり、ローソク足が確定した後にシグナルが変化したり消えたりすることはありません。つまり、見たものがそのまま利用できます。これにより、トレーダーは自信を持ってエントリーおよびエグジットを行うための信頼性と一貫性のある根拠を得ることができます。 主な特徴: ガン・スクエア・オブ・ナインとガン理論に基づいて構築 100%非リペイントのシグナルシステム すべての時間枠(M1、M5、H1、H4、日足、週足)で機能 FXおよびバイナリーオプション取引
作者のその他のプロダクト
MarketSessions Indicator The Essential Tool for Global Market Session Visualization The MarketSessions indicator is a powerful MT4 tool designed to help traders visualize major forex market sessions directly on their charts. By clearly displaying the active trading hours of Sydney, Tokyo, London, and New York markets, this indicator helps you identify optimal trading periods and understand market volatility patterns. Key Features: Clear visualization of all four major trading sessions (Sydney, T
FREE
Fair Value Gaps (FVG) Indicator for MT4 The Fair Value Gaps (FVG) Indicator is a powerful technical analysis tool designed to identify and visualize significant price imbalances in the market. These gaps, created when price makes a strong directional move, represent areas where price has moved so quickly that no trading activity occurred, potentially indicating institutional interest and strong market momentum. Key Features: Dual Gap Detection : Automatically identifies both Supply FVGs (bearish
FREE
Bulls&Bears v8.45 — Intelligent Grid Trading with Dynamic Power Analysis Fully automated Expert Advisor that identifies market direction using smoothed Bears Power and Bulls Power indicators, confirmed by an RSI filter. Once a signal is detected, the EA opens an initial position and builds a grid of orders with martingale lot scaling. Grid spacing adapts dynamically to current market volatility. How It Works Signal Detection: The EA calculates a smoothed moving average on both Bears Power and Bu
フィルタ:
レビューなし
レビューに返信