Average Moving of Moving Average

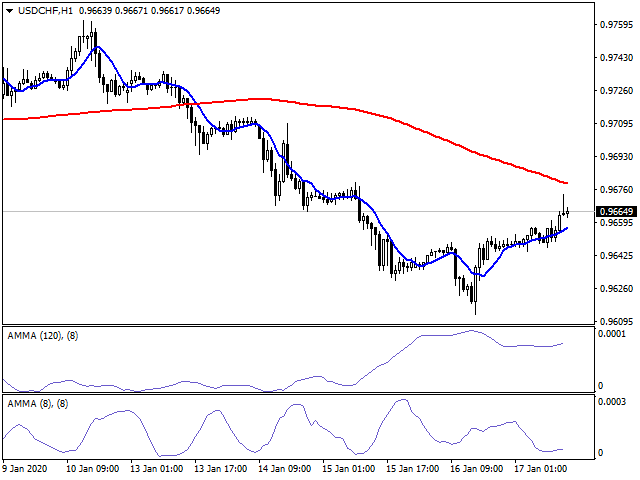
This indicator calculates average speed of moving average indicator.

Here is parameters:

BarsToProcess - indicator calculating period;

MaPeriod - period of Moving Average indicator;

AveragingPeriod - period (MA values) of the basis of which the average value is calculated;

MA_Method, MA_Apply_to - using to set MA indicator parameters;

Thats all! Good luck.

おすすめのプロダクト
GTAS STrend
Riviera Systems
4.5 (2)
GTAS S-Trend is a momentum indicator that helps to determine trends using combination of MACD, RSI and moving averages. This indicator was created by Bernard Prats Desclaux, proprietary trader and ex-hedge fund manager, founder of E-Winvest. Description The indicator oscillates between -65 and +65 with a neutral zone between -25 and +25 around a 0 equilibrium line. S-Trend between -25 and +25 indicates congestion zones with a bullish bias between 0 and +25, and a bearish bias between 0 and -25.
FREE
無限からの通貨の強さを測定するためのこの革新的な指標は、長い間取引されているダフ屋やトレーダーにとって不可欠な助手です。 通貨の強さ/弱さを分析するためのシステムは、世界の主要なトレーダーによって市場で長い間知られており、使用されてきました。 任意の裁定取引は、この分析なしでは完全ではありません。 私たちの指標は、互いに関連して基本通貨の強さを簡単に決定します。 これは、インスタント分析を可能にし、最強のエントリポイントを検索し、すべてまたは現在の通貨ペアの折れ線グラフが表示されます。 インジケータは直感的で、すぐに見つけて任意のペアに切り替えることができ、地下室とメインチャートの両方に配置できるモバイルパネルがあります。 通貨の強さの変化の通知のタイマーモードは、トレーダーに電話で通知を受け取る機会を与えます。  通貨パワーメーターインフィニティ指標を使用するためのいくつかの戦略: 1. 通貨の強さの線形表示のチャートを使用して、交差点を新興トレンドの信号として検索します 2. トレンド反転信号が表示された後、強い通貨の方向に頭皮 3. 通貨の強さの発散分析を使用して、現在の
FREE
よって上りと下りが表示され、弾倉を開いたり閉じたりすることができます。 パラメータリストの説明: extern int Price=0;/指標初期計算平均価格 extern int Length=20;/指標計算平均周期は、MAの平均周期に相当する。 extern int Displace=0 extern int Filter=0//フィルターカラム数 extern int Color=1;/上り色 extern int ColorBarBack=0;/下り色 extern double Deviation=0.0;/逸脱 extern int BarsToDraw=2000;/柱の数を計算する extern book AlertsOn=true;//オープンまたはクローズボックスのヒント extern int RemindFrequency=60;/フレームの周波数は、デフォルトでは1分間に1回です。
FREE
Pivot Mean Oscillator (PMO) is a unbounded zero-centered oscillator that provides a quick and normalized measure of divergence between two spreads. Detailed description of the mathematical formulation along with some comments and experiments can be found in this article .  Trading aspects This version of PMO is tuned on spreads relative to Close and Open price signals against their cumulative moving average (CMA). Positive PMO(m,n) values means that last (normalized) m Close prices are higher t
FREE
FFx Fractals
Eric Venturi-Bloxs
4.5 (2)
The purpose of this new version of the MT4 standard indicator provided in your platform is to display in a sub-window multiple timeframes of the same indicator. See the example shown in the picture below. But the display isn’t like a simple MTF indicator. This is the real display of the indicator on its timeframe. Here's the options available in the FFx indicator: Select the timeframes to be displayed (M1 to Monthly) Define the width (number of bars) for each timeframe box Alert pop up/sound/ema
FREE
The   OHLC indicator   shows the current and historical values of High, Low, Open, Close and Mid for a specific time period. It can plot the current values or the values from the previous session. The indicator's range can be calculated from a daily, weekly, monthly, or user-specified session. Levels High  of the current or previous session. Low  of the current or previous session. Open  of current or previous session. Close  of the current or previous session. Midpoint  of the current or prev
FREE
A trend indicator based on the CCI indicator. ZI Trend PaintBar Indicator is an improved variant of the CCI indicator, which shows the moment of trend following quite accurately. Combination of CCI indicator makes a better use of these advantages: Colored candlesticks showing the trend direction based on CCI indicator. Messages/Sounds (Notifications and sound settings) Mail - enable/disable sending emails. Alerts - enable/disable messages in the terminal when signals occur. Push - enable/disable
With the MACD Multi Time Frame indicator, you can spot divergences of higher timeframes while you are searching for pinpointed entries on lower timeframes. This FREE version of the indicator works only on EURUSD and GBPUSD. The full version of the indicator can be found here: MACD Multi Time Frame This blog post gives you REAL-TIME MACD Divergence Analysis for FREE and tips how to trade the divergences: REAL-TIME MACD Divergence Analysis The MACD Multi Time Frame gives you a very good overview o
FREE
FFx Momentum
Eric Venturi-Bloxs
4 (1)
The purpose of this new version of the MT4 standard indicator provided in your platform is to display in a sub-window multiple timeframes of the same indicator. See the example shown in the picture below. But the display isn’t like a simple MTF indicator. This is the real display of the indicator on its timeframe. Here's the options available in the FFx indicator: Select the timeframes to be displayed (M1 to Monthly) Define the width (number of bars) for each timeframe box Alert pop up/sound/ema
FREE
Italo Trend Indicator
Italo Santana Gomes
4.76 (33)
BUY INDICATOR AND GET EA FOR FREE AS A BONUS + SOME OTHER GIFTS! ITALO TREND INDICATOR  is the best trend indicator on the market, the Indicator works on all time-frames and assets, indicator built after 7 years of experience on forex and many other markets. You know many trend indicators around the internet are not complete, does not help, and it's difficult to trade, but the Italo Trend Indicator is different , the Italo Trend Indicator shows the signal to buy or sell, to confirm the signal t
FFx ParabolicSAR
Eric Venturi-Bloxs
4.67 (3)
The purpose of this new version of the MT4 standard indicator provided in your platform is to display in a sub-window multiple timeframes of the same indicator. See the example shown in the picture below. But the display isn’t like a simple MTF indicator. This is the real display of the indicator on its timeframe. Here's the options available in the FFx indicator: Select the timeframes to be displayed (M1 to Monthly) Define the width (number of bars) for each timeframe box Alert pop up/sound/ema
FREE
FFx MACD
Eric Venturi-Bloxs
4.2 (5)
The purpose of this new version of the MT4 standard indicator provided in your platform is to display in a sub-window multiple timeframes of the same indicator. See the example shown in the picture below. But the display isn’t like a simple MTF indicator. This is the real display of the indicator on its timeframe. Here's the options available in the FFx indicator: Select the timeframes to be displayed (M1 to Monthly) Define the width (number of bars) for each timeframe box Alert pop up/sound/ema
FREE
Moving Average Convergence Divergence(MACD)トレーディング戦略は、勢いとトレンドの方向の変化を特定するために使用される人気のあるテクニカル分析ツールです。 MACDは、26期間の指数移動平均(EMA)から12期間のEMAを引いて計算されます。 MACDの上には、トリガーとして機能する9期間のEMAである「シグナルライン」がプロットされます。 MACDラインがシグナルラインの上にある場合、MACDはブルッシュ領域と見なされ、下にある場合はベア領域と見なされます。トレーダーはこの情報を使用して、潜在的な買いと売りの機会を特定することがよくあります。 MACDは多目的な指標であり、さまざまな方法で使用できます。一般的な使用方法のいくつかは次のとおりです。 クロスオーバー:MACDラインがシグナルラインを上回るときにはブルッシュクロスオーバーが発生し、MACDラインがシグナルラインを下回るときにはベアクロスオーバーが発生します。 ダイバージェンス:MACDが新しい高値をつけている間に基礎となるセキュリティがそうでない場合、ブルッシュダイバージェンスが発
FREE
+ 2 bonus strategies! Alerts! I recommend watching my advisor -   Night Zen EA The indicator combines the most popular moving average strategies: Simple moving average crossover. Moving average crossover relative to the position of the slower moving average. 2 bonus strategies : The crossing of the fast moving average with the calculation of the opening prices of the slow moving average with the calculation of the closing prices taking into account the slower moving average. (The settings for th
FREE
The Analytical cover trend indicator is a revolutionary trend trading and filtering solution with all the important features of a trend tool built into one tool! The Analytical cover indicator is good for any trader, suitable for any trader for both forex and binary options. You don’t need to configure anything, everything is perfected by time and experience, it works great during a flat and in a trend. The Analytical cover trend indicator is a tool for technical analysis of financial markets
This classic "old school" MAGIC MACD indicator gives you the cross of the parameters you set. Standart setting is (12,26,9) . The arrows give you a possible change of trend. Be careful and do not use this indicator as a single signal source. FREE version  Please feel free to check out our other REX indicator series. We do have other free indicators.     "OLD BUT GOLD"
FREE
The indicator displays signals according to the strategy of Bill Williams on the chart. Demo version of the indicator has the same features as the paid, except that it can work only on a demo account . Signal "First Wise Man" is formed when there is a divergent bar with angulation.  Bullish divergent bar - with lower minimum and closing price in the upper half. Bearish divergent bar - higher maximum and the closing price at the bottom half. Angulation is formed when all three lines of Alligator
FREE
「調整可能なフラクタル」はフラクタル インジケーターの高度なバージョンで、非常に便利なトレーディング ツールです。 - ご存知のとおり、標準フラクタル mt4 インジケーターには設定がまったくありません。これはトレーダーにとって非常に不便です。 - 調整可能なフラクタルは、この問題を解決しました。必要な設定がすべて揃っています。 - インジケーターの調整可能な期間 (推奨値 - 7 以上)。 - 価格の高値/安値からの距離を調整可能。 - フラクタル矢印のデザインを調整可能。 - インジケーターにはモバイルおよび PC アラートが組み込まれています。 高品質のトレーディングロボットとインジケーターをご覧になるにはここをクリックしてください! これは、この MQL5 Web サイトでのみ提供されるオリジナル製品です。
FFx RSI
Eric Venturi-Bloxs
4 (1)
The purpose of this new version of the MT4 standard indicator provided in your platform is to display in a sub-window multiple timeframes of the same indicator. See the example shown in the picture below. But the display isn’t like a simple MTF indicator. This is the real display of the indicator on its timeframe. Here's the options available in the FFx indicator: Select the timeframes to be displayed (M1 to Monthly) Define the width (number of bars) for each timeframe box Alert pop up/sound/ema
FREE
マルチタイムフレーム対応、カスタマイズ可能なビジュアルシグナル、設定可能なアラートシステムを備えたAwesome Oscillator(AO)インジケーター。 フリーランスプログラミングサービス、アップデート、その他のTrueTL製品は私の MQL5プロフィール からご利用いただけます。 フィードバックとレビューを大歓迎します! AOとは? Awesome Oscillator(AO)は、ビル・ウィリアムズが開発したモメンタム指標で、中間価格(高値+安値)/2の34期間と5期間のSimple Moving Average(SMA)の差を計算することで市場のモメンタムを測定します。このインジケーターは、市場の全体的な方向性と潜在的な反転ポイントを識別するのに役立ちます。 AOはゼロラインを中心に振動します。正の値は強気のモメンタムを示し(速いSMAが遅いSMAを上回っている)、負の値は弱気のモメンタムを示します。ヒストグラム表示によりモメンタムの変化を視覚化しやすくなります:ヒストグラムがゼロより上で上昇している場合、強気のモメンタムが増加しています;ゼロより下で下落している場合、
FREE
Follow The Line
Oliver Gideon Amofa Appiah
3.94 (16)
FOLLOW THE LINE GET THE FULL VERSION HERE: https://www.mql5.com/en/market/product/36024 This indicator obeys the popular maxim that: "THE TREND IS YOUR FRIEND" It paints a GREEN line for BUY and also paints a RED line for SELL.  It gives alarms and alerts of all kinds. IT DOES NOT REPAINT and can be used for all currency pairs and timeframes. Yes, as easy and simple as that. Even a newbie can use it to make great and reliable trades. NB: For best results, get my other premium indicators for more
FREE
The Scaled Awesome Oscillator (SAO) represents a refined adaptation of the Awesome Oscillator, aimed at establishing consistent benchmarks for identifying market edges. Unlike the standard Awesome Oscillator, which records the variation in pips across different commodities, the only unchanging reference point is the zero line. This limitation hampers investors and traders from pinpointing specific levels for trend reversals or continuations using the traditional Awesome Indicator, a creation of
FREE
外国為替マーケットプロファイル(略してFMP) これは何ではありません: FMPは、従来の文字コード化されたTPO表示ではなく、チャートデータプロファイルの計算全体を表示しません。また、チャートを期間に分割して計算しません。 それが何をするか: 最も重要なことは、FMPインジケーターは、ユーザー定義のスペクトルの左端とユーザー定義のスペクトルの右端の間にあるデータを処理することです。 ユーザーは、インジケーターの両端をマウスで引くだけでスペクトルを定義できます。 インジケーターの右端がライブバーに引き寄せられ、さらに(将来に)引っ張られると、インジケーターは「ライブ」と見なされます(新しいバーで更新されます) インジケーターは、アタッチされているチャートに「アンカー」オブジェクトをドロップし、その後、そのアンカーをハードドライブ上のファイルに関連付けます。 これにより、チャート(またはインジケーター)が閉じられるまで、再起動しても設定が維持された状態で、チャート上で継続的なFMPを実行できます。 FMPインジケーターは、1つのチャート上でそれ自体の多くのインスタンスを実行でき、
FREE
FFx Stochastic
Eric Venturi-Bloxs
4.6 (5)
The purpose of this new version of the MT4 standard indicator provided in your platform is to display in a sub-window multiple timeframes of the same indicator. See the example shown in the picture below. But the display isn’t like a simple MTF indicator. This is the real display of the indicator on its timeframe. Here's the options available in the FFx indicator: Select the timeframes to be displayed (M1 to Monthly) Define the width (number of bars) for each timeframe box Alert pop up/sound/ema
FREE
Free informative Indicator-helper. It'll be usefull for traders who trade many symbols or using grid systems (Averaging or Martingale). Indicator counts drawdown as percent and currency separate. It has a number of settings: Count deposite drawdown according equity value and send e-mail or notifications to user if DD more than set; Sending e-mail when max open orders reached; Shows price and remaining pips amount before MarginCall on current chart and Account generally; Display summary trade lot
FREE
The indicator calculates the current spread for each tick using the formula Spread=(ASK-BID)/Point. Schedule of changes in the boundaries spread over the timeframe displayed in a separate window from the date of accession of the indicator. Two lines corresponding to the minimum and maximum spread values are displayed. The indicator window is self-adjusted according to the minimum and maximum values from the moment of launch. The minimum and maximum values for the entire period of the indicator o
FREE
Coloured Bollinger Bands The Coloured Bollinger Bands indicator is an enhanced version of the standard Bollinger Bands, offering customizable features to suit your trading needs. It uses the classic Simple Moving Average (SMA) as the middle band, and allows you to easily change the appearance of the bands, including the option to select colors and line types, ensuring better visual clarity and adaptability on your charts
FREE
FFx ATR
Eric Venturi-Bloxs
5 (1)
The purpose of this new version of the MT4 standard indicator provided in your platform is to display in a sub-window multiple timeframes of the same indicator. See the example shown in the picture below. But the display isn’t like a simple MTF indicator. This is the real display of the indicator on its timeframe. Here's the options available in the FFx indicator: Select the timeframes to be displayed (M1 to Monthly) Define the width (number of bars) for each timeframe box Alert pop up/sound/ema
FREE
Perfected RSI (Relative Strength Index) HTF (Higher Time Frame) is perhaps the most advanced and reliable HTF indicator. Highly optimized in terms of execution, the indicator comes with standard settings of the RSI indicator which is supplied with the MT4 platform. Place the indicator on the chart, any timeframe.  You may select a higher time frame in indicator inputs. The same indicator can be used on a chart multiple times to draw RSI from multiple timeframes or for different RSI period values
FREE
FFx Bollinger Bands
Eric Venturi-Bloxs
4.75 (4)
The purpose of this new version of the MT4 standard indicator provided in your platform is to display in a sub-window multiple timeframes of the same indicator. See the example shown in the picture below. But the display isn’t like a simple MTF indicator. This is the real display of the indicator on its timeframe. Here's the options available in the FFx indicator: Select the timeframes to be displayed (M1 to Monthly) Define the width (number of bars) for each timeframe box Alert pop up/sound/ema
FREE
このプロダクトを購入した人は以下も購入しています
Gann Made Easy は、ミスター・ギャンの理論を使用した取引の最良の原則に基づいた、プロフェッショナルで使いやすい外国為替取引システムです。 W・D・ガン。このインジケーターは、ストップロスとテイクプロフィットレベルを含む正確な買いと売りのシグナルを提供します。 PUSH通知を利用して外出先でも取引可能です。 購入後に私に連絡して、取引のヒント、ボーナス、および「GANN MADE EASY」EA アシスタントを無料で入手してください。 おそらく、ギャンの取引手法についてはすでに何度も聞いたことがあるでしょう。通常、ギャンの理論は初心者のトレーダーだけでなく、すでにある程度の取引経験がある人にとっても非常に複雑なものです。なぜなら、ギャンの取引手法は理論的にはそれほど簡単に適用できるものではないからです。私はその知識を磨き、最良の原則を私の外国為替インジケーターに組み込むために数年を費やしました。 このインジケーターは非常に簡単に適用できます。必要なのは、それをチャートに添付し、簡単な取引推奨事項に従うだけです。このインジケーターは常に市場分析の仕事を行い、取引の機会を探しま
An exclusive indicator that utilizes an innovative algorithm to swiftly and accurately determine the market trend. The indicator automatically calculates opening, closing, and profit levels, providing detailed trading statistics. With these features, you can choose the most appropriate trading instrument for the current market conditions. Additionally, you can easily integrate your own arrow indicators into Scalper Inside Pro to quickly evaluate their statistics and profitability. Scalper Inside
Game Changerは、あらゆる金融商品で使用できる革新的なトレンドインジケーターです。MetaTraderを強力なトレンドアナライザーへと変貌させます。あらゆる時間枠で動作し、トレンドの特定、反転の可能性のシグナル、トレーリングストップ機能、そして迅速な市場反応のためのリアルタイムアラートを提供します。経験豊富なプロでも、優位性を求める初心者でも、このツールは自信と規律、そして根本的なトレンドダイナミクスを明確に理解した上で取引を行うための力となります。このインジケーターはリドロー機能も備えています。 購入後すぐにご連絡いただければ、個人ボーナスを進呈いたします。Strong SupportとTrend Scannerインジケーターの無料コピーを入手できます。[email protected]までプライベートメッセージを送ってください。 私のEAや特別なセットはTelegramでは販売しておりません。MQL5でのみ販売しており、セットファイルは私のブログでのみ公開しています。詐欺師にはご注意ください。他の方からセットを購入しないでください。 設定 トレンド変化時のアラート
GOLD Impulse with Alert
Bernhard Schweigert
4.64 (11)
このインディケータは、当社の2つの製品 Advanced Currency IMPULSE with ALERT  +   Currency Strength Exotics . のスーパーコンビネーションです。 このインジケーターは全ての時間枠で作動し、8つの主要通貨と1つのシンボルの強弱のインパルスをグラフで表示します。 このインジケータは、金、エキゾチックペア、商品、インデックス、先物など、あらゆるシンボルの通貨強度の加速度を表示することに特化されています。金、銀、原油、DAX、US30、MXN、TRY、CNHなどの通貨強度の加速度(インパルスまたは速度)を表示するために、任意のシンボルを9行目に追加できる、この種の最初のものです。 新しいアルゴリズムに基づいて構築され、潜在的な取引の特定と確認がさらに容易になりました。これは、通貨の強さや弱さが加速しているかどうかをグラフィカルに表示し、その加速の速度を測定するためです。加速すると物事は明らかに速く進みますが、これはFX市場でも同じです。つまり、反対方向に加速している通貨をペアリングすれば、潜在的に利益を生む取引を特定
Miraculous Indicator – ガン・スクエア・オブ・ナインに基づく100%非リペイントのFXおよびバイナリーツール この動画では、FXおよびバイナリーオプションのトレーダー向けに特別に開発された、非常に正確で強力な取引ツールである Miraculous Indicator を紹介しています。このインジケーターがユニークなのは、伝説的な ガン・スクエア・オブ・ナイン と ガンの振動の法則 に基づいている点で、現代の取引で利用できる最も正確な予測ツールの一つとなっています。 Miraculous Indicatorは 完全に非リペイント であり、ローソク足が確定した後にシグナルが変化したり消えたりすることはありません。つまり、見たものがそのまま利用できます。これにより、トレーダーは自信を持ってエントリーおよびエグジットを行うための信頼性と一貫性のある根拠を得ることができます。 主な特徴: ガン・スクエア・オブ・ナインとガン理論に基づいて構築 100%非リペイントのシグナルシステム すべての時間枠(M1、M5、H1、H4、日足、週足)で機能 FXおよびバイナリーオプション取引
このインジケーターは、反転ポイントと価格戻りゾーンを正確に表示します。     主要プレーヤー 。新たなトレンドが形成される場所を把握し、最大限の精度で意思決定を行い、すべての取引をコントロールします。 TREND LINES PRO インジケーターと組み合わせることで、その潜在能力を最大限に発揮します。 VERSION MT5 インジケーターが示す内容: 新しいトレンドの始まりに活性化する反転構造と反転レベル。 リスクと報酬の比率を最小限に抑えた利益 確定 と 損失停止の レベルの表示     RR 1:2   。 インテリジェントな削減ロジックによるストップロス。 指定されたインジケーターから 2 つのトレンド タイプの反転パターンを表示します。 指標: トレンドを追う   TREND LINES PRO   (世界的なトレンドの変化) TREND PRO   (クイックトレンド変更) シンプルで効果的   スキャナー   リアルタイムトレンド(新機能)。 マルチタイムフレームのインストゥルメント フィルタリング。 画面   利益     LOGIC AI信号の後。 当日プラス方
M1 SNIPER は使いやすいトレーディングインジケーターシステムです。M1時間足向けに設計された矢印インジケーターです。M1時間足でのスキャルピングのためのスタンドアロンシステムとして、また既存のトレーディングシステムの一部としても使用できます。このトレーディングシステムはM1時間足での取引に特化して設計されていますが、他の時間足でも使用できます。元々、この手法はXAUUSDとBTCUSDの取引用に設計しましたが、他の市場においても役立つと考えています。 インジケーターのシグナルは、トレンドの方向と逆方向に取引できます。インジケーターのシグナルを利用して両方向に取引するのに役立つ特別な取引テクニックをご紹介します。この手法は、特別な動的なサポートとレジスタンスの価格帯を利用することに基づいています。 ご購入後、M1 SNIPER矢印インジケーターをすぐにダウンロードできます。さらに、M1 SNIPERツールのすべてのユーザーに、以下のスクリーンショットに表示されているApollo Dynamic SRインジケーターを無料で提供しています。この2つのインジケーターを組み合わせることで
Dynamic Forex28 Navigator - 次世代の Forex 取引ツール。 現在 49% オフ。 Dynamic Forex28 Navigator は、長年人気のインジケーターを進化させたもので、3 つの機能を 1 つにまとめています。 Advanced Currency Strength28 インジケーター (レビュー 695 件)  + Advanced Currency IMPULSE with ALERT (レビュー 520 件) + CS28 コンボ シグナル (ボーナス)。 インジケーターの詳細 https://www.mql5.com/en/blogs/post/758844 次世代の Strength インジケーターが提供するもの  オリジナルで気に入っていたすべての機能が、新機能と精度の向上によって強化されました。 主な機能: 独自の通貨強度計算式。 すべての時間枠でスムーズかつ正確な強度ライン。 トレンドの特定と正確なエントリーに最適です。 ダイナミックマーケットフィボナッチレベル (マーケットフィボナッチ)。 このインジケーターに固有
Precautions for subscribing to indicator This indicator only supports the computer version of MT4 Does not support MT5, mobile phones, tablets The indicator only shows the day's entry arrow The previous history arrow will not be displayed (Live broadcast is for demonstration) The indicator is a trading aid Is not a EA automatic trading No copy trading function The indicator only indicates the entry position No exit (target profit)  The entry stop loss point is set at 30-50 PIPS Or the front hi
通貨強さウィザードは、取引を成功させるためのオールインワン ソリューションを提供する非常に強力な指標です。このインジケーターは、複数の時間枠のすべての通貨のデータを使用して、このまたはその外国為替ペアのパワーを計算します。このデータは、使いやすい通貨インデックスと通貨パワーラインの形式で表され、特定の通貨のパワーを確認するために使用できます。 必要なのは、取引したいチャートにインジケーターを接続することだけです。インジケーターは、取引する通貨の実際の強さを示します。このインジケーターは、トレンドに合わせて取引するときに有利に利用できる売買高の圧力の極値も示します。このインジケーターには、フィボナッチに基づく可能なターゲットも表示されます。 このインジケーターは、PUSH 通知を含むあらゆるタイプのアラートを提供します。 購入後ご連絡下さい。私の取引のヒントをあなたと共有し、素晴らしいボーナスインジケーターを無料で提供します! 幸せで有益な取引をお祈りします。
トレンドラインプロ   市場の真の方向転換点を理解するのに役立ちます。この指標は、真のトレンド反転と主要プレーヤーが再び参入するポイントを示します。 分かりますか     BOSライン   複雑な設定や不要なノイズなしに、より長い時間足でのトレンドの変化と重要なレベルを把握できます。シグナルは再描画されず、バーが閉じた後もチャート上に残ります。 VERSION MT 5     -     RFI LEVELS PRO インジケーター と組み合わせることで、その潜在能力を最大限に発揮します。 インジケーターが示す内容: 本当の変化   トレンド(BOSライン) 一度シグナルが現れたら、それは有効です!これは、リペイント機能を持つインジケーターとの重要な違いです。リペイント機能を持つインジケーターは、シグナルを発した後、それを変更し、資金の損失につながる可能性があります。これにより、より高い確率と精度で市場に参入できます。また、矢印が現れた後、目標値(利益確定)に達するか、反転シグナルが現れるまで、ローソク足の色を変更する機能もあります。 繰り返しエントリ       主要プレーヤーの
現在40%OFF! 初心者やエキスパートトレーダーのためのベストソリューション! このダッシュボードソフトウェアは、28の通貨ペアで動作しています。それは私達の主要な指標(高度な通貨の強さ28と高度な通貨インパルス)の2に基づいています。それは全体の外国為替市場の大きい概観を与えます。それは、すべての(9)時間枠で28の外国為替ペアのための高度な通貨の強さの値、通貨の動きの速度と信号を示しています。チャート上で1つのインディケータを使用して市場全体を観察し、トレンドやスキャルピングの機会をピンポイントで見つけることができたら、あなたのトレードがどのように改善されるか想像してみてください。 このインディケータには、強い通貨と弱い通貨の識別、潜在的な取引の識別と確認がより簡単になるような機能が搭載されています。このインディケータは、通貨の強さや弱さが増加しているか減少しているか、また、すべての時間枠でどのように機能しているかをグラフィカルに表示します。 新機能として、現在の市場環境の変化に適応するダイナミックなマーケットフィボナッチレベルが追加され、すでに当社のAdvanced
Volatility Trend System - a trading system that gives signals for entries. The volatility system gives linear and point signals in the direction of the trend, as well as signals to exit it, without redrawing and delays. The trend indicator monitors the direction of the medium-term trend, shows the direction and its change. The signal indicator is based on changes in volatility and shows market entries. The indicator is equipped with several types of alerts. Can be applied to various trading ins
現在20%OFF! 初心者やエキスパートトレーダーに最適なソリューションです。 このインディケータは、エキゾチックペア・コモディティ・インデックス・先物など、あらゆるシンボルの通貨の強さを表示することに特化したインディケータです。金、銀、原油、DAX、US30、MXN、TRY、CNHなどの通貨の強さを表示するために、9行目にどのシンボルでも追加することができます。独自の機能を多数搭載し、新しい計算式を採用したため、ユニークで高品質、かつ手頃な価格のトレーディングツールとなっています。新しいトレンドやスキャルピングチャンスのトリガーポイントを正確に把握することができるため、あなたのトレードがどのように改善されるか想像してみてください。 ユーザーマニュアル:ここをクリック   https://www.mql5.com/en/blogs/post/708876 すべての時間枠に対応します。あなたはすぐにトレンドを見ることができるようになります! 新しいアルゴリズムに基づいて設計されているため、潜在的な取引の特定と確認がより簡単になります。これは、8つの主要通貨と1つのシンボルの強弱
Gold Scalper Super is an easy-to-use trading system. The indicator can be used as a standalone scalping system on the M1 time frame, as well as part of your existing trading system. Bonus: when purchasing an indicator, Trend Arrow Super is provided free of charge, write to us after purchase. The indicator 100% does not repaint!!! If a signal appears, it does not disappear! Unlike indicators with redrawing, which lead to the loss of a deposit, because they can show a signal and then remove it.
Smart Sweep Sniper MT4
Vincent Georges David Ferrier
# Smart Sweep Sniper MT4 Version MT4 Midnight Pro Edition , specialized for scalping and day trading in Prop Firm, Available here MT5 Version available here ## The Institutional Edge — Detect Where Smart Money Acts, Enter When It Matters If you like it, leave a positive review to support its development. If you encounter a bug, let us know before posting a review. When you complete your challenge, share your certificate in the comments. Happy trading! Smart Sweep Sniper is a precision-engine
Looking for a powerful yet lightweight swing detector that accurately identifies market structure turning points? Want clear, reliable buy and sell signals that work across any timeframe and any instrument? Buy Sell Arrow MT Swing is built exactly for that — precision swing detection made simple and effective. This indicator identifies Higher Highs (HH) , Higher Lows (HL) , Lower Highs (LH) , and Lower Lows (LL) with remarkable clarity. It is designed to help traders easily visualize market stru
FX Volume
Daniel Stein
4.63 (38)
FX Volume:ブローカー視点で捉える本物の市場センチメント クイック概要 トレード手法をさらに高めたいとお考えですか? FX Volume は、リテールトレーダーやブローカーのポジション状況をリアルタイムで提供します。これは、COTのような遅延レポートよりもはるかに早く知ることができます。安定した利益を目指す方も、さらなる優位性を求める方も、 FX Volume は大きな不均衡を見極め、ブレイクアウトを確認し、リスク管理を洗練させるのに役立ちます。今すぐ始めて、実際の出来高データがどのように意思決定を変革するかを体感してください! 1. FX Volume がトレーダーにとって非常に有益な理由 高精度の早期警戒シグナル • 各通貨ペアを売買しているトレーダー数を、他者よりも早く、ほぼリアルタイムで把握できます。 • FX Volume は、複数のリテールブローカーから得られる本物の出来高データを収集し、分かりやすい形式で提供する 唯一 のツールです。 強力なリスク管理 • ロングやショートの大きな偏り(インバランス)を特定し、潜在的なトレンド転換を見逃しません。ストップ
Presenting one-of-a-kind Gann Indicator for XAUUSD IQ Gold Gann Levels is a non-repainting, precision tool designed exclusively for XAUUSD/Gold intraday trading. It uses W.D. Gann’s square root method to plot real-time support and resistance levels, helping traders spot high-probability entries with confidence and clarity. William Delbert Gann (W.D. Gann) was an exceptional market analyst whose trading technique was based on a complex blend of mathematics, geometry, astrology, and ancient calcul
PRO Renko Systemは、特別にRENKOチャートを取引するために設計された高精度の取引システムです。 これは、様々な取引商品に適用することができる普遍的なシステムです。 システムは効果的に正確な逆転信号へのアクセスを与えるいわゆる市場の騒音を中和する。 表示器は非常に使いやすく、信号の生成に責任がある1つの変数だけがあります。 あなたは簡単にお好みの任意の取引ツールとレンコバーのサイズにツールを適応させることができます。 私はいつもあなたが私のソフトウェアで収益性の高い取引を支援するために余分なサポートを提供する準備ができています! 私はあなたに幸せで収益性の高い取引をしたいです! ご購入後にご連絡ください! 私はあなたに私のレンコチャートジェネレータを送信します。 私はまた、私の個人的な推奨事項やシステムの他のモジュールを無料で共有します!
まず第一に、この取引インジケーターは再描画されず、再描画されず、遅延しないことを強調する価値があります。これにより、手動取引とロボット取引の両方に理想的なものになります。 ユーザーマニュアル:設定、入力、戦略。 アトミックアナリストは、価格の強さとモメンタムを利用して市場でより良いエッジを見つけるためのPA価格アクションインジケーターです。ノイズや誤ったシグナルを除去し、取引ポテンシャルを高めるための高度なフィルターを備えています。複雑なインジケーターの複数のレイヤーを使用して、アトミックアナリストはチャートをスキャンし、複雑な数学的計算をシンプルなシグナルと色に変換します。これにより、どのような初心者トレーダーでも理解して使用し、一貫した取引の決定を行うことができます。 「アトミックアナリスト」は、新規および経験豊富なトレーダー向けにカスタマイズされた包括的な取引ソリューションです。プレミアムインジケーターとトップノッチの機能を1つの取引戦略に組み合わせ、すべてのタイプのトレーダーにとって汎用性のある選択肢にします。 デイリートレーディングとスキャルピング戦略:高速で正確な
El indicador "MR BEAST ALERTAS DE LIQUIDEZ" es una herramienta avanzada diseñada para proporcionar señales y alertas sobre la liquidez del mercado basándose en una serie de indicadores técnicos y análisis de tendencias. Ideal para traders que buscan oportunidades de trading en función de la dinámica de precios y los niveles de volatilidad, este indicador ofrece una visualización clara y detallada en la ventana del gráfico de MetaTrader. Características Principales: Canal ATR Adaptativo: Calcula
Pips Stalker
Abdulkarim Karazon
5 (2)
Pips Stalkerはロングショートアロータイプのインジケーターで、あらゆるレベルのトレーダーがより良い意思決定を行えるようにサポートします。インジケーターはリペイントされず、RSIを主なシグナルロジックとして用い、一度矢印が出されるとリペイントやバックペイントはなく、矢印の遅延もありません。 PIPS STALKER ARROWの特徴 : スタッツパネル は、全体の勝率%や連続の最大勝敗トレード数などの有用な統計、その他有用な情報を表示するユニークな情報ダッシュボードです。 TPとSL、組み込みのマネーマネジメント 指標は各矢印でTPとSLのオブジェクトを示し、トレーダーはマネーとリスク管理を組み込み、SLはATRに基づいて、TPは現在のATR SL価値に基づくリスク対リターン比率に基づいています。 再塗装不要、高い調整可能性 インジケーターはシグナル品質向上のオプションを豊富に提供しており、わずかな期間調整だけでどのペアでも機能します。パネルはトレーダーに現在の設定や期間が利益を上げているかどうかを示します。推奨期間枠:M1。 再調整開始資本金:100ドル。 推奨アカ
IQ FX Gann Levels a precision trading indicator based on W.D. Gann’s square root methods . It plots real-time, non-repainting support and resistance levels to help traders confidently spot intraday and scalping opportunities with high accuracy. William Delbert Gann (W.D. Gann) was an exceptional market analyst, whose trading technique was based on a complex blend of mathematics, geometry, astrology, and ancient mathematics which proved to be extremely accurate. Setup & Guide:  Download  MT5 Ver
FX Power: 通貨の強弱を分析して、より賢い取引を実現 概要 FX Power は主要通貨と金の実際の強弱をあらゆる市場状況で理解するための必須ツールです。強い通貨を買い、弱い通貨を売ることで、 FX Power は取引の意思決定を簡素化し、高い確率の取引機会を見出します。トレンドを追従する場合でも、極端なデルタ値を使用して反転を予測する場合でも、このツールはあなたの取引スタイルに完全に適応します。ただ取引するだけではなく、 FX Power で賢く取引をしましょう。 1. なぜ FX Power がトレーダーにとって非常に有益なのか 通貨と金のリアルタイム強弱分析 • FX Power は主要通貨と金の相対的な強弱を計算し、マーケットダイナミクスに関する明確な洞察を提供します。 • どの資産がリードしているか、または後れを取っているかを監視して、取引するペアを賢く選びましょう。 マルチタイムフレームの包括的なビュー • 短期、中期、長期のタイムフレームで通貨と金の強弱を追跡し、マーケットトレンドに基づいて取引戦略を調整できます。 • スキャルピングからスイングトレード
Step into the world of Forex trading with confidence, clarity, and precision using   Gold Indicator   a next-generation tool engineered to take your trading performance to the next level. Whether you’re a seasoned professional or just beginning your journey in the currency markets, Gold Indicator equips you with powerful insights and help you trade smarter, not harder. Built on the proven synergy of three advanced indicators, Gold Indicator focuses exclusively on medium and long-term trends eli
Advanced Supply Demand
Bernhard Schweigert
4.91 (299)
現在40%オフ 初心者にもエキスパートトレーダーにも最適なソリューション このインジケーターは独自の機能と新しい公式を多数内蔵しており、ユニークで高品質かつ手頃な取引ツールです。このアップデートでは、2つの時間枠ゾーンを表示できるようになります。より長いTFだけでなく、チャートTFとより長いTF(ネストゾーンを表示)の両方を表示できます。すべてのSupply Demandトレーダーの皆さんのお気に召すはずです。:) 重要情報の公開 Advanced Supply Demandの可能性を最大化するには、 https://www.mql5.com/ja/blogs/post/720245 にアクセスしてください。   エントリーまたはターゲットの正確なトリガーポイントを正確に特定できれば取引がどのように改善されるか想像してみてください。新しい基盤となるアルゴリズムに基づいて構築されているため、買い手と売り手の間の潜在的な不均衡をさらに簡単に特定できます。これは、最も強い需要と供給のゾーンと、過去のパフォーマンス(古いゾーンを表示)がグラフィカルに表現されるためです。これらの機能は、最適な
Introduction Harmonic Patterns are best used to predict potential turning point. Traditionally, Harmonic Pattern was identified manually connecting peaks and troughs points in the chart. Manual harmonic pattern detection is painfully tedious and not suitable for everyone. You are often exposed under subjective pattern identification with manual pattern detection. To avoid these limitations, Harmonic Pattern Plus was designed to automate your harmonic pattern detection process. The functionality
CRT Multi-Timeframe Market Structure & Liquidity Sweep Indicator Non-Repainting | Multi-Asset | MT5 Version Available MT5 Version:   https://www.mql5.com/en/market/product/162075 Full User Guide — explains what each feature does and why:   https://www.mql5.com/en/blogs/post/767525 Quick Start User Guide  — explains how to configure and in what order:  https://www.mql5.com/en/blogs/post/767540 Indicator Overview CRT Ghost Candle HTF Fractal is a complete institutional-grade market structure too
Trend indicator AI
Ramil Minniakhmetov
4.53 (83)
Trend Ai indicatorは、トレンドの識別と実用的なエントリポイントと反転アラートを組み合わせることで、トレーダーの市場分析を強化する優れたツールです。 この指標は、ユーザーが自信と正確さで外国為替市場の複雑さをナビゲートすることを可能にします トレンドAiインジケーターは、主要なシグナル以外にも、プルバックやリトレースメント中に発生するセカンダリエントリポイントを識別し、トレーダーが確立されたトレンド内の価格修正を活用できるようにします。 重要な利点: *MT4およびMT5の仕事 *明確な買いまたは売りシグナル *再描画しません ·すべての資産で動作します 私はeaやセットをtelegram it詐欺で販売しないように注意してください。 すべての設定はここでブログで無料です。  重要! 指示とボーナスを得るために購入後すぐに私に連絡してください! 私の他のプロダクトと同様、実質操作の監視はここに見つけることができます: https://www.mql5.com/en/users/mechanic/seller&nbsp ; 設定および入力: すべての
作者のその他のプロダクト
Иногда бывает, что наши построения на графике выходят за пределы последнего бара. После выходных, эти построения могут измениться в виду особенностей учета времени в мт5. Данный индикатор поможет решить эту проблему - он проходит по всем графикам и сдвигает дату объекта, которая дальше, чем нулевой бар.  После завершения работы индикатор удаляется. Параметры: Direction - направление сдвига; DaysShift - количество дней, на которые сдвигается дата объекта, правее нулевого бара.
FREE
Alternative Chart
Yevhenii Levchenko
3.5 (2)
The indicator builds alternative quotes based on the average price of a bar and shadows for a specified period of time or according to a fixed body size. Options: StartDrawing - the date from which the indicator will build quotes; PerCounting - period for calculating the average body size and shadows. If AverageBody = 0, then it builds at an average price; AverageBody - fixed candlestick body size. If greater than zero, builds on this parameter.
FREE
インディケータは現在のクオートを作成し、これを過去のものと比較して、これに基づいて価格変動予測を行います。インジケータには、目的の日付にすばやく移動するためのテキスト フィールドがあります。 オプション: シンボル - インジケーターが表示するシンボルの選択; SymbolPeriod - 指標がデータを取る期間の選択; IndicatorColor - インジケータの色; HorisontalShift - 指定されたバー数だけインディケータによって描画されたクオートのシフト; Inverse - true は引用符を逆にします。false - 元のビュー。 ChartVerticalShiftStep - チャートを垂直方向にシフトします (キーボードの上下矢印)。 次は日付を入力できるテキストフィールドの設定で、「Enter」を押すとすぐにジャンプできます。
This indicator will allow you to quickly go to the chart section that interests you, without unnecessary time costs. pt_shift - step of vertical scrolling; ButtonsHeight - button height; ButtonsWidth - button width; ButtonsColor - color of buttons; ButtonsBordersColor - button border color; Font - font; TextColor - button text color; TextSize - button text size; ButtonsBack - buttons in the background; ButtonsSelection - select buttons for movements; ButtonsHidden - hide buttons in
This indicator is looking for such market models as: head and shoulders, triangles, double tops and bottoms, flags, wedges and three touches. Options: barsToProcess - the initial number of bars to calculate; ArrowSize - arrow size; AllowablePatternLength - minimum length of the pattern (in bars); AllowablePatternPriceDiv - the minimum height of the pattern, applicable for all but the 'head and shoulders', 'double top' patterns (for the latter there is another parameter); AllowablePriceAberrat
Индикатор ищет подобную ценовую структуру, сравнивая с последней ценовой структурой. Размер паттерна (грубо говоря количество переломов зигзага) настраивается (всегда меньше на 1, чем введено - нулевой перелом не считается). Все найденные совпадения отмечаются прямоугольником. Так же к паттернам существует быстрая навигация с помощью кнопочек "Next patt" и "Prev patt". В индикатор вшиты два индикатора типа ЗигЗа г : стандартный зигзаг и пользовательский , моей разработки. Параметры настройки ста
インジケーターは、古典的なガンの角度と同様に、(特定のキャンドルをクリックした後)トレンドラインのファンを構築します。インジケーターの特徴は、固定スケールで角度を作成するだけでなく、特定の数のバーの平均価格を使用することです(オプション)。 インジケーターの角度の平均価格を計算する方法は2つあります(オプション)。 1)高値から安値への(特定の数のバーの)平均価格の動きの計算。 2)平均価格の計算はオープンからクローズに移動します。 オプション: 1.Method -コーナーを構築する方法。 2. FixedScale-固定スケール(メソッドでFixed_Scaleが選択されている場合)。 3.SecondaryAngles-二次角度を描画するための許可を制御します。 4.RayRight-トレンドラインの光線を設定します。 5.DrawBackground-背景として線を描画します。 6.AnglesQuantity-角度の数。 7. Bars_To_Process-期間、バーの数、これに基づいて平均価格が決定され、角度の「速度」。ゼロ以下の場合、すべての履歴
Индикатор ищет уровни поддержки и сопротивления, определяя важные ценовые уровни. Параметры индикатора: Mode - метод определения уровней: 1) High_Low - по теням, 2) Open_Close - по цене открытия и закрытия; Period_ - период индикатора, внутри которого ищется важный ценовой уровень (например, если стоит 12 - ищет уровень внутри 12 баров, сдвигаясь каждый раз на бар вперёд); Touches - количество касаний цены; BreakAlert - выдавать алерт при обнаружении уровня; NewLevelAlert - выдавать алерт при о
インディケータは現在のクオートを作成し、これを過去のものと比較して、これに基づいて価格変動予測を行います。インジケータには、目的の日付にすばやく移動するためのテキスト フィールドがあります。 オプション: シンボル - インジケーターが表示するシンボルの選択; SymbolPeriod - 指標がデータを取る期間の選択; IndicatorColor - インジケータの色; HorisontalShift - 指定されたバー数だけインディケータによって描画されたクオートのシフト; Inverse - true は引用符を逆にします。false - 元のビュー。 ChartVerticalShiftStep - チャートを垂直方向にシフトします (キーボードの上下矢印)。 次は日付を入力できるテキストフィールドの設定で、「Enter」を押すとすぐにジャンプできます。
Multi-Mode Gann Angles Indicator (MT5) Multi-Mode Gann Angles インジケーターは、チャート上で選択したローソク足をクリックすると、トレンドラインの扇形構造を描画します。視覚的な構造はクラシックなガンアングルに類似しており、市場構造の手動分析を目的としています。 角度のスケールは複数の方法で設定できます。固定値を使用することも、指定した本数の過去バーに基づいて算出される平均価格変動を使用することも可能です。これにより、分析対象の銘柄や時間足の特性に合わせて角度の構築を調整できます。 インジケーターは各時間足で独立して動作します。トレンドラインは作成された時間足でのみ表示されます。各インスタンスは、IndicatorId と現在の時間足を含む一意のオブジェクト接頭辞を使用します。削除操作は、現在のインスタンスによって作成されたラインのみに適用されます。 計算モード (MethodInput) fixedScaleMode — FixedScale パラメータで定義された固定値を使用します。 alternativeOpenClose
フィルタ:
レビューなし
レビューに返信