EZT Pinbar Alert

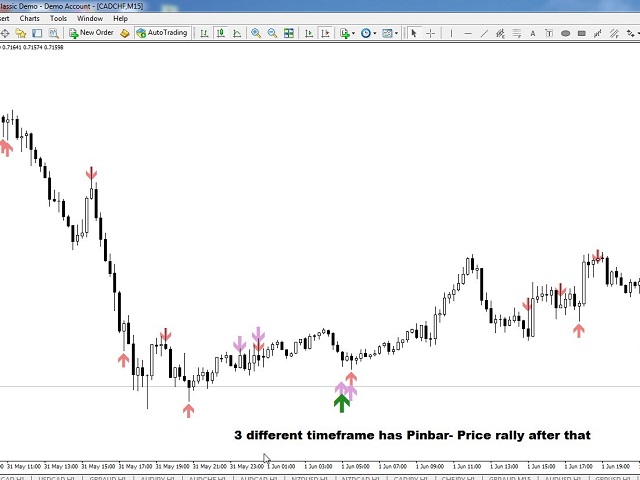
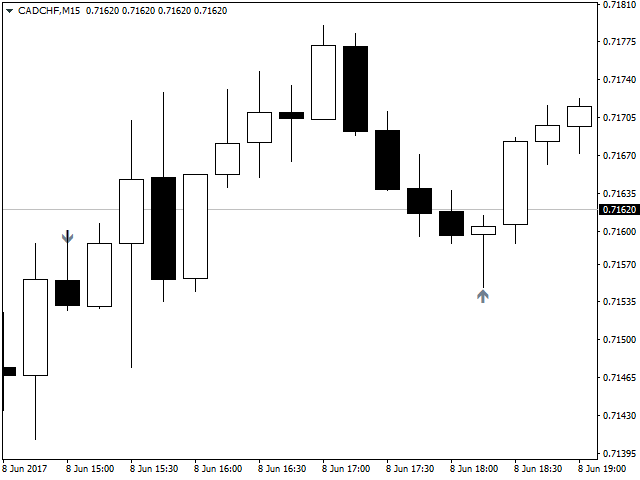
これはマルチタイムフレームのピンバーアラートインジケーターです。 現在の時間枠のみ、または 1 分足から月足までのすべての時間足で使用できます。

すべての時間枠を選択すると、チャートが開いている現在の時間枠とその上の時間枠に関するアラートが表示されます。

選択した時間枠ごとに、ポップアップ、電子メール、プッシュ通知アラートが個別に表示されます。

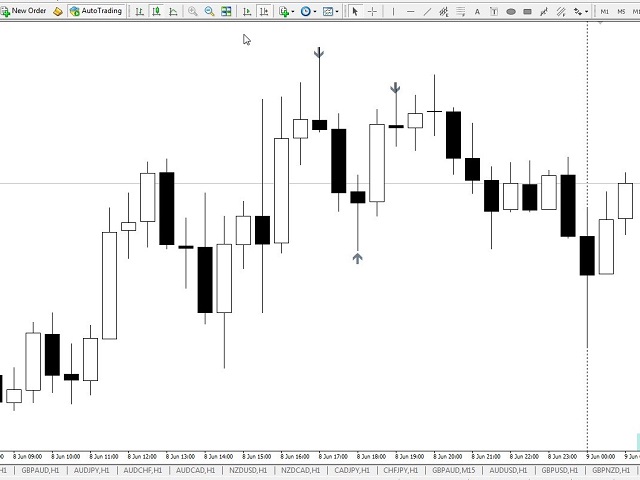
インディケータは価格チャート上に矢印を配置します。 強気/ロングピンバーの場合は価格ラインより下にあり、弱気/ショートピンバーの場合は価格ラインより上です。

アラートを取得するだけで、チャートを矢印で混雑させたくない場合は、単に矢印の色を選択します: なし
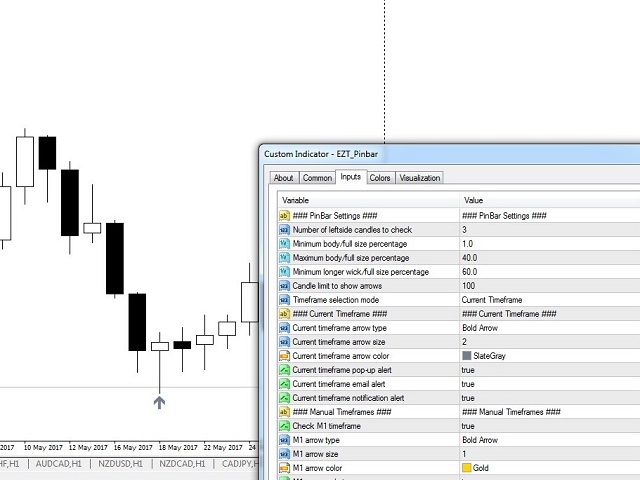


設定
チェックする左側のローソク足の数: 有効であるためには、弱気のピンバーが最も高く、強気のピンバーが最も低い必要があります。 左側のローソク足の数を選択します。弱気のピンバーを探す場合はローソク足の数が低くなり、強気のピンバーを探す場合はローソク足の数が高くなります。
最小ボディ/フル サイズの割合: ピン バーの最小ボディ サイズ。
最大ボディ/フル サイズの割合: ピン バーの最大ボディ サイズ。
最小の長い芯/フルサイズの割合: 弱気のピンバーは上部に長い芯があり、強気のピンバーは下部に長い芯があります。 長芯の割合をお選びいただけます。
矢印を表示するローソク足の制限: 矢印を表示するために戻るローソク足の数。
時間枠選択モード: 現在の時間枠、または選択したより大きな時間枠。
チェック …。 時間枠: 表示された時間枠についての True または False。
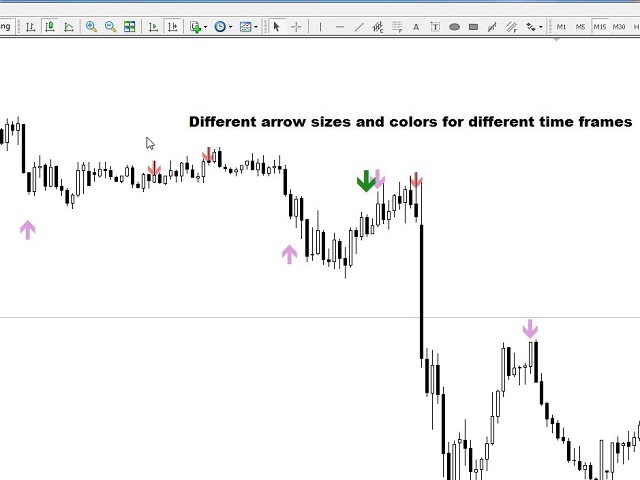
矢印の種類: 3 つの異なる矢印スタイルから選択できます。
矢の大きさ:ちょうどいい大きさです。
矢印の色: 単なる色です。
ポップアップアラート: true または false。
電子メール警告: true または false。
通知アラート: true または false。
レビューを書いたり製品を評価したりして、私の仕事を手伝ってください
おすすめのプロダクト
The LineMagnit Indicator for MT4 is a highly precise tool that builds support and resistance levels which magnetically attract prices. This feature allows traders to easily determine the most probable entry and exit points in the market, as well as identify the market's directional forces, as levels are based on capital inflows into the instrument. Equipped with an intuitively understandable graphical interface, the LineMagnit Indicator enables users to quickly locate and analyze support and res
Alpha Trend signは私たちの取引システムを検証し、取引信号を明確に提示し、信号がドリフトすることはありません。 主な機能: •市場が活況を示している地域に応じて、指標に基づいて現在の相場がトレンド相場に属しているか、それとも揺れ相場に属しているかを直感的に判断することができる。 そして、指標の指示矢印に基づいて市場に切り込み、緑の矢印は購入を提示し、赤の矢印は販売を提示する。 •小周期変動による頻繁な取引信号の発生を回避するために、5分以上の時間周期で取引を行うことを推奨します。 •最適な取引タイミングを逃さないために、シグナルプロンプトをオンにすることもできます。 •本指標はトレンド相場をよく予測するだけでなく、幅広振動相場でも利益を得ることができる。 •本指標は大道至簡の原則に基づいており、異なる段階のトレーダーが使用するのに適している。 注意事項: •Alpha Trend signには明確な入退場信号があり、損失を与えないように逆位相操作を提案しない。 •Alpha Trend signは特に成熟した指標であり、デルのチー
サポート線と抵抗線のプロットにうんざりしていませんか? サポートレジスタンス は、非常に興味深いひねりを加えてチャート内のサポートとレジスタンスラインを自動検出およびプロットするマルチタイムフレームインジケーターです。価格レベルは時間とともにテストされ、その重要性が高まるにつれて、ラインは太くなり、暗くなります。 [ インストールガイド | 更新ガイド | トラブルシューティング | よくある質問 | すべての製品 ] 一晩でテクニカル分析を強化 チャートを閲覧せずに重要な価格レベルを検出 一目ですべての価格レベルの相対的な強さを認識する すべての取引で最大30時間のプロットラインを節約 インジケーターは、すべての価格レベルの年齢を表示します インジケーターは再描画されていません 過去および現在の価格レベルは近接によって崩壊し、現在の市場行動に合わせて調整されます。動作は、必ずしもピークではない場所に線が引かれます。 価格レベルは、時間とともに拒否されるにつれて、より暗く、より広くなります ノイズを避けるために、重要でない価格レベルは定期的にクリアされます カスタマイズ可能な時間枠の
これは、キャンドルの終値を予測する指標です。 このインジケータは、主にD1チャートでの使用を目的としていますが. この指標は、従来の外国為替取引とバイナリオプション取引の両方に適しています。 インジケーターは、スタンドアロンのトレーディングシステムとして使用することも、既存のトレーディングシステムへの追加として機能させることもできます。 このインジケーターは、現在のキャンドルを分析し、キャンドル自体の内部の特定の強度係数と、前のキャンドルのパラメーターを計算します。 したがって、この指標は、市場の動きのさらなる方向性と現在のキャンドルの終値を予測します。 この方法のおかげで、この指標は、短期の日中取引だけでなく、中期および長期の取引にも適しています。 インジケーターを使用すると、市場の状況の分析中にインジケーターが生成する潜在的な信号の数を設定できます。 インジケーターの設定には、このための特別なパラメーターがあります。 また、インジケーターは、チャート上のメッセージの形式で、電子メールで、およびPUSH通知の形式で、新しい信号について通知することができます。 購入後は必ず私に書いて
The indicator detects and displays 3 Drives harmonic pattern (see the screenshot). The pattern is plotted by the extreme values of the ZigZag indicator (included in the resources, no need to install). After detecting the pattern, the indicator notifies of that by a pop-up window, a mobile notification and an email. The indicator highlights the process of the pattern formation and not just the complete pattern. In the former case, it is displayed in the contour triangles. After the pattern is com
This is a new strategy for SUPPLY DEMAND areas It is based on a calculation using the tick volume to detect the big price action in market for both bear /bull actions this smart volume action candles are used to determine the supply and demand areas prices in between main supply and demand lines indicate sideway market  up arrows will be shown when prices moves above the main supply and the secondary supply lines Down arrows will be shown when prices moves below the main demand and the secondary
このインジケーターは アグレッシブなスキャルピング と バイナリーオプションの速いエントリー のために設計されており、 毎バー でシグナルを生成し、常に何が起こっているかを正確に把握できます。 Happy Scalpingチャンネルに参加する: MQL5 再描画しません :現在のバーのシグナルは リアルタイム で生成されるため、まだバーが形成されている間に、前のバーの終値に対して価格が上がるか下がるかによってシグナルが変わる可能性があります。 しかし、バーが 閉じる と、シグナルの色は 完全に固定されます 。変更されず、消えず、動かず、 見るものがそのまま残ります。 なぜこのように設計されたのか? 多くのスキャルパーは、特に価格が ブレイクアウトや急激な動き をする際に、すぐにシグナルを受け取ることを重視しています。そのため、その瞬間に迅速に取引を行い、すぐにピップを獲得することができます。 一方で、バーが閉じた後の 確認を待つ ことを好むトレーダーもおり、その場合でもこのインジケーターを問題なく使用できます。 どちらのアプローチも有効です 。このシステムはどちらのスタイルにも
Добрый День уважаемые трейдеры!  Вашему вниманию индикатор созданный и работающий на базе трендовика ADX,  для торговли на смене направления движения который учитывает коррекцию и даёт возможность на ней заработать.  Применяю этот индикатор для скальпинга. Рекомендую таймфреймы от 15 ти минутного(М15) до часового (Н1) периодов.  Красный кружок сигнал на продажу- Sell) Зелёный кружок  сигнал на покупку Buy) Чем меньше ваш таймфрейм тем меньше пунктов вы зарабатываете.   Важно выставлять стопы! !В
「Auto FIBO Pro」Crypto_Forex インジケーターは、取引の補助ツールとして最適です。 - インジケーターは、フィボナッチ レベルとローカル トレンド ライン (赤色) を自動的に計算してチャート上に配置します。 - フィボナッチ レベルは、価格が反転する可能性のある重要な領域を示します。 - 最も重要なレベルは、23.6%、38.2%、50%、61.8% です。 - リバーサル スキャルピングやゾーン グリッド取引に使用できます。 - Auto FIBO Pro インジケーターを使用して、現在のシステムを改善する機会も多数あります。 - Info Spread Swap Display があり、接続されている外国為替ペアの現在のスプレッドとスワップを表示します。 - ディスプレイには、アカウントの残高、エクイティ、マージンも表示されます。 - Info Spread Swap Display は、チャートのどのコーナーにも配置できます。 0 - 左上コーナー、1 - 右上、2 - 左下、3 - 右下。 高品質のトレーディングロボットとインジケーターをご覧にな
Pivot Points Indicator Features: Send alerts when a pivot line is hit Displays Daily, Weekly, Monthly Indicators at the same time on the chart Restricting the time during the day when the alerts are sent Adjust the styling settings for the Pivot lines Settings: Show Daily Pivots Show Weekly Pivots Show Monthly Pivots Weekly Pivots Hit Notification Enabled Monthly Pivots Hit Notification Enabled Hit Check Frequency Time Restriction Enabled From Hour To Hour PP Color R1 Color R2 Color R3 Color S1
Super Reversal Pattern Indicator Unlock the power of advanced pattern recognition with our Super Reversal Pattern Indicator. Designed for traders seeking precision and reliability, this indicator identifies one of the most effective reversal patterns in technical analysis, offering a significant edge in your trading strategy. Key Features: Non-Repainting Accuracy: Enjoy the confidence of non-repainting technology. Once a Super Reversal Pattern is detected, it remains static, providing consiste
Rainbow Price Visualizer v1.21 See where the market really breathes. Turns your MT4 chart into an ultra-precise heatmap that highlights price zones favored by big players. Why it matters 300 price levels at 0.2‑pip resolution — microscopic detail. 8 visual themes (Rainbow, Fire, Ocean…) for instant readibility. Smart opacity: low noise fades, real zones pop. Lightweight rendering with automatic cleanup. Fully customizable: saturation, opacity, resolution, history depth. Bands project into the f
Insider Scalper Binary This tool is designed to trade binary options. for short temporary spends. to make a deal is worth the moment of receiving the signal and only 1 candle if it is m1 then only for a minute and so in accordance with the timeframe. for better results, you need to select well-volatile charts.... recommended currency pairs eur | usd, usd | jpy .... the indicator is already configured, you just have to add it to the chart and trade .... The indicator signals the next candle.
The   True Magic Oscillator   indicator is designed for signal trading. This indicator generates trend signals. It uses many algorithms and indicators to generate this signal. It tries to generate signals from the points with the highest trend potential. This indicator is a complete trading product. This indicator does not need any additional indicators. The indicator is never repainted. The point at which the signal is given does not change.         Features and Recommendations Works wit
Trend Scanner
Vladimir Kalendzhyan
4.33 (6)
By purchasing this indicator, you have the right to receive a free copy of one of   my other indicator's or advisor’s!  (All future updates are included. No limits) . To get it , please contact me by  mql5 message ! The Trend Scanner trend line indicator displays the trend direction and its changes. The indicator works on all currency pairs and  timeframes. The indicator simultaneously displays multiple readings on the price chart: the support and resistance lines of the currency pair, the exist
Price Magnet — Price Density and Attraction Levels Indicator Price Magnet is a professional analytical tool designed to identify key support and resistance levels based on statistical Price Density. The indicator analyzes a specified historical period and detects price levels where the market spent the most time. These zones act as “magnets,” attracting price action or forming a structural base for potential reversals. Unlike traditional Volume Profile tools, Price Magnet focuses on price-time d
Owl smart levels
Sergey Ermolov
4.26 (38)
MT5版  |   FAQ Owl Smart Levels Indicator   は、 Bill Williams   の高度なフラクタル、市場の正しい波構造を構築する Valable ZigZag、エントリの正確なレベルをマークする Fibonacci レベルなどの一般的な市場分析ツールを含む 1 つのインジケーター内の完全な取引システムです。 利益を得るために市場と場所に。 戦略の詳細な説明 インジケータを操作するための指示 顧問-取引助手 プライベートユーザーチャット ->購入後に私に書いて、私はプライベートチャットにあなたを追加し、あなたはそこにすべてのボーナスをダウンロードすることができます 力はシンプルさにあります! Owl Smart Levels   取引システムは非常に使いやすいので、専門家にも、市場を勉強し始めて自分で取引戦略を選択し始めたばかりの人にも適しています。 戦略と指標に秘密の数式や計算方法が隠されているわけではなく、すべての戦略指標は公開されています。 Owl Smart Levels を使用すると、取引を開始するためのシグナルをすばやく確認し、注
This is a trend indicator without redrawing Developed instead of the binary options strategy (by the color of the Martingale candlestick) Also works well in forex trading When to open trades (binary options) A signal will appear in the place with a candle signaling the current candle It is recommended to open a deal for one candle of the current timeframe M1 and M5 When a blue dot appears, open a deal up When a red dot appears, open a trade down. How to open trades on Forex. When a signal is rec
「Adjustable Fractals Pro」はフラクタルインジケーターの高度なバージョンで、非常に便利なトレーディングツールです。 - ご存知のとおり、標準フラクタル MT4 インジケーターには設定がまったくありません。これはトレーダーにとって非常に不便です。 - Adjustable Fractals Pro はその問題を解決しました。必要な設定がすべて揃っています: - インジケーターの調整可能な期間 (推奨値 - 7 以上)。 - 価格の高値/安値からの距離を調整可能。 - フラクタル矢印のデザインを調整可能。 - Info Spread Swap Display があり、接続された外国為替ペアの現在のスプレッドとスワップを表示します。 - ディスプレイには、口座残高、エクイティ、マージンも表示されます。 - Info Spread Swap Display はチャートのどのコーナーにも配置できます: 0 - 左上コーナー、1 - 右上、2 - 左下、3 - 右下。 - インジケーターにはモバイルおよび PC アラートが組み込まれています。 高品質のトレーディングロボッ
VR Cub
Vladimir Pastushak
VR Cub は、質の高いエントリーポイントを獲得するためのインジケーターです。このインジケーターは、数学的計算を容易にし、ポジションへのエントリーポイントの検索を簡素化するために開発されました。このインジケーターが作成されたトレーディング戦略は、長年にわたってその有効性が証明されてきました。取引戦略のシンプルさはその大きな利点であり、初心者のトレーダーでもうまく取引することができます。 VR Cub はポジション開始ポイントとテイクプロフィットとストップロスのターゲットレベルを計算し、効率と使いやすさを大幅に向上させます。取引の簡単なルールを理解するには、以下の戦略を使用した取引のスクリーンショットを見てください。 設定、設定ファイル、デモ版、説明書、問題解決方法は、以下から入手できます。 [ブログ] レビューを読んだり書いたりすることができます。 [リンク] のバージョン [MetaTrader 5] エントリーポイントの計算ルール ポジションをオープンする エントリーポイントを計算するには、VR Cub ツールを最後の高値から最後の安値までストレッチする必要があります。 最初
The perfect tool for Scalng in the Forex markets You can trade both from signal to signal and using take profit  The algorithm does not use Zigzag!  No redrawing!  This is a channel instrument that uses a moving average as a filter. Moving Average  There are 2 parameters for the settings Ma Period = 5 period Moving Average  Channel 1.0 distance of channel lines from the chart Price Signal Filter - calculation of signal opening and filter There is a complete set of Alert There is a multi-timefram
Your Good Friends — this is not just an indicator, but your reliable trading assistant, designed for traders who value simplicity, clarity, and stability. It combines the best classic methods of technical analysis — support and resistance levels, reversal signals, visual cues — and presents them in the clearest, most user-friendly format possible. Suitable for both beginners and experienced traders — especially those who want to eliminate chaos, reduce stress, and trade based on clear signals.
The Before indicator predicts the most likely short-term price movement based on complex mathematical calculations. Most of the standard indicators commonly used in trading strategies are based on fairly simple calculations. This does not mean that there were no outstanding mathematicians in the world at the time of their creation. It is just that computers did not yet exist in those days, or their power was not enough for the sequential implementation of complex mathematical operations. Nowad
Minotaur Waves は、市場の転換点を検出し、方向性の変化を高精度で確認するために設計された高度な分析インジケーターです。 Minotaur Oscillator と動的なアダプティブバンド構造を組み合わせ、信頼性の高い視覚的シグナルを提供し、的確なエントリー判断を支援します。すべての通貨ペアに対応しており、特に EURUSD、GBPUSD、USDJPY の M1、M5、M15、M30 タイムフレームで最適なパフォーマンスを発揮します。 アップデートとガイドはこちらからご覧ください: https://www.mql5.com/en/channels/forexnewadvisor システムの主な構成: 動的バンド: モメンタムの変化をリアルタイムで検出し、重要なブレイクアウトゾーンを可視化 Minotaur Oscillator: モメンタムのヒストグラム表示により、反転ゾーンを視覚的に示す 極値の検出: +33(高値ピーク)または -33(安値ピーク)の確定値が検出されたときのみアラートを発動 ノイズ制御: トレンド中の過剰なシグナル発生を防ぐ内部フィルターロジックを搭
Indicator. "Indicator wave or Indicator Ma". Using 23 standard indicators and the author's algorithm, the levels of purchases (from 0 to +100) and sales (from 0 to -100) are calculated. Then, using the calculated levels, the "Wave Indicator" draws a wave with 21 moving averages. The wave number is equal to the averaging period of the calculated levels. Waves # 1 - 7 Fast Moving Averages Waves from No. 8 -14 moving averages Waves from No. 15-21 slow moving averages Looking at the figures drawn
Crypto_Forex MT4 用インジケーター「モーニング スター パターン」 - インジケーター「モーニング スター パターン」は、プライス アクション トレーディングに非常に強力なインジケーターです。再描画なし、遅延なし。 - インジケーターは、チャート上で強気のモーニング スター パターンを検出します。チャート上の青い矢印信号 (画像を参照)。 - PC、モバイル、および電子メール アラート付き。 - また、その兄弟である弱気の「イブニング スター パターン」インジケーターも利用できます (以下のリンクに従ってください)。 - インジケーター「モーニング スター パターン」は、サポート/レジスタンス レベルと組み合わせるのに最適です。 高品質のトレーディングロボットとインジケーターをご覧になるにはここをクリックしてください! これは、この MQL5 Web サイトでのみ提供されるオリジナル製品です。
発見が困難で頻度が少ないため、分岐は最も信頼できる取引シナリオの1つです。このインジケーターは、お気に入りのオシレーターを使用して、通常の隠れた分岐点を自動的に見つけてスキャンします。 [ インストールガイド | 更新ガイド | トラブルシューティング | よくある質問 | すべての製品 ] 取引が簡単 通常の隠れた発散を見つけます 多くのよく知られている発振器をサポート ブレイクアウトに基づいて取引シグナルを実装します 適切なストップロスおよび利益レベルを表示します 設定可能なオシレーターパラメーター カスタマイズ可能な色とサイズ バー単位でサイズ別に分岐をフィルタリング パフォーマンス統計を実装します 電子メール/音声/視覚アラートを実装します 幅広い市場の見通しを提供するために、異なるオシレーターを使用して、干渉なしで同じチャートにインジケーターを何度もロードできます。このインジケーターは、次のオシレーターをサポートしています。 RSI CCI MACD オスマ 確率的 勢い 素晴らしい発振器 加速器発振器 ウィリアムズパーセントレンジ 相対活力指数 特に外国為替市場では、
The indicator shows you buy/sell signals and does not repaint. It works well with almost all pairs, while the best ones are GBPUSD, XAUUSD and EURUSD. The product works better on H1 and H4. You can change the parameters in the inputs tab to get the best signals and the best trade results on each pair. You can enable/disable alerts when signal appears. The indicator is easy to use. Parameters barstrip & Sensitive: amount of bars to process the highest and lowest prices (relates to the internal l
Trend Basement indicator showing buy and sell areas. The indicator follows price movement around the opening price. It also displays information about the trend following the breakout of the low and high. The indicator has a very simple but effective chart: an orange dot is displayed above the open price, and a blue one below the open price. The indicator also includes a sound alert and a pop-up window that notifies you when the candle closes at these important levels. The indicator will allow y
Binary Options Support Resistance Indicator This indicator is designed for binary options trading and effectively shows retracements from support and resistance levels. Signals appear on the current candle. A red arrow pointing downwards indicates a potential selling opportunity, while a blue arrow pointing upwards suggests buying opportunities. All that needs adjustment is the color of the signal arrows. It is recommended to use it on the M1-M5 timeframes as signals are frequent on these timef
このプロダクトを購入した人は以下も購入しています
Gann Made Easy は、ミスター・ギャンの理論を使用した取引の最良の原則に基づいた、プロフェッショナルで使いやすい外国為替取引システムです。 W・D・ガン。このインジケーターは、ストップロスとテイクプロフィットレベルを含む正確な買いと売りのシグナルを提供します。 PUSH通知を利用して外出先でも取引可能です。 購入後に私に連絡して、取引のヒント、ボーナス、および「GANN MADE EASY」EA アシスタントを無料で入手してください。 おそらく、ギャンの取引手法についてはすでに何度も聞いたことがあるでしょう。通常、ギャンの理論は初心者のトレーダーだけでなく、すでにある程度の取引経験がある人にとっても非常に複雑なものです。なぜなら、ギャンの取引手法は理論的にはそれほど簡単に適用できるものではないからです。私はその知識を磨き、最良の原則を私の外国為替インジケーターに組み込むために数年を費やしました。 このインジケーターは非常に簡単に適用できます。必要なのは、それをチャートに添付し、簡単な取引推奨事項に従うだけです。このインジケーターは常に市場分析の仕事を行い、取引の機会を探しま
An exclusive indicator that utilizes an innovative algorithm to swiftly and accurately determine the market trend. The indicator automatically calculates opening, closing, and profit levels, providing detailed trading statistics. With these features, you can choose the most appropriate trading instrument for the current market conditions. Additionally, you can easily integrate your own arrow indicators into Scalper Inside Pro to quickly evaluate their statistics and profitability. Scalper Inside
Game Changerは、あらゆる金融商品で使用できる革新的なトレンドインジケーターです。MetaTraderを強力なトレンドアナライザーへと変貌させます。あらゆる時間枠で動作し、トレンドの特定、反転の可能性のシグナル、トレーリングストップ機能、そして迅速な市場反応のためのリアルタイムアラートを提供します。経験豊富なプロでも、優位性を求める初心者でも、このツールは自信と規律、そして根本的なトレンドダイナミクスを明確に理解した上で取引を行うための力となります。このインジケーターはリドロー機能も備えています。 購入後すぐにご連絡いただければ、個人ボーナスを進呈いたします。Strong SupportとTrend Scannerインジケーターの無料コピーを入手できます。[email protected]までプライベートメッセージを送ってください。 私のEAや特別なセットはTelegramでは販売しておりません。MQL5でのみ販売しており、セットファイルは私のブログでのみ公開しています。詐欺師にはご注意ください。他の方からセットを購入しないでください。 設定 トレンド変化時のアラート
Miraculous Indicator – ガン・スクエア・オブ・ナインに基づく100%非リペイントのFXおよびバイナリーツール この動画では、FXおよびバイナリーオプションのトレーダー向けに特別に開発された、非常に正確で強力な取引ツールである Miraculous Indicator を紹介しています。このインジケーターがユニークなのは、伝説的な ガン・スクエア・オブ・ナイン と ガンの振動の法則 に基づいている点で、現代の取引で利用できる最も正確な予測ツールの一つとなっています。 Miraculous Indicatorは 完全に非リペイント であり、ローソク足が確定した後にシグナルが変化したり消えたりすることはありません。つまり、見たものがそのまま利用できます。これにより、トレーダーは自信を持ってエントリーおよびエグジットを行うための信頼性と一貫性のある根拠を得ることができます。 主な特徴: ガン・スクエア・オブ・ナインとガン理論に基づいて構築 100%非リペイントのシグナルシステム すべての時間枠(M1、M5、H1、H4、日足、週足)で機能 FXおよびバイナリーオプション取引
このインジケーターは、反転ポイントと価格戻りゾーンを正確に表示します。     主要プレーヤー 。新たなトレンドが形成される場所を把握し、最大限の精度で意思決定を行い、すべての取引をコントロールします。 TREND LINES PRO インジケーターと組み合わせることで、その潜在能力を最大限に発揮します。 VERSION MT5 インジケーターが示す内容: 新しいトレンドの始まりに活性化する反転構造と反転レベル。 リスクと報酬の比率を最小限に抑えた利益 確定 と 損失停止の レベルの表示     RR 1:2   。 インテリジェントな削減ロジックによるストップロス。 指定されたインジケーターから 2 つのトレンド タイプの反転パターンを表示します。 指標: トレンドを追う   TREND LINES PRO   (世界的なトレンドの変化) TREND PRO   (クイックトレンド変更) シンプルで効果的   スキャナー   リアルタイムトレンド(新機能)。 マルチタイムフレームのインストゥルメント フィルタリング。 画面   利益     LOGIC AI信号の後。 当日プラス方
M1 SNIPER は使いやすいトレーディングインジケーターシステムです。M1時間足向けに設計された矢印インジケーターです。M1時間足でのスキャルピングのためのスタンドアロンシステムとして、また既存のトレーディングシステムの一部としても使用できます。このトレーディングシステムはM1時間足での取引に特化して設計されていますが、他の時間足でも使用できます。元々、この手法はXAUUSDとBTCUSDの取引用に設計しましたが、他の市場においても役立つと考えています。 インジケーターのシグナルは、トレンドの方向と逆方向に取引できます。インジケーターのシグナルを利用して両方向に取引するのに役立つ特別な取引テクニックをご紹介します。この手法は、特別な動的なサポートとレジスタンスの価格帯を利用することに基づいています。 ご購入後、M1 SNIPER矢印インジケーターをすぐにダウンロードできます。さらに、M1 SNIPERツールのすべてのユーザーに、以下のスクリーンショットに表示されているApollo Dynamic SRインジケーターを無料で提供しています。この2つのインジケーターを組み合わせることで
Dynamic Forex28 Navigator - 次世代の Forex 取引ツール。 現在 49% オフ。 Dynamic Forex28 Navigator は、長年人気のインジケーターを進化させたもので、3 つの機能を 1 つにまとめています。 Advanced Currency Strength28 インジケーター (レビュー 695 件)  + Advanced Currency IMPULSE with ALERT (レビュー 520 件) + CS28 コンボ シグナル (ボーナス)。 インジケーターの詳細 https://www.mql5.com/en/blogs/post/758844 次世代の Strength インジケーターが提供するもの  オリジナルで気に入っていたすべての機能が、新機能と精度の向上によって強化されました。 主な機能: 独自の通貨強度計算式。 すべての時間枠でスムーズかつ正確な強度ライン。 トレンドの特定と正確なエントリーに最適です。 ダイナミックマーケットフィボナッチレベル (マーケットフィボナッチ)。 このインジケーターに固有
Precautions for subscribing to indicator This indicator only supports the computer version of MT4 Does not support MT5, mobile phones, tablets The indicator only shows the day's entry arrow The previous history arrow will not be displayed (Live broadcast is for demonstration) The indicator is a trading aid Is not a EA automatic trading No copy trading function The indicator only indicates the entry position No exit (target profit)  The entry stop loss point is set at 30-50 PIPS Or the front hi
通貨強さウィザードは、取引を成功させるためのオールインワン ソリューションを提供する非常に強力な指標です。このインジケーターは、複数の時間枠のすべての通貨のデータを使用して、このまたはその外国為替ペアのパワーを計算します。このデータは、使いやすい通貨インデックスと通貨パワーラインの形式で表され、特定の通貨のパワーを確認するために使用できます。 必要なのは、取引したいチャートにインジケーターを接続することだけです。インジケーターは、取引する通貨の実際の強さを示します。このインジケーターは、トレンドに合わせて取引するときに有利に利用できる売買高の圧力の極値も示します。このインジケーターには、フィボナッチに基づく可能なターゲットも表示されます。 このインジケーターは、PUSH 通知を含むあらゆるタイプのアラートを提供します。 購入後ご連絡下さい。私の取引のヒントをあなたと共有し、素晴らしいボーナスインジケーターを無料で提供します! 幸せで有益な取引をお祈りします。
GOLD Impulse with Alert
Bernhard Schweigert
4.64 (11)
このインディケータは、当社の2つの製品 Advanced Currency IMPULSE with ALERT  +   Currency Strength Exotics . のスーパーコンビネーションです。 このインジケーターは全ての時間枠で作動し、8つの主要通貨と1つのシンボルの強弱のインパルスをグラフで表示します。 このインジケータは、金、エキゾチックペア、商品、インデックス、先物など、あらゆるシンボルの通貨強度の加速度を表示することに特化されています。金、銀、原油、DAX、US30、MXN、TRY、CNHなどの通貨強度の加速度(インパルスまたは速度)を表示するために、任意のシンボルを9行目に追加できる、この種の最初のものです。 新しいアルゴリズムに基づいて構築され、潜在的な取引の特定と確認がさらに容易になりました。これは、通貨の強さや弱さが加速しているかどうかをグラフィカルに表示し、その加速の速度を測定するためです。加速すると物事は明らかに速く進みますが、これはFX市場でも同じです。つまり、反対方向に加速している通貨をペアリングすれば、潜在的に利益を生む取引を特定
トレンドラインプロ   市場の真の方向転換点を理解するのに役立ちます。この指標は、真のトレンド反転と主要プレーヤーが再び参入するポイントを示します。 分かりますか     BOSライン   複雑な設定や不要なノイズなしに、より長い時間足でのトレンドの変化と重要なレベルを把握できます。シグナルは再描画されず、バーが閉じた後もチャート上に残ります。 VERSION MT 5     -     RFI LEVELS PRO インジケーター と組み合わせることで、その潜在能力を最大限に発揮します。 インジケーターが示す内容: 本当の変化   トレンド(BOSライン) 一度シグナルが現れたら、それは有効です!これは、リペイント機能を持つインジケーターとの重要な違いです。リペイント機能を持つインジケーターは、シグナルを発した後、それを変更し、資金の損失につながる可能性があります。これにより、より高い確率と精度で市場に参入できます。また、矢印が現れた後、目標値(利益確定)に達するか、反転シグナルが現れるまで、ローソク足の色を変更する機能もあります。 繰り返しエントリ       主要プレーヤーの
Volatility Trend System - a trading system that gives signals for entries. The volatility system gives linear and point signals in the direction of the trend, as well as signals to exit it, without redrawing and delays. The trend indicator monitors the direction of the medium-term trend, shows the direction and its change. The signal indicator is based on changes in volatility and shows market entries. The indicator is equipped with several types of alerts. Can be applied to various trading ins
Advanced Supply Demand
Bernhard Schweigert
4.91 (299)
現在40%オフ 初心者にもエキスパートトレーダーにも最適なソリューション このインジケーターは独自の機能と新しい公式を多数内蔵しており、ユニークで高品質かつ手頃な取引ツールです。このアップデートでは、2つの時間枠ゾーンを表示できるようになります。より長いTFだけでなく、チャートTFとより長いTF(ネストゾーンを表示)の両方を表示できます。すべてのSupply Demandトレーダーの皆さんのお気に召すはずです。:) 重要情報の公開 Advanced Supply Demandの可能性を最大化するには、 https://www.mql5.com/ja/blogs/post/720245 にアクセスしてください。   エントリーまたはターゲットの正確なトリガーポイントを正確に特定できれば取引がどのように改善されるか想像してみてください。新しい基盤となるアルゴリズムに基づいて構築されているため、買い手と売り手の間の潜在的な不均衡をさらに簡単に特定できます。これは、最も強い需要と供給のゾーンと、過去のパフォーマンス(古いゾーンを表示)がグラフィカルに表現されるためです。これらの機能は、最適な
現在20%OFF! 初心者やエキスパートトレーダーに最適なソリューションです。 このインディケータは、エキゾチックペア・コモディティ・インデックス・先物など、あらゆるシンボルの通貨の強さを表示することに特化したインディケータです。金、銀、原油、DAX、US30、MXN、TRY、CNHなどの通貨の強さを表示するために、9行目にどのシンボルでも追加することができます。独自の機能を多数搭載し、新しい計算式を採用したため、ユニークで高品質、かつ手頃な価格のトレーディングツールとなっています。新しいトレンドやスキャルピングチャンスのトリガーポイントを正確に把握することができるため、あなたのトレードがどのように改善されるか想像してみてください。 ユーザーマニュアル:ここをクリック   https://www.mql5.com/en/blogs/post/708876 すべての時間枠に対応します。あなたはすぐにトレンドを見ることができるようになります! 新しいアルゴリズムに基づいて設計されているため、潜在的な取引の特定と確認がより簡単になります。これは、8つの主要通貨と1つのシンボルの強弱
Looking for a powerful yet lightweight swing detector that accurately identifies market structure turning points? Want clear, reliable buy and sell signals that work across any timeframe and any instrument? Buy Sell Arrow MT Swing is built exactly for that — precision swing detection made simple and effective. This indicator identifies Higher Highs (HH) , Higher Lows (HL) , Lower Highs (LH) , and Lower Lows (LL) with remarkable clarity. It is designed to help traders easily visualize market stru
現在40%OFF! 初心者やエキスパートトレーダーのためのベストソリューション! このダッシュボードソフトウェアは、28の通貨ペアで動作しています。それは私達の主要な指標(高度な通貨の強さ28と高度な通貨インパルス)の2に基づいています。それは全体の外国為替市場の大きい概観を与えます。それは、すべての(9)時間枠で28の外国為替ペアのための高度な通貨の強さの値、通貨の動きの速度と信号を示しています。チャート上で1つのインディケータを使用して市場全体を観察し、トレンドやスキャルピングの機会をピンポイントで見つけることができたら、あなたのトレードがどのように改善されるか想像してみてください。 このインディケータには、強い通貨と弱い通貨の識別、潜在的な取引の識別と確認がより簡単になるような機能が搭載されています。このインディケータは、通貨の強さや弱さが増加しているか減少しているか、また、すべての時間枠でどのように機能しているかをグラフィカルに表示します。 新機能として、現在の市場環境の変化に適応するダイナミックなマーケットフィボナッチレベルが追加され、すでに当社のAdvanced
FX Volume
Daniel Stein
4.63 (38)
FX Volume:ブローカー視点で捉える本物の市場センチメント クイック概要 トレード手法をさらに高めたいとお考えですか? FX Volume は、リテールトレーダーやブローカーのポジション状況をリアルタイムで提供します。これは、COTのような遅延レポートよりもはるかに早く知ることができます。安定した利益を目指す方も、さらなる優位性を求める方も、 FX Volume は大きな不均衡を見極め、ブレイクアウトを確認し、リスク管理を洗練させるのに役立ちます。今すぐ始めて、実際の出来高データがどのように意思決定を変革するかを体感してください! 1. FX Volume がトレーダーにとって非常に有益な理由 高精度の早期警戒シグナル • 各通貨ペアを売買しているトレーダー数を、他者よりも早く、ほぼリアルタイムで把握できます。 • FX Volume は、複数のリテールブローカーから得られる本物の出来高データを収集し、分かりやすい形式で提供する 唯一 のツールです。 強力なリスク管理 • ロングやショートの大きな偏り(インバランス)を特定し、潜在的なトレンド転換を見逃しません。ストップ
Presenting one-of-a-kind Gann Indicator for XAUUSD IQ Gold Gann Levels is a non-repainting, precision tool designed exclusively for XAUUSD/Gold intraday trading. It uses W.D. Gann’s square root method to plot real-time support and resistance levels, helping traders spot high-probability entries with confidence and clarity. William Delbert Gann (W.D. Gann) was an exceptional market analyst whose trading technique was based on a complex blend of mathematics, geometry, astrology, and ancient calcul
Smart Sweep Sniper MT4
Vincent Georges David Ferrier
# Smart Sweep Sniper MT4 Version MT4 Midnight Pro Edition , specialized for scalping and day trading in Prop Firm, Available here PROTOCOL - Institutional Liquidity Grab & SMC available here ## The Institutional Edge — Detect Where Smart Money Acts, Enter When It Matters If you like it, leave a positive review to support its development. If you encounter a bug, let us know before posting a review. When you complete your challenge, share your certificate in the comments. Happy trading! Smart Sw
PRO Renko Systemは、特別にRENKOチャートを取引するために設計された高精度の取引システムです。 これは、様々な取引商品に適用することができる普遍的なシステムです。 システムは効果的に正確な逆転信号へのアクセスを与えるいわゆる市場の騒音を中和する。 表示器は非常に使いやすく、信号の生成に責任がある1つの変数だけがあります。 あなたは簡単にお好みの任意の取引ツールとレンコバーのサイズにツールを適応させることができます。 私はいつもあなたが私のソフトウェアで収益性の高い取引を支援するために余分なサポートを提供する準備ができています! 私はあなたに幸せで収益性の高い取引をしたいです! ご購入後にご連絡ください! 私はあなたに私のレンコチャートジェネレータを送信します。 私はまた、私の個人的な推奨事項やシステムの他のモジュールを無料で共有します!
まず第一に、この取引インジケーターは再描画されず、再描画されず、遅延しないことを強調する価値があります。これにより、手動取引とロボット取引の両方に理想的なものになります。 ユーザーマニュアル:設定、入力、戦略。 アトミックアナリストは、価格の強さとモメンタムを利用して市場でより良いエッジを見つけるためのPA価格アクションインジケーターです。ノイズや誤ったシグナルを除去し、取引ポテンシャルを高めるための高度なフィルターを備えています。複雑なインジケーターの複数のレイヤーを使用して、アトミックアナリストはチャートをスキャンし、複雑な数学的計算をシンプルなシグナルと色に変換します。これにより、どのような初心者トレーダーでも理解して使用し、一貫した取引の決定を行うことができます。 「アトミックアナリスト」は、新規および経験豊富なトレーダー向けにカスタマイズされた包括的な取引ソリューションです。プレミアムインジケーターとトップノッチの機能を1つの取引戦略に組み合わせ、すべてのタイプのトレーダーにとって汎用性のある選択肢にします。 デイリートレーディングとスキャルピング戦略:高速で正確な
El indicador "MR BEAST ALERTAS DE LIQUIDEZ" es una herramienta avanzada diseñada para proporcionar señales y alertas sobre la liquidez del mercado basándose en una serie de indicadores técnicos y análisis de tendencias. Ideal para traders que buscan oportunidades de trading en función de la dinámica de precios y los niveles de volatilidad, este indicador ofrece una visualización clara y detallada en la ventana del gráfico de MetaTrader. Características Principales: Canal ATR Adaptativo: Calcula
Gold Scalper Super is an easy-to-use trading system. The indicator can be used as a standalone scalping system on the M1 time frame, as well as part of your existing trading system. Bonus: when purchasing an indicator, Trend Arrow Super is provided free of charge, write to us after purchase. The indicator 100% does not repaint!!! If a signal appears, it does not disappear! Unlike indicators with redrawing, which lead to the loss of a deposit, because they can show a signal and then remove it.
IQ FX Gann Levels a precision trading indicator based on W.D. Gann’s square root methods . It plots real-time, non-repainting support and resistance levels to help traders confidently spot intraday and scalping opportunities with high accuracy. William Delbert Gann (W.D. Gann) was an exceptional market analyst, whose trading technique was based on a complex blend of mathematics, geometry, astrology, and ancient mathematics which proved to be extremely accurate. Setup & Guide:  Download  MT5 Ver
FX Power: 通貨の強弱を分析して、より賢い取引を実現 概要 FX Power は主要通貨と金の実際の強弱をあらゆる市場状況で理解するための必須ツールです。強い通貨を買い、弱い通貨を売ることで、 FX Power は取引の意思決定を簡素化し、高い確率の取引機会を見出します。トレンドを追従する場合でも、極端なデルタ値を使用して反転を予測する場合でも、このツールはあなたの取引スタイルに完全に適応します。ただ取引するだけではなく、 FX Power で賢く取引をしましょう。 1. なぜ FX Power がトレーダーにとって非常に有益なのか 通貨と金のリアルタイム強弱分析 • FX Power は主要通貨と金の相対的な強弱を計算し、マーケットダイナミクスに関する明確な洞察を提供します。 • どの資産がリードしているか、または後れを取っているかを監視して、取引するペアを賢く選びましょう。 マルチタイムフレームの包括的なビュー • 短期、中期、長期のタイムフレームで通貨と金の強弱を追跡し、マーケットトレンドに基づいて取引戦略を調整できます。 • スキャルピングからスイングトレード
Step into the world of Forex trading with confidence, clarity, and precision using   Gold Indicator   a next-generation tool engineered to take your trading performance to the next level. Whether you’re a seasoned professional or just beginning your journey in the currency markets, Gold Indicator equips you with powerful insights and help you trade smarter, not harder. Built on the proven synergy of three advanced indicators, Gold Indicator focuses exclusively on medium and long-term trends eli
Introduction Harmonic Patterns are best used to predict potential turning point. Traditionally, Harmonic Pattern was identified manually connecting peaks and troughs points in the chart. Manual harmonic pattern detection is painfully tedious and not suitable for everyone. You are often exposed under subjective pattern identification with manual pattern detection. To avoid these limitations, Harmonic Pattern Plus was designed to automate your harmonic pattern detection process. The functionality
Pips Stalker
Abdulkarim Karazon
5 (2)
Pips Stalkerはロングショートアロータイプのインジケーターで、あらゆるレベルのトレーダーがより良い意思決定を行えるようにサポートします。インジケーターはリペイントされず、RSIを主なシグナルロジックとして用い、一度矢印が出されるとリペイントやバックペイントはなく、矢印の遅延もありません。 PIPS STALKER ARROWの特徴 : スタッツパネル は、全体の勝率%や連続の最大勝敗トレード数などの有用な統計、その他有用な情報を表示するユニークな情報ダッシュボードです。 TPとSL、組み込みのマネーマネジメント 指標は各矢印でTPとSLのオブジェクトを示し、トレーダーはマネーとリスク管理を組み込み、SLはATRに基づいて、TPは現在のATR SL価値に基づくリスク対リターン比率に基づいています。 再塗装不要、高い調整可能性 インジケーターはシグナル品質向上のオプションを豊富に提供しており、わずかな期間調整だけでどのペアでも機能します。パネルはトレーダーに現在の設定や期間が利益を上げているかどうかを示します。推奨期間枠:M1。 再調整開始資本金:100ドル。 推奨アカ
CRT Multi-Timeframe Market Structure & Liquidity Sweep Indicator Non-Repainting | Multi-Asset | MT5 Version Available MT5 Version:   https://www.mql5.com/en/market/product/162075 Full User Guide — explains what each feature does and why:   https://www.mql5.com/en/blogs/post/767525 Quick Start User Guide  — explains how to configure and in what order:  https://www.mql5.com/en/blogs/post/767540 Indicator Overview CRT Ghost Candle HTF Fractal is a complete institutional-grade market structure too
Meravith
Ivan Stefanov
5 (3)
マーケットメーカーのためのツール。 Meravith は次の機能を提供します: すべての時間足を分析し、現在有効なトレンドを表示します。 強気と弱気の出来高が等しくなる流動性ゾーン(出来高均衡)を強調表示します。 異なる時間足のすべての流動性レベルをチャート上に直接表示します。 テキスト形式の市場分析を生成し、参考情報として表示します。 現在のトレンドに基づいて目標値、サポートレベル、ストップロスを計算します。 取引のリスクリワード比を算出します。 口座残高に基づいてポジションサイズを計算し、潜在的な利益を推定します。 また、市場に大きな変化があった場合には警告を表示します。 インジケーターの主要ライン: 強気/弱気の出来高エグゾーストライン ― 目標値として機能します。 市場のトレンドを示すライン。市場が強気か弱気かによって色が変わり、トレンドのサポートとして機能します。主にその色が市場センチメントを示します。 出来高均衡ライン(Eq)。Eq(Volume Equilibrium)ラインはシステムの中核です。これは買い手と売り手の出来高のバランスポイントを表します。市場の流動性を示し
作者のその他のプロダクト
EZT Trend
Tibor Rituper
4.75 (4)
EZTトレンドインジケーターは、トレンド、プルバック、エントリーの機会を示します。 オプションのフィルタリングとあらゆるタイプのアラートが利用可能です。 電子メールおよびプッシュ通知アラートが追加されます。 また、このインジケーターに基づいた EA も開発中であり、間もなく利用可能になる予定です。 2色のヒストグラムとラインで構成される多機能インジケーターです。 これはトレンドの方向と強さを視覚的に表現したもので、ラインまたはヒストグラム上で発散が何度も見つかります。 このインジケーターは自動パラメーター設定とうまく連携します。 これらは特定の時間枠に対して事前に決定されており、その設定でインジケーターを使用することをお勧めします。 手動モードでは、独自のパラメータを設定できます。 これはマルチタイムフレーム(MTF)インジケーターです。 このインジケーターは、MTF rsi、MTF cci、MACD pro などの他のインジケーターの組み合わせとうまく機能します。 取引される商品の変動が大きいほど、最適なエントリーを見つけるために使用する必要がある時間枠は短くなります。 常
The FREE version works on Demo account and only CADCHF and NZDCHF pairs. The indicator predict the future candles direction, by scanning past candle movement. Based on the principal: “ The history repeat itself”. Programmed according to Kendall Correlation. In the settings menu, different scanning options are available. When the indicator find a match, start painting future candles from the current candle to the right, also from the current candle to the left as well, showing you the candle pa
FREE
This is a free version of our Great tool with limited functions. The ChartChanger is a great utility tool to reduce the number of open charts on your terminal. There is three section to it: Symbols, Time frames and Templates. You need only one chart to be open and still you can scroll up to multiple ones. Symbols: With the push of a button you can change from one symbol to another, and your applied indicators will stay on the next chart. For the symbols there is an auto detection mode, or you ca
FREE
This indicator can display 1-6 RSI indicator on different timeframes and settings. The active indicators can give visual and sound alert on oversold/overbought level if the user choose that option. Alert can be set on one or all active indicator, even if the timeframe, the period and the oversold/overbought level different on each.There is a display panel with buttons on the main chart, what is show the active indicators and their settings.There is an option to hide this panel. With the buttons
This indicator can display 1-3 CCI indicator on different time frames and settings. The active indicators can give visual and sound alert on oversold/overbought level if the user choose that option. Alert can be set on one or all active indicator, even if the time frame, the period and the oversold/overbought level different on each. There is a display panel with buttons on the main chart, what is show the active indicators and their settings. There is an option to hide this panel. With the butt
This indicator can display 1 or 2 MACD indicator on different time-frames and settings. Uses EMA for calculation. The active indicators can give visual and sound alert on zero-level-cross if the user choose that option. Alert can be set on one or both active indicator, even if the time-frame, and the period different on each. When alert set to both, the two MACD histogram must be on the same size of the 0 level to get an arrow. There is a display panel with buttons on the main chart, what is sho
ソフトウェアの説明 このインジケーターは、さまざまな時間枠と設定で 1 つまたは 2 つの MACD インジケーターを表示できます。 計算にEMAを使用する無料バージョンがあります。 この Pro バージョンでは、計算に 4 つの移動平均タイプ (単純、指数、平滑化、線形加重) をすべて使用します。 アクティブなインジケーターは、ポップアップ、サウンド、プッシュ、または電子メールで警告を発することができます。 無料バージョンのアラートはゼロレベルクロスのみですが、このプロバージョンのアラートは、ユーザーがオプションを選択した場合、ゼロレベルクロスまたはヒストグラムシグナルラインクロスに設定できます。 それぞれの時間枠と期間が異なる場合でも、アクティブなインジケーターの一方または両方にアラートを設定できます。 2 つの MACD インジケーターを使用している場合、アラートはそれぞれで個別に機能します。 メインチャートにはボタンを備えた表示パネルがあり、アクティブなインジケーターとその設定が表示されます。 このパネルを非表示にするオプションがあります。 ボタンを一時的に使用すると、アク
ChartChanger は、端末上で開いているチャートの数を減らすための優れたユーティリティ ツールです。これには、シンボル、タイムフレーム、テンプレートの 3 つのセクションがあります。開いているグラフは 1 つだけですが、複数のグラフまでスクロールできます。 シンボル: ボタンを押すだけで、あるシンボルから別のシンボルに変更でき、適用したインジケーターは次のチャートに残ります。シンボルには自動検出モードがあり、希望するシンボルを手動で入力することもできます。 28 個すべて、またはそれ以下の任意の番号を使用できます。 MetaTrader にある通貨ペア、エネルギー、指数、商品などのシンボルを使用できます。 タイムフレーム: パネルの中央にタイムフレームチェンジャー機能を追加しました。ボタンを押すだけで、1分足から月足チャートまでお好みの時間足に変更できます。 テンプレート: このパネルの 3 番目の機能は、テンプレート チェンジャーです。 9 つの組み込みテンプレート。任意のテンプレートを使用することも、まったく使用しないこともできます。 すべてのボタンはフリーフローティングパ
これは、マルチタイムフレームを巻き込むローソク足アラートインジケーターです。 現在の時間枠のみ、または 1 分足から月足までのすべての時間枠で使用できます。 これは再描画しない MTF インジケーターです。 選択したタイムフレーム オプション (マルチタイムフレーム モード) を使用すると、実際の現在のタイムフレーム以上のシグナルを確認できます。 選択した時間枠ごとに、ポップアップ、電子メール、プッシュ通知アラートが個別に表示されます。 インジケーターは価格チャート上にドットを配置します。 強気の場合は巻き込みローソク足が価格線より下にあり、弱気の場合は巻き込みローソク足が価格線より上にあります。 アラートを取得するだけで、チャートがドットで混雑したくない場合は、矢印の色を選択するだけです: なし。 設定: 矢印を表示するローソク足の制限: 矢印/ドットを表示するローソク足の数。 時間枠選択モード: 現在または選択した時間枠。 飲み込みフィルターモード:「強力公式」「公式」「非公式」の3つから選択可能。 3 つのオプションはすべて、最後の 20 個のローソク足の平均体
This is a great utility tool to see valuable information on your chart. The panel is free-floating, grab with your mouse and move around on the chart with ease. Also the panel is collapsible so you can save space, and you can see only the information you wish. There is three section to the panel, when is closed you can see the top section only. Here the list of information you can see on the panel, from the top to bottom: The first part of the panel: Price : The color is changing according to d
EZT_Stochastic   This is a Multi Timeframe stochastic indicator, with colored background. The colored background can be set to different colors based on the K and D line, (moving up, or down), and also about the position of the lines. In the oversold or overbought zones you can choose different colors.   Settings: You can choose the time-frame you want to see the stochastic. Set the regular parameters in a same way like in the original stochastic. Histogram style: The style. Histogram width: The
EZT_Ichimoku_MTF Multitimeframe Ichimoku indicator. Display up to 4 different Ichimoku on the chart. Every line of every ichimoku is customizable, you can turn off/on or choose different thickness or color. You can choose to see only the cloud in multiple ichimokus. Optional info panel to identify the different Ichimokus. Works the same way like the original Ichimoku indicator.
EZT Trade History This is a great tool to analyze past trades or follow current ongoing trades, especially when you using an EA to manage your transactions. You will see the exact candle where the trade was opened and closed. Collapsible floating panel on the chart, free to move anywhere with your mouse. When you using multiple EA’s with different magic numbers, you have 5 options to separate those trades, so you will know which EA opened specific transactions. You can set the day limits how fa
EZT Bollinger Trendline Indicator based on multiple settings of Bollinger Band. In the menu you can choose the similar settings than bollinger band indicator. Trend period and trend deviations. Also paint and arrow on chart when direction change. Three different kind of alert , such as pop up, e-mail and push notification. Try different settings on different timeframes. Please help my work and rate and comment my products!
The indicator predict the future candles direction, by scanning past candle movement. Based on the principal: “ The history repeat itself”. Programmed according to Kendall Correlation. In the settings menu, different scanning options are available. When the indicator find a match, start painting future candles from the current candle to the right, also from the current candle to the left as well, showing you the candle pattern what the actual signal is based on. The left side candle are optiona
フィルタ:
レビューなし
レビューに返信