MQLTA Currency Strength Lines

4.88

The Currency Strength Lines (CSL) indicator is a very useful tool for both beginners and experienced traders. It is able to calculate the strength of single currencies and show them on a chart, so that you can see the trend and spot trading opportunities.


How does it work?

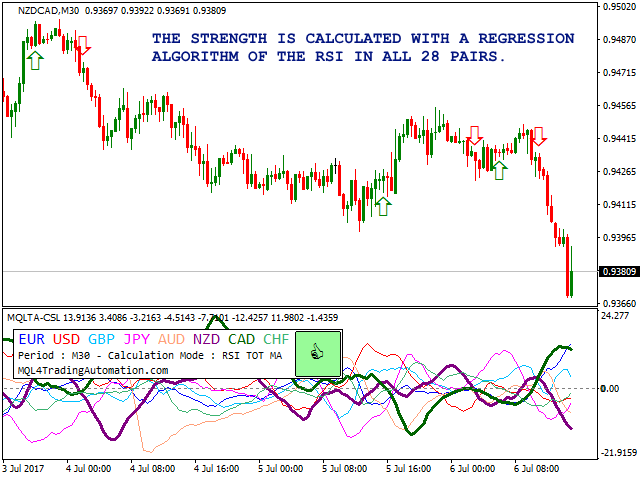
The CSL Indicator will run calculations on all the 28 pairs, resulting in the overall strength across the market of individual currencies at any given moment. You can use this data to spot currencies that are strong, getting stronger, weak, getting weaker.

  • A line going upwards means that the currency is gaining strength.
  • A line pointing downwards means that the currency is becoming weak.
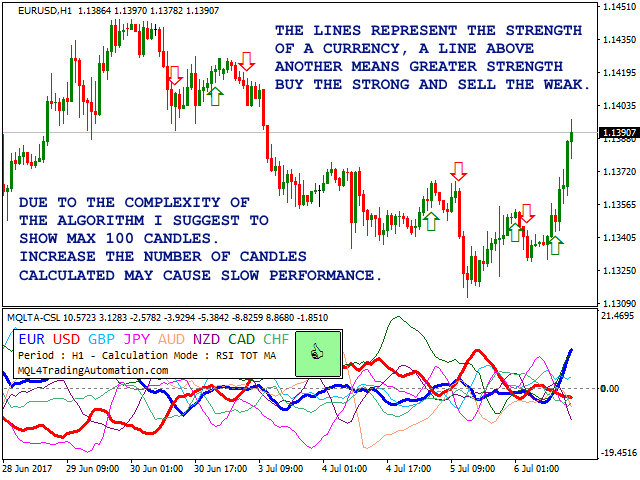
  • A line above another one means that one currency is stronger than the other.
  • Flat lines, or almost flat, represent currencies that are maintaining the current strength.
  • A line above zero is likely to have a bullish trend against currencies below zero and vice versa.

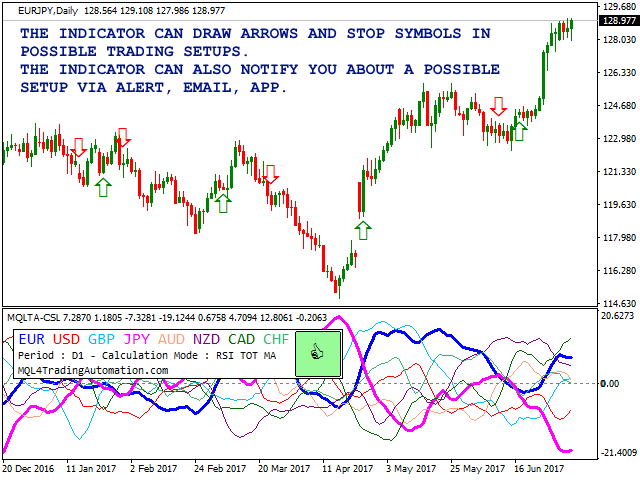
If the option is enabled, the indicator will draw arrows for possible BUY or SELL signals on the current symbol. You can also select to be notified.


How to trade with CSL indicator

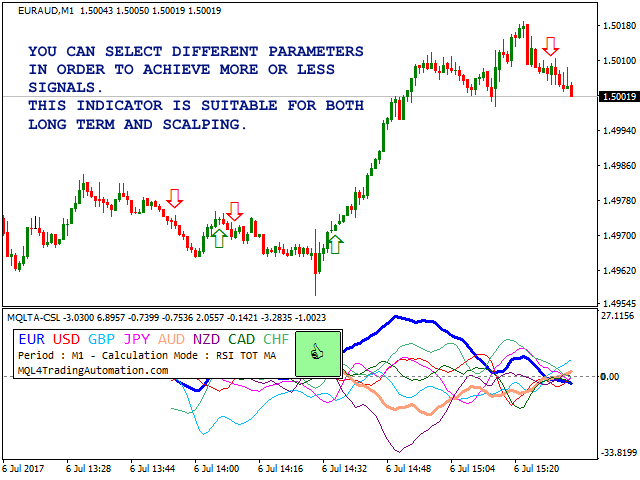
CSL Indicator can be used for long term or scalping. It is better to confirm entry signals with another indicator or price action.

  • Diverging lines, that is where a currency is gaining strength and the other is losing strength.
  • Better when a line above zero and one below.
  • BUY the STRONG and SELL the WEAK.


Why you should use the CSL Indicator?

The Currency Strength Lines indicator is a very useful tool to:

  • spot trend continuation.
  • spot possible trend reversal.
  • filter the pairs to trade, showing which currencies are strong and which are weak.


How to test and backtest

MetaTrader 4 has known limitations when it comes to backtest indicators and Expert Advisors involving multiple currencies, so if you are trying to try the demo or backtest the indicator follow these steps:

  1. Open all the 28 pairs containing the 8 major currencies and the timeframe that you want to test, allow some time to download the historical data.
  2. Load the indicator in the strategy tester and choose your preferred parameters.
  3. Select a period to test that is quite recent to make sure that the historical data for all 28 pairs are available.

To work around this process, I created a DEMO for you to to see the indicator in action with only four currencies. Check https://www.mql5.com/en/market/product/23029.
You can also rent the indicator for a month for a very low price.


Parameters

  • Indicator's Name - name of the indicator. This must be different if you intend to add more than one instance.
  • Calculation Mode - calculation method. Choose the more suitable one for your trading style.
  • RSI Period - period of the RSI in case you select a method using the RSI (recommended between 10 and 50).
  • RSI Smoothing - period of the moving average to smooth the lines when RSI MA is selected (recommended between 2 and 10).
  • Show Arrow Signal - display arrows.
  • Draw when a currency is above the other - display an arrow every time the lines are crossed.
  • Draw if lines are opposite to the zero - less but more reliable signals.
  • Buy Signal Color - buy arrow color.
  • Sell Signal Color - sell arrow color.
  • Neutral signal color - stop signal color.
  • Enable Notification - enable/disable notifications.
  • Send Alert Notification - send alert notifications (popup screen in MetaTrader).
  • Alert Sound - file name of the sound to play during the alert.
  • Send Notification to Mobile - send notifications to the mobile app.
  • Send Notification via Email - send notifications via emails.
  • Wait time between notifications - minutes of wait before sending another notification.
  • Number of bars to calculate - number of bars to consider, above 1000 will cause slow loading time.
  • Pairs Prefix - prefix of the pair.
  • Pairs Suffix - suffix of the pair.
  • Currencies to Analyze - consider/ignore the currency, recommended true
    • EUR.
    • USD.
    • GBP.
    • JPY.
    • AUD.
    • NZD.
    • CAD.
    • CHF.
  • Currencies Colors and Width
    • Corner to show the labels - Top or Bottom, Left or Right.
    • Horizontal offset (pixels) - horizontal spacing.
    • Vertical offset (pixels) - vertical spacing.
    • Label Color - color of label.
    • EUR - lines colors.
    • USD.
    • GBP.
    • JPY.
    • AUD.
    • NZD.
    • CAD.
    • CHF.
    • Width for Currencies not on chart - recommended 1 to 5.
    • Width for Currencies on chart - recommended 1 to 5.

If you like this tool please take a minute to leave a review.

If you have suggestions to improve it please send me a message and we can discuss it further.

Feel free to visit my profile and "Add to friends" https://www.mql5.com/en/users/mql4autotrading.

レビュー 11
dplessjf
49
dplessjf 2024.06.06 20:23 
 

I love it!

Masoud Seydeshaghi
872
Masoud Seydeshaghi 2023.10.18 14:21 
 

top Hello buddy I like the indicator might you add silver oil gold to it also please

dedy22
14
dedy22 2021.12.01 02:35 
 

it`s a great indicator

おすすめのプロダクト
AP VWAP Bands Pro (MT4) Volume-weighted average price with ±σ bands for clear intraday bias, mean-reversion zones, and dynamic support/resistance. Works on crypto (incl. BTC), FX, indices, and metals. Uses tick-volume when real volume isn’t available. What it shows VWAP line (volume-weighted mean price). Two envelopes around VWAP (default ±1σ and ±2σ) to highlight balance vs. extension. Reset modes: Day, Week, or Anchor Time (HH:MM) to start VWAP where you need it (e.g., exchange open). Why
FREE
Quantum Falcon Signal Free is a smart visual trading indicator for MetaTrader 4 designed for Forex and Gold traders. The indicator combines: • Trend analysis • RSI momentum confirmation • MACD momentum filtering • ATR volatility filtering • Higher timeframe confirmation • Smart exit signal detection Main Features: • Smart Buy and Sell signals • Exit Buy / Exit Sell alerts • Real-time dashboard on chart • Professional candle arrows • Multi-timeframe trend confirmation • ATR market volatility filt
FREE
Candle Pattern Finder Candle Pattern Finder is a powerful MT4 indicator designed to help traders easily detect key candlestick patterns in real-time. Whether you're trading trends, reversals, or consolidations, this tool highlights important price action signals directly on the chart — helping you make faster and more confident trading decisions. Detects popular candlestick patterns: Bullish/Bearish Engulfing Hammer & Inverted Hammer Shooting Star & Hanging Man Three White Soldiers Three Black
FREE
The indicator allows you to trade binary options. The recommended time frame is М1 and the expiration time is 1,2,3 minutes. The indicator suitable for auto and manual trading. A possible signal is specified as a arrows above/under a candle. You should wait until the candle closes! Arrows are not re-painted Trade sessions: TOKYO section (Half-end) Currency pairs: USD/JPY Working time frame: M1 Expiration time: 1,2,3 minutes. The indicator also shows good results when using the martingale strateg
FREE
VSA - P (Volume Spread Analysis) Period-Based Histogram is a tool that visually represents market volume dynamics using Volume Spread Analysis principles, with a focus on highlighting key volume changes over specific time periods. The histogram captures changes in volume and price spread relationships in real-time, enabling traders to detect early signals of accumulation, distribution, and shifts in buying or selling pressure. Indicator is non repainting and working with real-time on tick data.
Smart FVG インジケーター MT4 – MetaTrader 4 向け高度なフェアバリューギャップ検出 Smart FVG インジケーター MT4 は、MetaTrader 4 上で Fair Value Gap(FVG)をプロフェッショナルレベルで検出・監視し、アラートまで行うツールです。ATR ベースのフィルタリングと相場構造を考慮したロジックを組み合わせることで、ノイズを取り除き、流動性に応じて適応し、本当に重要な不均衡だけを残して精度の高い判断をサポートします。 主な特長 正確な FVG 検出:単なるローソク足のギャップではなく、市場の本質的な非効率を捉えます。 ATR ベースの精度:市場や時間軸が変わっても、低品質なシグナルを自動的にフィルタリング。 有効性のリアルタイム追跡:価格がゾーンを埋める/ブレイクすると、ゾーンが自動で延長・調整・削除されます。 カスタマイズ可能な表示:色・ラインスタイル・塗りつぶしを自由に設定し、どんなテンプレートにも合わせられます。 実用的なアラート:新規 FVG や、埋められた/無効化されたゾーンをリアルタイム通知。 パフォーマンス
FREE
SX Supply Demand Zones accurately identifies and draws high-probability Supply and Demand zones using a sophisticated algorithm. Unlike traditional indicators that clutter your chart, this indicator is designed with a focus on performance and a clean user experience. New Unique Feature: Interactive Legend System What truly sets this indicator apart from everything else is the Interactive Control Legend. You have a professional dashboard directly on your chart that allows you to: Show/Hide: Ins
FREE
「調整可能なフラクタル」はフラクタル インジケーターの高度なバージョンで、非常に便利なトレーディング ツールです。 - ご存知のとおり、標準フラクタル MT4   インジケーターには設定がまったくありません。これはトレーダーにとって非常に不便です。 - 調整可能なフラクタルは、この問題を解決しました。必要な設定がすべて揃っています。 - インジケーターの調整可能な期間 (推奨値 - 7 以上)。 - 価格の高値/安値からの距離を調整可能。 - フラクタル矢印のデザインを調整可能。 - インジケーターにはモバイルおよび PC アラートが組み込まれています。 高品質のトレーディングロボットとインジケーターをご覧になるにはここをクリックしてください! これは、この MQL5 Web サイトでのみ提供されるオリジナル製品です。
Enhanced Volume Profile: The Ultimate Order Flow & Liquidity Analysis Tool Overview Enhanced Volume Profile   is an indicator for MetaTrader 5 that displays the traded volume at specific price levels over a defined period. It separates the total volume into buy and sell components, presenting them as a side-by-side histogram on the chart. This allows users to observe the volume distribution and the proportion of buy and sell volumes at each price level. Graphics Rendering The indicator uses t
FREE
Trade History for MT4  This indicator is specially developed for that traders want to display his trades on the charts. Shows history and current deals on the chart. Trades show on the chart with a dotted line, and profit will show realtime. Buy trades are displayed in bull color, Sell trades in bear color. Tip: The historical order displayed by the indicator is associated with the "Account History", so please set the historical order display in the "Account History" of MT software. If you a
FREE
Price Magnet — Price Density and Attraction Levels Indicator Price Magnet is a professional analytical tool designed to identify key support and resistance levels based on statistical Price Density. The indicator analyzes a specified historical period and detects price levels where the market spent the most time. These zones act as “magnets,” attracting price action or forming a structural base for potential reversals. Unlike traditional Volume Profile tools, Price Magnet focuses on price-time d
「Auto FIBO Pro」Crypto_Forex インジケーターは、取引の補助ツールとして最適です。 - インジケーターは、フィボナッチ レベルとローカル トレンド ライン (赤色) を自動的に計算してチャート上に配置します。 - フィボナッチ レベルは、価格が反転する可能性のある重要な領域を示します。 - 最も重要なレベルは、23.6%、38.2%、50%、61.8% です。 - リバーサル スキャルピングやゾーン グリッド取引に使用できます。 - Auto FIBO Pro インジケーターを使用して、現在のシステムを改善する機会も多数あります。 - Info Spread Swap Display があり、接続されている外国為替ペアの現在のスプレッドとスワップを表示します。 - ディスプレイには、アカウントの残高、エクイティ、マージンも表示されます。 - Info Spread Swap Display は、チャートのどのコーナーにも配置できます。 高品質のトレーディングロボットとインジケーターをご覧になるにはここをクリックしてください! これは、この MQL5 ウェブサイ
QualifiedEngulfing - は ProEngulfing インジケーターの無料版です。 ProEngulfing - は Advance Engulf インジケーターの有料版で、 こちらからダウンロードできます。 ProEngulfing の無料版と有料版の違いは何ですか?無料版は1日に1つのシグナルの制限があります。 QualifiedEngulfingをご紹介します - あなたのMT4用のプロフェッショナルエンゴルフパターンインジケーター Precisionの力を解放して、QualifiedEngulfingを使用して外国為替市場での資格のあるエンゴルフパターンを特定および強調する先進的なインジケーターです。MetaTrader 4用に開発されたQualifiedEngulfingは、外国為替市場のエンゴルフパターンを確認およびハイライトするために設計された切り立ったアプローチを提供し、取引の決定に対して最も信頼性の高いシグナルのみを受け取ることを確認します。 QualifiedEngulfingの動作方法: QualifiedEngulfingは、エンゴルフパター
FREE
Highlights trading sessions on the chart The demo version only works on the AUDNZD chart!!! The full version of the product is available at: (*** to be added ***) Trading Session Indicator displays the starts and ends of four trading sessions: Pacific, Asian, European and American. the ability to customize the start/end of sessions; the ability to display only selected sessions; works on M1-H2 timeframes; The following parameters can be configured in the indicator: TIME_CORRECTION = Correct
FREE
Sentinel Arrow 主な機能: ⊗トレンド、反転、そしてモメンタムの変化を迅速かつ正確に特定する独自のアルゴリズム。 ⊗プロフェッショナル向けに設計されており、遅延や誤更新を排除する堅牢なシグナルロジックを備えています。 ⊗様々な時間枠に対応しています。 ⊗過去のシグナルを再描画、削除、または変更することはありません。 ⊗すべての買いシグナルと売りシグナルはローソク足自体に生成され、固定されたままです。 ⊗実際の取引では、シグナルの再描画は行われず、シグナルはローソク足自体に即座に表示されます。 ⊗安定性、正確性、柔軟性を保証します。 ⊗高い勝率のシグナルを提供します。 ⊗各シグナルは一度だけトリガーされ、重複はありません。 ⊗すべての通貨ペア、指数、株式、FX、貴金属、暗号通貨に適しています。 ⊗トレンドトレード、スイングトレード、反転確認。 ⊗信頼性が高く明確なプロフェッショナルシグナルを求めるトレーダー向け。 ⊗完全にカスタマイズ可能。
FREE
Market Profile 3
Hussien Abdeltwab Hussien Ryad
3 (2)
Market Profile 3 MetaTrader 4 indicator  — is a classic Market Profile implementation that can show the price density over time, outlining the most important price levels, value area, and control value of a given trading session. This indicator can be attached to timeframes between M1 and D1 and will show the Market Profile for daily, weekly, monthly, or even intraday sessions. Lower timeframes offer higher precision. Higher timeframes are recommended for better visibility. It is also possible t
FREE
外国為替マーケットプロファイル(略してFMP) これは何ではありません: FMPは、従来の文字コード化されたTPO表示ではなく、チャートデータプロファイルの計算全体を表示しません。また、チャートを期間に分割して計算しません。 それが何をするか: 最も重要なことは、FMPインジケーターは、ユーザー定義のスペクトルの左端とユーザー定義のスペクトルの右端の間にあるデータを処理することです。 ユーザーは、インジケーターの両端をマウスで引くだけでスペクトルを定義できます。 インジケーターの右端がライブバーに引き寄せられ、さらに(将来に)引っ張られると、インジケーターは「ライブ」と見なされます(新しいバーで更新されます) インジケーターは、アタッチされているチャートに「アンカー」オブジェクトをドロップし、その後、そのアンカーをハードドライブ上のファイルに関連付けます。 これにより、チャート(またはインジケーター)が閉じられるまで、再起動しても設定が維持された状態で、チャート上で継続的なFMPを実行できます。 FMPインジケーターは、1つのチャート上でそれ自体の多くのインスタンスを実行でき、
FREE
Rainbow MT4 is a technical indicator based on Moving average with period 34 and very easy to use. When price crosses above MA and MA changes color to green, it’s a signal to buy. When price crosses below MA and MA changes color to red, it’s a signal to sell. The Expert advisor ( Rainbow EA MT4) based on Rainbow MT4 indicator, as you can see in the short video below is now available here .
FREE
The indicator analyzes the volume scale and splits it into two components - seller volumes and buyer volumes, and also calculates the delta and cumulative delta. The indicator does not flicker or redraw, its calculation and plotting are performed fairly quickly, while using the data from the smaller (relative to the current) periods. The indicator operation modes can be switched using the Mode input variable: Buy - display only the buyer volumes. Sell - display only the seller volumes. BuySell -
FREE
The indicator shows which trading pairs, strategies, robots and signals that you use are profitable and which are not. The statistic of trades and balance graph are displayed in the account currency and pips - to switch simply click on the graph. button "$"(top left) - minimize/expand and move the indicator panel button ">"(bottom right) - stretching and resetting to the original size Statistic of trades 1 line - account balance, current profit and lot of open trades; 2 line - the number of all
This indicator help to mark the high and low of the session Asian,London,Newyork , with custom hour setting This indicator is set to count from minute candle so it will move with the current market and stop at the designated hour and create a accurate line for the day. below is the customization that you can adjust : Input Descriptions EnableAsian Enables or disables the display of Asian session high and low levels. EnableLondon Enables or disables the display of London session high and
FREE
MASi Three Screens is based on the trading strategy by Dr. Alexander Elder. This indicator is a collection of algorithms. Algorithms are based on the analysis of charts of several timeframes. You can apply any of the provided algorithms. List of versions of algorithms:     ThreeScreens v1.0 - A simple implementation, with analysis of the MACD line;     ThreeScreens v1.1 - A simple implementation, with analysis of the MACD histogram;     ThreeScreens v1.2 - Combines the first two algorithms in
FREE
Trend PA
Mikhail Nazarenko
5 (3)
The Trend PA indicator uses   Price Action   and its own filtering algorithm to determine the trend. This approach helps to accurately determine entry points and the current trend on any timeframe. The indicator uses its own algorithm for analyzing price changes and Price Action. Which gives you the advantage of recognizing, without delay, a new nascent trend with fewer false positives. Trend filtering conditions can be selected in the settings individually for your trading style. The indicator
Basic Renko MT4
Mehran Sepah Mansoor
4 (8)
基本的なRenkoインディケータは、明確で簡潔な相場観を求めるトレーダーにとって強力なツールです。当社のインディケータは、トレンドの視覚化を簡素化するだけでなく、反転の正確なアラートを提供し、あなたの取引に戦略的な優位性を提供します /  MT5無料版 特徴 フルカスタマイズ可能: 高度なカスタマイズオプションにより、インジケーターをお好みに合わせてカスタマイズできます。色からボックスサイズ設定まで、チャート上の情報表示方法を完全にコントロールできます。 反転アラート: 反転アラートで、市場の方向性が変化する可能性をいち早く知ることができます。これにより、利益を最大化し、損失を最小化するために、情報に基づいたタイムリーな意思決定を行うことができます。 入力項目 Size of the boxes:   ボックスサイズ(ポイントベース) Bullish box colour:   強気ボックスの色 Bearish box colour:   弱気ボックスの色 Box opacity:   不透明度(0から100の間)。不透明度が低くなるにつれて透明度が高くなる Text col
FREE
FFx Fractals
Eric Venturi-Bloxs
4.5 (2)
The purpose of this new version of the MT4 standard indicator provided in your platform is to display in a sub-window multiple timeframes of the same indicator. See the example shown in the picture below. But the display isn’t like a simple MTF indicator. This is the real display of the indicator on its timeframe. Here's the options available in the FFx indicator: Select the timeframes to be displayed (M1 to Monthly) Define the width (number of bars) for each timeframe box Alert pop up/sound/ema
FREE
このプロジェクトが好きなら、5つ星レビューを残してください。 このインジケータは、指定されたためのオープン、ハイ、ロー、クローズ価格を描画します 特定のタイムゾーンの期間と調整が可能です。 これらは、多くの機関や専門家によって見られた重要なレベルです トレーダーは、彼らがより多くのかもしれない場所を知るために有用であり、 アクティブ。 利用可能な期間は次のとおりです。 前の日。 前週。 前の月。 前の四半期。 前年。 または: 現在の日。 現在の週。 現在の月。 現在の四半期。 現年。
FREE
Master the market rhythm with the Advanced Market Sessions indicator. Timing is everything in trading. Knowing exactly when major financial centers open and close is the key to understanding market volatility, liquidity, and directional bias. This indicator gives you crystal-clear visibility into the three major trading sessions: Asia, London, and New York. By automatically mapping the exact High and Low of each session in real-time, this tool empowers you to trade with true institutional contex
FREE
The indicator shows the potential trend direction by cyclical-wave dependence. Thus, all the rays of the intersection will be optimal rays, in the direction of which the price is expected to move, taking into account the indicator period. Rays can be used as a direction for potential market movement. But we must not forget that the approach must be comprehensive, the indicator signals require additional information to enter the market.
FFx ParabolicSAR
Eric Venturi-Bloxs
4.67 (3)
The purpose of this new version of the MT4 standard indicator provided in your platform is to display in a sub-window multiple timeframes of the same indicator. See the example shown in the picture below. But the display isn’t like a simple MTF indicator. This is the real display of the indicator on its timeframe. Here's the options available in the FFx indicator: Select the timeframes to be displayed (M1 to Monthly) Define the width (number of bars) for each timeframe box Alert pop up/sound/ema
FREE
Zig Zag 123 tells us when a reversal or continuation is more likely by looking at the shift in supply and demand. When this happens a signature pattern appears known as 123 (also known ABC) will often break out in direction of higher low or lower high. Stop loss and take profit levels have been added. There is a panel that shows the overall performance of your trades for if you was to use these stop loss and take profit levels.  We get alerted if a pattern 123 appears and also if the price re
FREE
このプロダクトを購入した人は以下も購入しています
Neuro Poseidon is a new indicator by Daria Rezueva. It combines precise trading signals with adaptive TP/SL levels - creating best possible trades as a result! Message me and get  Neuro Poseidon Assistant  as a gift to automize your trading process! What makes it stand out? 1. Proven profitability on all assets and timeframes 2. Only confirmed BUY and SELL signals present on the chart 3. Adaptive TP & SL levels generated by the software for each trade 4. Easy to understand - suitable for all
Scalper Inside PRO Scalper Inside PRO は、MetaTrader 4 向けの短期トレンドおよびスキャルピング用インジケーターです。独自アルゴリズムを用いて、市場の方向性と主要なターゲットレベルを素早く検出します。エントリー、イグジット、複数の利確ターゲットを自動計算し、詳細なパフォーマンス統計を表示することで、さまざまな銘柄やストラテジーがどのように機能してきたかを確認できます。これにより、現在のマーケットコンディションに最も適した取引銘柄を選択するのに役立ちます。さらに、Scalper Inside PRO には、お使いの矢印インジケーターを簡単に接続でき、その統計と過去のパフォーマンスを素早く評価できます。 本インジケーターは、あらゆる銘柄と時間足で動作し(短期トレードには M5 を推奨)、複数の内蔵ストラテジーを備えています。そのため、単体のスキャルピングツールとしても、トレーディングシステム内の強力な分析コンポーネントとしても活用できます。 主な機能 独自アルゴリズム(Next‑Generation Trend Detection Algor
M1 SNIPER は使いやすいトレーディングインジケーターシステムです。M1時間足向けに設計された矢印インジケーターです。M1時間足でのスキャルピングのためのスタンドアロンシステムとして、また既存のトレーディングシステムの一部としても使用できます。このトレーディングシステムはM1時間足での取引に特化して設計されていますが、他の時間足でも使用できます。元々、この手法はXAUUSDとBTCUSDの取引用に設計しましたが、他の市場においても役立つと考えています。 インジケーターのシグナルは、トレンドの方向と逆方向に取引できます。インジケーターのシグナルを利用して両方向に取引するのに役立つ特別な取引テクニックをご紹介します。この手法は、特別な動的なサポートとレジスタンスの価格帯を利用することに基づいています。 ご購入後、M1 SNIPER矢印インジケーターをすぐにダウンロードできます。さらに、M1 SNIPERツールのすべてのユーザーに、以下のスクリーンショットに表示されているApollo Dynamic SRインジケーターを無料で提供しています。この2つのインジケーターを組み合わせることで
Gann Made Easy は、ミスター・ギャンの理論を使用した取引の最良の原則に基づいた、プロフェッショナルで使いやすい外国為替取引システムです。 W・D・ガン。このインジケーターは、ストップロスとテイクプロフィットレベルを含む正確な買いと売りのシグナルを提供します。 PUSH通知を利用して外出先でも取引可能です。 ご購入後、取引方法の説明と優れた追加インジケーターを無料で入手するには、私にご連絡ください! おそらく、ギャンの取引手法についてはすでに何度も聞いたことがあるでしょう。通常、ギャンの理論は初心者のトレーダーだけでなく、すでにある程度の取引経験がある人にとっても非常に複雑なものです。なぜなら、ギャンの取引手法は理論的にはそれほど簡単に適用できるものではないからです。私はその知識を磨き、最良の原則を私の外国為替インジケーターに組み込むために数年を費やしました。 このインジケーターは非常に簡単に適用できます。必要なのは、それをチャートに添付し、簡単な取引推奨事項に従うだけです。このインジケーターは常に市場分析の仕事を行い、取引の機会を探します。適切なエントリーポイントを検出す
PRO Renko Systemは、特別にRENKOチャートを取引するために設計された高精度の取引システムです。 これは、様々な取引商品に適用することができる普遍的なシステムです。 システムは効果的に正確な逆転信号へのアクセスを与えるいわゆる市場の騒音を中和する。 表示器は非常に使いやすく、信号の生成に責任がある1つの変数だけがあります。 あなたは簡単にお好みの任意の取引ツールとレンコバーのサイズにツールを適応させることができます。 私はいつもあなたが私のソフトウェアで収益性の高い取引を支援するために余分なサポートを提供する準備ができています! 私はあなたに幸せで収益性の高い取引をしたいです! ご購入後にご連絡ください! 私はあなたに私のレンコチャートジェネレータを送信します。 私はまた、私の個人的な推奨事項やシステムの他のモジュールを無料で共有します!
トレンドキャッチャーインジケーター トレンドキャッチャーインジケーターは、開発者独自の適応型トレンド分析指標を組み合わせることで、市場価格の動きを分析します。短期的なノイズを除去し、根底にあるモメンタムの強さ、ボラティリティの拡大、価格構造の挙動に焦点を当てることで、真の市場方向性を特定します。また、移動平均線、RSI、ボラティリティフィルターなどの平滑化およびトレンドフィルタリング機能を備えたカスタマイズ指標も使用します。 実際の運用状況のモニタリングやその他の製品については、こちらをご覧ください: https://www.mql5.com/en/users/mechanic/seller ご注意ください。私はTelegramでEAや設定を販売していません。詐欺です。すべての設定はブログで無料で公開しています。 重要!ご購入後すぐにご連絡ください。手順とボーナスをお送りします!
トレンドラインプロ   市場の真の方向転換点を理解するのに役立ちます。この指標は、真のトレンド反転と主要プレーヤーが再び参入するポイントを示します。 分かりますか     BOSライン   複雑な設定や不要なノイズなしに、より長い時間足でのトレンドの変化と重要なレベルを把握できます。シグナルは再描画されず、バーが閉じた後もチャート上に残ります。 VERSION MT 5     -     RFI LEVELS PRO インジケーター と組み合わせることで、その潜在能力を最大限に発揮します。 インジケーターが示す内容: 本当の変化   トレンド(BOSライン) 一度シグナルが現れたら、それは有効です!これは、リペイント機能を持つインジケーターとの重要な違いです。リペイント機能を持つインジケーターは、シグナルを発した後、それを変更し、資金の損失につながる可能性があります。これにより、より高い確率と精度で市場に参入できます。また、矢印が現れた後、目標値(利益確定)に達するか、反転シグナルが現れるまで、ローソク足の色を変更する機能もあります。 繰り返しエントリ       主要プレーヤーの
Enigmera
Ivan Stefanov
5 (8)
ENIGMERA: 市場の中心 重要:MQL5.comのデモはStrategy Testerで実行されており、Enigmeraの機能を完全には反映していない場合があります。詳細については、説明、スクリーンショット、ビデオをご確認ください。質問があれば、遠慮なくメッセージを送ってください! インジケーターのコードは完全に書き直されました。バージョン3.0は新機能を追加し、インジケーターの開始以来蓄積されたバグを修正しました。 紹介 このインジケーターとトレーディングシステムは、金融市場への注目すべきアプローチです。ENIGMERAはフラクタルサイクルを使用して、サポートとレジスタンスのレベルを正確に計算します。真の蓄積フェーズを示し、方向と目標を提供します。トレンドでも修正でも機能するシステムです。 動作方法 インジケーターのほとんどの機能は、チャートの左側にあるボタンで制御され、市場の状況に迅速に対応できるようになっています。 ボタン ON/OFF – インジケーター全体を表示または非表示にします。 Channel – サポートチャネルを有効にし、許容範囲の偏差を示します。 Dev
Dynamic Forex28 Navigator - 次世代の Forex 取引ツール。 現在 49% オフ。 Dynamic Forex28 Navigator は、長年人気のインジケーターを進化させたもので、3 つの機能を 1 つにまとめています。 Advanced Currency Strength28 インジケーター (レビュー 695 件)  + Advanced Currency IMPULSE with ALERT (レビュー 520 件) + CS28 コンボ シグナル (ボーナス)。 インジケーターの詳細 https://www.mql5.com/en/blogs/post/758844 次世代の Strength インジケーターが提供するもの  オリジナルで気に入っていたすべての機能が、新機能と精度の向上によって強化されました。 主な機能: 独自の通貨強度計算式。 すべての時間枠でスムーズかつ正確な強度ライン。 トレンドの特定と正確なエントリーに最適です。 ダイナミックマーケットフィボナッチレベル (マーケットフィボナッチ)。 このインジケーターに固有
このインジケーターは実践的なトレードに最適な自動波動分析のインジケーターです! 場合... 注:   Tang Lun (Tang Zhong Shuo Zen) の命名規則の影響で、私は波のグレーディングに西洋の名前を使用することに慣れていません。基本的な波を ペン 、二次波のバンドを セグメント と名付けました。同時に、 セグメント にはトレンドの方向が指定されます (この命名方法は将来のノートで使用されます。最初に言っておきます)。ただし、アルゴリズムは曲がりくねった理論とはほとんど関係がないため、付けるべきではありません。これは、私の市場分析 によって要約された、絶えず変化する複雑な運用ルール を反映しています。 バンドは標準化され、人によって異なることがないよう定義されており、市場参入を厳密に分析する上で重要な役割を果たす人為的な干渉の描画方法が排除されています。 このインジケーターを使用することは、取引インターフェイスの美しさを改善することと同等であり、元の K ライン取引を放棄し、取引の新しいレベルに連れて行きます。また、宣伝の観点から顧客の認識も向上します。 イ
このインジケーターは、反転ポイントと価格戻りゾーンを正確に表示します。     主要プレーヤー 。新たなトレンドが形成される場所を把握し、最大限の精度で意思決定を行い、すべての取引をコントロールします。 TREND LINES PRO インジケーターと組み合わせることで、その潜在能力を最大限に発揮します。 VERSION MT5 インジケーターが示す内容: 新しいトレンドの始まりに活性化する反転構造と反転レベル。 リスクと報酬の比率を最小限に抑えた利益 確定 と 損失停止の レベルの表示     RR 1:2   。 インテリジェントな削減ロジックによるストップロス。 指定されたインジケーターから 2 つのトレンド タイプの反転パターンを表示します。 指標: トレンドを追う   TREND LINES PRO   (世界的なトレンドの変化) TREND PRO   (クイックトレンド変更) シンプルで効果的   スキャナー   リアルタイムトレンド(新機能)。 マルチタイムフレームのインストゥルメント フィルタリング。 画面   利益     LOGIC AI信号の後。 当日プラス方
Genesis Matrix Pro is a professional multi-timeframe trend detection indicator designed to help traders identify high-quality market alignment with clarity and structure. It combines 12 different technical indicators into one visual alignment matrix, allowing traders to quickly see when market conditions are bullish, bearish, or neutral. A signal is generated only when the selected strategies are aligned, helping reduce noise and improve decision-making. PLEASE CONTACT ME AFTER PURCHASE TO GET
この製品は 2026 年の市場向けに更新され、最新の MT5 ビルドに最適化されています。 価格更新のお知らせ: Smart Trend Trading System は現在 $99 で提供されています。 次の 30 件の購入 後、価格は $199 に上がります。 特別オファー: Smart Trend Trading System を購入後、私にプライベートメッセージを送ることで、 Smart Universal EA を無料 で受け取り、Smart Trend のシグナルを自動売買に変えることができます。 Smart Trend Trading System は、リペイントなし、再描画なし、遅延なしの完全なトレーディングシステムです。よりクリーンなシグナル、より明確なトレンド方向、そしてより整理された取引方法を求めるトレーダー向けに作られています。 Online course , manual and download presets . このシステムは、トレンド検出、反転ゾーン、Smart Cloud、トレーリングストップロジック、サポートとレジスタンス、ローソク足の色分け、ア
MTF Supply Demand Zones
Georgios Kalomoiropoulos
4.82 (22)
次世代の自動化された需要と供給のゾーン。どのチャートでも機能する新しい革新的なアルゴリズム。すべてのゾーンは、市場の価格行動に従って動的に作成されています。 2種類のアラート --> 1) 価格がゾーンに達したとき 2) 新しいゾーンが形成されたとき もう 1 つの役に立たない指標はありません。実績のある完全な取引戦略を手に入れることができます。     新機能:     価格が需給ゾーンに達したときにアラートを出す     新しい需給ゾーンが作成されたときにアラートを発します     プッシュ通知アラート     ピップ単位のゾーン幅ラベル     MTF のもう 1 つのタイムフレーム。したがって、現在より 2 時間足高いのではなく、現在より 3 時間足し上に見えるようになります。     アラート/ゾーン/MTF 機能を有効/無効にするボタン あなたが得る利点:     取引から感情を取り除きます。     取引エントリをオブジェクト化します。     確率の高いセットアップで利益を上げましょう。     描画ゾーンから時間を節約します。
トレンドトレーディング は、タイミングのプルバックとブレイクアウトにより、市場で起こっているトレンドから可能な限り利益を得るように設計された指標です。確立されたトレンドの中で価格が何をしているかを分析することにより、取引の機会を見つけます。 [ インストールガイド | 更新ガイド | トラブルシューティング | よくある質問 | すべての製品 ] 自信を持って効率的に金融市場を取引する むち打ちにならずに確立されたトレンドから利益を得る 収益性の高いプルバック、ブレイクアウト、早期の逆転を認識する この指標は、独自の品質とパフォーマンスを分析します 複数時間枠のダッシュボードを実装します インジケーターは再描画されていません 電子メール/音声/視覚アラートを実装します 確立されたトレンドは多くの取引機会を提供しますが、ほとんどのトレンド指標はそれらを完全に無視しています。インジケーターの解釈はかなり簡単です: (1) トレンドの変化 (2) トレンドの方向への後退 (3) トレンドの方向へのブレイクアウト 赤いダッシュ は下降トレンド中の修正です 青いダッシュ は上昇トレンド中
Step into the world of Forex trading with confidence, clarity, and precision using   Gold Indicator   a next-generation tool engineered to take your trading performance to the next level. Whether you’re a seasoned professional or just beginning your journey in the currency markets, Gold Indicator equips you with powerful insights and help you trade smarter, not harder. Built on the proven synergy of three advanced indicators, Gold Indicator focuses exclusively on medium and long-term trends eli
MetaBands M4
Vahidreza Heidar Gholami
3.5 (6)
MetaBandsは、強力でユニークなアルゴリズムを使用してチャンネルを描画し、トレンドを検出して、トレーダーに取引の入出ポイントを提供することができます。チャンネル指標に加えて、強力なトレンド指標でもあります。入力パラメータを使用して新しいチャンネルを作成するために、異なるタイプのチャンネルを統合することができます。MetaBandsは、市場のイベントについてユーザーに通知するために、すべてのタイプのアラートを使用します。 特徴 ほとんどのチャンネルアルゴリズムをサポート 強力なトレンド検出アルゴリズム 異なるタイプのチャンネルを統合する能力 マルチタイムフレームおよびマルチカレンシー(シグナルマトリックス) すべてのタイプのアラート機能(サウンド、画面フラッシャー、プッシュ通知、メール、ポップアップ、矢印) 再描画しない トレンド検出 MetaBandsは、チャネル内を振動する青いラインを使用してトレンドを検出します。ラインがチャネルの上部バンドに達すると、下降トレンドの開始を示し、下部バンドに達すると上昇トレンドの開始を示します。青いラインが中心ラインに近づくと、市場はコンソリ
M30/H1/H4スイング版もあります M5/M15では取りきれない大きな波を狙いたい方へ。 Gold Signal Swing Pro(M30/H1/H4対応)を販売中。 1トレードで$20〜$80+の値幅を狙う。 https://www.mql5.com/en/market/product/177643 KURAMA GOLD SIGNAL PRO(MT4版)— 7層フィルター・自動TP/SL・品質スコア搭載 XAUUSD完全トレードシステム リペイントなし。リドローなし。ラグなし。すべてのサインは確定後に変わりません。見たままが結果です。 特典:買い切りライセンスをご購入いただいた方に、AI Zone Radar($59相当)+PDFマニュアルを無料プレゼント。購入後にMQL5でメッセージをお送りください。 AI Zone Radar: https://www.mql5.com/en/market/product/175834 トレーダーから信頼されています:ゴールドトレーダーのコミュニ
Current event:  https://c.mql5.com/1/326/A2SR2025_NoMusic.gif A. A2SR とは何ですか ?   * 先行テクニカル指標です (塗り直しなし、ラグなし)。 -- ガイダンス : -- https://www.mql5.com/en/blogs/post/734748/page4#comment_16532516 -- そして https://www.mql5.com/en/users/yohana/blog A2SR には、サポート (需要) とレジスタンス (供給) のレベルを決定する特別な手法があります。 ネットで見かける通常の方法とは異なり、A2SR は実際の SR レベルを決定する独自のコンセプトを持っています。 元の手法はインターネットから取得されたものではなく、インターネット上で公開されたこともありません。 A2SR は、取引スタイルに応じて SR レベルを自動選択します。 時間枠を変更しても、SR レベルはその位置にとどまります。 実際のSRは、使用する時間枠から取得されるわけではないため. A2SR
BTMM State Engine Pro is a MetaTrader 4 indicator for traders who use the Beat The Market Maker approach: Asian session context, kill zone timing, level progression, peak formation detection, and a multi-pair scanner from a single chart. It combines cycle state logic with a built-in scanner dashboard so you do not need the same tool on many charts at once. What it does Draws the Asian session range; session times can follow broker server offset or be set in inputs. Tracks level progression (L
Price & Time Market Structure Indicator A professional market structure tool that analyzes waves through both price and time — not price alone. Main Description NeoWave PRO is a professional market structure indicator for MetaTrader 4 designed for traders who want to move beyond traditional one-dimensional wave tools such as ZigZag, swing indicators, and basic high/low systems. Most wave indicators analyze only one thing: Price. But a real market wave is not only a price movement. A true wave de
Quant Direction
Georgios Kalomoiropoulos
Quant Direction は、3次元の市場分析ツールです。完全に客観的なアルゴリズムベースの市場分析を提供し、様々なパラメータにわたる正確なパーセンテージ偏差を同時に算出します。高度なAI搭載モデリングツールで開発され、厳密なテストを経て開発されたこのアルゴリズムは、かつてない精度で市場を分析するように設計されています。プラットフォーム上では、あらゆる通貨ペアや金融商品を分析できます。 短期取引、デイトレード、スイングトレードなど、どのような取引スタイルに も、Quant Directionは最適な選択肢です。 オペレーターの本当の利点 Quant Directionの真の利点は、感情、眼精疲労、過剰分析を完全に排除できる点にあります。方向性を探るために何十ものチャートを手作業で精査したり、自分の好みを常に疑ったりする必要がなくなります。このシステムは、8つの時間間隔(5ヶ月から月単位まで)をミリ秒単位で処理します。あらゆる瞬間に市場を支配している主体を正確に明らかにし、常に成功確率が最も高い方向で取引できるようにします。 市場分析の3つの側面 このアルゴリズムは市場を3つの
MonsterDash Harmonic Indicator is a harmonic pattern dashboard. It recognizes all major patterns. MonsterDash is a dashboard that displays all detected patterns for all symbols and (almost) all timeframes in sortable and scrollable format. Users can add their own user defined patterns . MonsterDash can open and update charts with the pattern found. Settings MonsterDash's default settings are good enough most of the time. Feel free to fine tune them to your needs. The color settings are for thos
NAM Order Blocks
NAM TECH GROUP, CORP.
3.67 (3)
MT4マルチタイムフレームオーダーブロック検出インジケーター。 特徴 -チャートコントロールパネルで完全にカスタマイズ可能で、完全な相互作用を提供します。 -必要な場所でコントロールパネルを表示および非表示にします。 -複数の時間枠でOBを検出します。 -表示するOBの数量を選択します。 -さまざまなOBユーザーインターフェイス。 -OBのさまざまなフィルター。 -OB近接アラート。 -ADRの高線と低線。 -通知サービス(画面アラート|プッシュ通知)。 概要 注文ブロックは、金融機関や銀行からの注文収集を示す市場行動です。著名な金融機関と中央銀行が外国為替市場を牽引しています。したがって、トレーダーは市場で何をしているのかを知る必要があります。市場が注文ブロックを構築するとき、それは投資決定のほとんどが行われる範囲のように動きます。 注文の構築が完了すると、市場は上向きと下向きの両方に向かって急激に動きます。注文ブロック取引戦略の重要な用語は、機関投資家が行っていることを含むことです。それらは主要な価格ドライバーであるため、機関投資家の取引を含むあらゆる戦
Apollo SR Master は、サポート/レジスタンスゾーンを利用した取引をより容易かつ確実にする特別な機能を備えたサポート/レジスタンスインジケーターです。このインジケーターは、ローカル価格の高値と安値を検出することで、タイムラグなしでリアルタイムにサポート/レジスタンスゾーンを計算します。そして、新たに形成されたSRゾーンを確認するために、インジケーターは特別なシグナルを表示します。このシグナルは、SRゾーンを実際の売りまたは買いシグナルとして考慮して使用できることを示します。この場合、SRゾーンの強度が高まり、SRエリアからの取引が成功する確率も高まります。これがこのインジケーターの基本的な考え方です。 SRゾーンは、ストップロスとテイクプロフィットの設定を容易にします。シグナルの方向に応じて、SRゾーンの上または下のスペースをストップロスとして設定できます。さらに、反対側のSRゾーンは、潜在的なテイクプロフィットエリアとして設定できます。 また、Apollo SRマスターインジケーターをご利用のすべてのユーザーには、「Apollo Price Action System」
PowerBall Signals は、サポート/レジスタンス ゾーンを使用するという考えに基づいた買い/売りシグナル インジケーターです。このインジケーターはサポート/レジスタンスゾーンに基づいて特別な反転パターンを検出し、これらのシグナルをチャート上に提供します。このインジケーターの主なアイデアは、MTF (マルチ タイム フレーム) 分析を使用し、現在および次に高いタイム フレームのレベルに基づいてシグナルを提供することです。この方法により、通貨、金属、指数、さらには仮想通貨など、あらゆる市場で起こり得る価格逆転を予測することができます。 反転シグナルに加えて、インジケーターは取引中にトレンドに留まることができるトレンド継続シグナルも提供します。このインジケーターは外国為替トレーダーとバイナリー オプション トレーダーの両方に役立ちます。インジケーターを NON-MTF モードで使用するか MTF モードで使用するかを選択できます。信号生成のためにデータを取得するソース時間枠を選択することもできます。 取引のヒントと素晴らしいボーナスを入手するには、購入後にご連絡ください。 幸せ
Auto Optimized Parabolic RSI: 高度な3Dモメンタムエンジン ほとんどのリテール向けインジケーターは、市場のボラティリティが変化した瞬間に破綻する静的な入力値に依存しているため、失敗に終わります。Auto Optimized Parabolic RSIは、自らの数学的優位性を継続的に再計算することで「インジケーターの陳腐化」問題を解決し、機関投資家レベルの定量的適応力をMT5ターミナルに直接もたらします。 最大の強み: カスタムインメモリ3D最適化   標準的な自動最適化ツールは、インジケーターの呼び出しで端末に過負荷をかけるため、頻繁にMT5プラットフォームをフリーズさせます。本ツールは、このボトルネックを完全に回避しています。RAMベースのカスタムネイティブ計算機を内蔵した内部エンジンは、チャートを読み込んだりタイムフレームを変更したりするたびに、超高速の3Dグリッド探索を実行します。RSI期間(頻度)、SARステップ(加速度)、SAR最大値(制限速度)を同時にスイープし、プラットフォームを遅延させることなく、数万通りものパラメーターの組み合わせを絶対的
ゴールドラッシュ・トレンド・アロー・シグナル ゴールドラッシュ・トレンド・アロー・シグナル 指標は、XAU/USDにおける高速・短期スキャルパー向けに最適化された、正確でリアルタイムのトレンド分析を提供します。 1分足専用に設計されたこのツールは、明確なエントリーポイントを示す方向矢印を表示し、スキャルパーが変動の激しい市場状況でも自信を持って取引できるよう支援します。 この指標は、PRIMARY(主要)とSECONDARY(補助)のアラート矢印で構成されています。PRIMARYシグナルは、トレンドの方向転換を示す白と黒の方向矢印であり、SECONDARYシグナルは、PRIMARY矢印が示す方向を確認し、潜在的なエントリーポイントを示す青と赤の矢印です。 注意:トレンド方向の変化後にPRIMARYアラート矢印が1つだけ表示される場合、複数のSECONDARY青/赤矢印が表示される点に注意が必要です。SECONDARYシグナルは、シグナル基準を満たす任意のローソク足後に表示されます。したがって、長期的なトレンド移動の場合、画面に多くのSECONDARY矢印が表示されます(添付の
123パターン は、最も人気のある強力で柔軟なチャートパターンの1つです。このパターンは、3つの価格ポイントで構成されています。ボトム、ピークまたはバレー、および38.2%〜71.8%のフィボナッチリトレースメントです。パターンは、価格が最後のピークまたは谷、インディケーターが矢印をプロットし、アラートを上昇させ、取引を行うことができる瞬間を超えたときに有効と見なされます。 [ インストールガイド | 更新ガイド | トラブルシューティング | よくある質問 | すべての製品 ] クリアな取引シグナル カスタマイズ可能な色とサイズ パフォーマンス統計を実装します カスタマイズ可能なフィボナッチリトレースメントレベル 適切なストップロスおよび利益レベルを表示します インジケーターを使用して、継続パターンまたは反転パターンを見つけることができます 再描画および非再描画ではありません 電子メール/音声/視覚アラートを実装します 123パターン は、継続パターンまたは反転パターンとして現れます。物事を簡単にするために、このインジケーターを使用して、検索するパターンのタイプを選択できるため
Send us a message after your purchase to receive more information on how to get your  BONUS  for FREE  that works in great combination with Bull vs Bear ! Bull versus Bear is an easy-to-use Forex indicator that gives traders clear and accurate signals based on clear trend retests . Forget about lagging indicators or staring at charts for hours because  Bull vs Bear provides real-time entries with no lag and no repaint, so you can trade with confidence. Bull vs Bear  helps you enter trades during
作者のその他のプロダクト
Индикатор MQLTA Supertrend Multi Timeframe сочетает в себе значения Supertrend, найденные на нескольких таймфреймах, чтобы подтвердить тренд пары. Для работы утилиты необходим бесплатный индикатор MQLTA Supertrend Line - https://www.mql5.com/en/market/product/25951. Как он работает? Индикатор проверяет состояние Supertrend на всех выбранных таймфреймах и отображает результат в виде легко читаемой таблицы. Как торговать с помощью индикатора Supertrend Multi Timeframe Покупку следует совершать,
FREE
MQLTA One Click Trade Pro
MQL4 Trading Automation
4.6 (10)
One Click Trade Pro is a tool that allows you to open orders with just one click, choosing all the parameters, including the Magic Number! Useful if you want to quickly submit trades specifying also their Magic Number. Other than submitting new orders you can also see the list of orders (with their Magic Number) and change their Stop Loss and Take Profit. The PRO version also allows you to: Open opposite pending orders Setup and submit orders using lines, for a better visualization How does it
FREE
MQLTA Support Resistance Lines is an indicator that calculates the historical levels of Support and Resistance and display them as Lines on chart. It will also Alert you if the price is in a Safe or Dangerous zone to trade and show you the distance to the next level. The indicator is ideal to be used in other Expert Advisor through the iCustom function. This indicator can be tested LIVE on AUDNZD with the following DEMO https://www.mql5.com/en/market/product/26572 How does it work? The indicato
FREE
Pattern Detector can detect the most common 1, 2 and 3 candlestick patterns and send notifications when detected. Demo version working on AUDNZD can be found https://www.mql5.com/en/market/product/29189 How does it work Add the indicator to the chart you want to analyze and select which patterns to detect, the indicator will draw the detected patterns. You can also be notified via alert, app and email when a new pattern is detected. Parameters Indicator Name - Used to draw the graphical object
FREE
MQLTA Price Line Alert
MQL4 Trading Automation
4.67 (3)
The Price Line Alert Indicator will allow you to set price level that will alert you when hit, the price level will be shown in the chart as lines. Useful to get notified at specific prices, support, resistance, round numbers and so forth. If you want to a similar utility that will automatically close your position at a specific price check https://www.mql5.com/en/market/product/23113 How does it work? You can set several Price Lines and configured them to notify you if the price goes above or
FREE
Currency Strength Matrix (CSM) is an indicator that will show you the current strength of the major currencies in several timeframes, allowing you to sort the currencies for strength and spot possible trading setups. This indicator is ideal for scalping and in all those events of sudden big moves. How does it work? The CSM compares the value of the current moving average with the same moving average in the previous candle for all the 28 pairs and all 9 timeframes, producing a Matrix of Strength
FREE
MQLTA Supertrend Line
MQL4 Trading Automation
5 (3)
The Supertrend Line indicator shows you the trend using calculation based on the ATR. How does it work? The Supertrend draws a line following the current trend, this line is the result of calculation made with the ATR. A Line under the candle means a likely bullish trend A Line above the candle means a likely bearish trend How to trade with CSL indicator Buy when the Supertrend line is below the price, Sell when the Supertrend line is above the price. It is strongly suggested to use this indic
FREE
MQLTA Candle Timer
MQL4 Trading Automation
5 (1)
MQLTA Candle Timer is an indicator that can show you the details about a symbol/pair and alert you before the close of a candle. Used in swing trading and not only, it can help your strategies knowing and be ready before the close of a candle. How does it work Simply add the indicator to the chart and set the notifications options. You can load a minimalistic interface or a full interface. The alert will be sent once per candle. Parameters All the parameters, that you can see in the picture, a
FREE
The Supertrend Trailing Stop will trail the Stop Loss price of your selected orders following the Supertrend Line, so you don't have to worry about having to change it manually. MQLTA Supertrend Trailing Stop requires you to install the FREE Indicator Supertrend Line https://www.mql5.com/en/market/product/25951 How does it work? The Expert Advisor sets and moves the Stop Loss price of the selected orders following the value of the Supertrend Line. You can filter the Orders by Symbol Comment Mag
FREE
MQLTA Draw Grid
MQL4 Trading Automation
5 (3)
Простая утилита MQLTA Draw Grid поможет вам нарисовать сетку на вашем графике. Она полезна при изучении графика и моделирования сетки. Как она работает? Утилита будет создавать горизонтальные линии в зависимости от заданных параметров Как использовать этот инструмент Установите индикатор на график, выбрав параметры по умолчанию. Выберите начальную точку, значения минимума и максимума диапазона и стиль. В появившейся графической панели вы сможете создавать и удалять сетку, а также изменять неко
FREE
MQLTA Auto Close
MQL4 Trading Automation
5 (4)
Auto Close is an expert advisor that can assist you with your money and risk management rules. The EA can monitor your Balance, Equity, Margin, Global Profit and Global Loss and alert you in case any of these reaches a specified threshold. Free version with limited features can be found https://www.mql5.com/en/market/product/29179 How does it work Load the Auto Close EA in the chart and set the parameters you want to keep monitored. If any of the risk management parameters is met you can be not
FREE
The Parabolic SAR Trailing Stop will trail the Stop Loss price of your selected orders following the PSAR indicator, so you don't have to worry about having to change it manually. How does it work? The Expert Advisor sets and moves the Stop Loss price of the selected orders following the value of the PSAR Indicator. You can filter the Orders by Symbol Comment Magic Number Buy/Sell Parameters PSAR Step - The Step of the PSAR PSAR Max Step - The Max Step of the PSAR PSAR Shift - The Shift of the
FREE
Bollinger Bands Breakout Alert is a simple indicator that can notify you when the price breaks out of the Bollinger Bands. You just need to set the parameters of the Bollinger Bands and how you want to be notified. Parameters: Indicator Name - is used for reference to know where the notifications are from Bands Period - is the period to use to calculate the Bollinger Bands Bands Shift - is the shift to use to calculate the Bollinger Bands Bands Deviation - is the deviation to use to calculate t
FREE
Pattern Detector can detect the most common 1, 2 and 3 candlestick patterns and send notifications when detected. The DEMO version only works on AUDNZD pair. Full product can be found https://www.mql5.com/en/market/product/29190 How does it work Add the indicator to the chart you want to analyze and select which patterns to detect, the indicator will draw the detected patterns. You can also be notified via alert, app and email when a new pattern is detected. Parameters Indicator Name - Used to
FREE
MQLTA Support Resistance Lines is an indicator that calculates the historical levels of Support and Resistance and display them as Lines on chart. It will also Alert you if the price is in a Safe or Dangerous zone to trade and show you the distance to the next level. The indicator is ideal to be used in other Expert Advisor through the iCustom function. This DEMO only works with AUDNZD, the full product can be found at https://www.mql5.com/en/market/product/26328 How does it work? The indicator
FREE
MQLTA Show Magic Numbers
MQL4 Trading Automation
4.14 (7)
The panel displays the list of all orders (market and pending) along with their details, including magic numbers and commentaries. The panel can be moved around the chart. For market orders, the profit listed includes the associated commission and swaps. There aren't any important input parameters, but you can control the panel's initial location via them.
FREE
MQLTA Take Screenshot
MQL4 Trading Automation
4.67 (3)
Утилита MQLTA Take Screenshot позволяет снимать скриншоты текущего графика прямо из самого графика. Утилита полезна для быстрого сохранения интересной ситуации и сохранения текущего графика перед открытием или закрытием ордера. Как она работает? Take Screenshot использует встроенную функцию языка MQL4 для сохранения снимка текущего графика. Как использовать утилиту Загрузите индикатор и выберите нужные параметры. Как только откроется панель, нажмите на значок сохранения, чтобы сделать снимок т
FREE
Auto Close is an expert advisor that can assist you with your money and risk management rules. The EA can monitor your Balance, Equity, Margin, Global Profit and Global Loss and alert you in case any of these reaches a specified threshold. This Demo Version has Notification and Close features disabled, full version can be found https://www.mql5.com/en/market/product/29141 How does it work? Load the Auto Close EA in the chart and set the parameters you want to keep monitored. If any of the risk
FREE
Currency Strength Matrix (CSM) is an indicator that will show you the current strength of the major currencies in several timeframes allowing you to sort the currencies for strength and spot possible trading setups. This indicator is ideal for scalping and in all those events of sudden big moves. This DEMO only shows 4 currencies and 4 timeframes, for the full version please check https://www.mql5.com/en/market/product/24252 How does it work? The CSM compares the value of the current moving ave
FREE
MQLTA Instrument Details shows you in an easy to read in chart table the details about the instrument/Symbol, including: Label Trade Mode Default Contract Size Minimum Size Maximum Size Size Step Digits Used Tick Size Tick Value Stop Level Bid Ask Spread Parameters Indicator name to create the objects Default Window when opening the indicator Horizontal offset Vertical offset If you like this tool please take a minute to leave a review. If you have suggestions to improve it please send me a mes
FREE
Советник Time Line Auto Close (TLAC) позволит вам создавать вертикальные линии (Time Lines, линии времени), которые будут автоматически закрывать все или некоторые из ваших открытых ордеров. Вы можете создавать и управлять несколькими линиями, настроить для каждой из них закрываемые ордера и оповещения. Ордера можно фильтровать по валюте, магическому номеру, номеру ордера и типу ордера. Также можно настроить отправку уведомлений перед активацией линий. Как она работает? С помощью TLAC вы сможет
FREE
フィルタ:
dplessjf
49
dplessjf 2024.06.06 20:23 
 

I love it!

Masoud Seydeshaghi
872
Masoud Seydeshaghi 2023.10.18 14:21 
 

top Hello buddy I like the indicator might you add silver oil gold to it also please

Tradercc
34
Tradercc 2023.06.20 06:29 
 

ユーザーは評価に対して何もコメントを残しませんでした

Wah Lai So
137
Wah Lai So 2022.05.12 17:56 
 

Hoping that you can add a function to your great indicator which is...... just 2 clicks on currency button to change the currency pair chart!

dedy22
14
dedy22 2021.12.01 02:35 
 

it`s a great indicator

HomayounT
343
HomayounT 2021.08.19 08:31 
 

Excellent indicator and reliable. Thanks to Author!

baskalapana
87
baskalapana 2021.02.17 17:06 
 

Great Indicator!!!, I cant thank you enough for this.. cheers

김상훈
30
김상훈 2019.11.12 02:48 
 

I purchased an indicator. However, GBPAUD 2019 is going to BACKTEST, but 8 and 28 currency pair data is not automatically down. What should I do?

shuanger0602
134
shuanger0602 2019.04.23 13:59 
 

很棒的指标,在作者的帮助下我已经做成了EA,感谢作者的分享

Dan B
53
Dan B 2019.03.18 22:18 
 

This is one of the best indicators i use.

maleke1
904
maleke1 2018.06.23 01:12 
 

This indicator was developed well and does the job. Doubled my account in a short period. Kudoz!!

レビューに返信