DronovFlux

DRONOV FLUX

Multi-Timeframe Adaptive Channel Indicator for MetaTrader 5

DRONOV FLUX is an advanced technical indicator designed to analyze dynamic price channels, identify changes in market structure, and highlight potential market reversal opportunities.

Unlike traditional indicators that rely on individual oscillator signals or standard moving average crossovers, DRONOV FLUX analyzes the interaction between price channels across multiple timeframes simultaneously.

The core methodology is based on Dynamic Channel Leadership — identifying which channel currently dominates price movement and detecting when its direction begins to change.

The indicator highlights potential BUY and SELL entry points with neon visual effects and provides two reference zones for potential trade exits.

Key Features

  • Multi-Timeframe Channel Analysis — simultaneous analysis of H4, H1, M30, M15, and M5 price channels.

  • Dynamic Channel Detection — visualization of evolving channel boundaries, directions, and interactions.

  • Adaptive Leader Identification — identification of the leading M5 or M15 channel during extended price movements.

  • Channel Crossover Signals — detection of potential reversals through directional channel crossovers.

  • H4 Pocket Detection — identification of extreme price movements beyond the outer H4 channel boundaries.

  • Neon Entry Signals — visually highlighted BUY ENTRY and SELL ENTRY points with colored glow effects.

  • Dual Exit Zones — two potential exit reference levels based on the opposite boundaries of the M30 and H1 channels.

  • Profit Protection Concept — the first exit zone can be used as a reference for manually activating a Profit Lock strategy.

How DRONOV FLUX Works

1. Multi-Timeframe Market Analysis

The indicator analyzes five timeframes:

  • H4 — Main Channel: Defines the broader market structure and extreme price boundaries.

  • H1 — Higher Working Channel: Provides additional market context and identifies the second potential exit zone.

  • M30 — Intermediate Channel: Visualizes developing market movements and identifies the first potential exit zone.

  • M15 — Fast Channel: Participates in leadership changes and potential reversal signal formation.

  • M5 — Fastest Channel: Helps detect early directional changes in price and channel dynamics.

All channels are displayed using distinctive neon colors for easy visual identification.

2. H4 Pocket — Extreme Price Zones

A potential trading setup begins when price moves beyond the outer boundary of the H4 channel.

SELL setup: Price extends above the upper H4 boundary.

BUY setup: Price extends below the lower H4 boundary.

This extended area is called the Pocket.

Entering the Pocket does not automatically generate a trading signal. It activates the monitoring of lower-timeframe channel interactions.

3. Dynamic Channel Leadership

Within the Pocket, the indicator monitors the relative positions and directions of the working channels.

The primary leadership candidates are M5 and M15.

The leading channel is identified by its extreme position relative to the other channels and the outer H4 boundary.

As market conditions change, leadership may shift between M5 and M15.

However, a leadership transition alone does not constitute a valid entry signal.

A qualifying signal requires a directional turn of the current leader followed by a corresponding channel crossover.

SELL Signal — Potential Bearish Reversal

A potential SELL signal is identified through the following sequence:

  1. Price moves above the upper H4 boundary.

  2. The working channels involved in the setup are positioned above the H4 outer boundary.

  3. M5 or M15 becomes the leading channel.

  4. The leading channel begins to curve downward.

  5. The leader crosses another working channel from above to below.

  6. A SELL ENTRY signal appears at the crossover point, highlighted by a red neon glow.

If another channel crosses a nearly horizontal leader from below to above, the event is treated as a potential leadership transition rather than an immediate SELL signal.

The indicator continues monitoring the new leader for a qualifying downward reversal.

BUY Signal — Potential Bullish Reversal

A potential BUY signal follows the opposite sequence:

  1. Price moves below the lower H4 boundary.

  2. The working channels involved in the setup are positioned below the H4 outer boundary.

  3. M5 or M15 becomes the leading channel.

  4. The leading channel begins to curve upward.

  5. The leader crosses another working channel from below to above.

  6. A BUY ENTRY signal appears at the crossover point, highlighted by a green neon glow.

Dual Exit Zones — Potential Trade Exit Areas

DRONOV FLUX provides two reference zones for evaluating and managing potential trading opportunities.

These zones are based on the dynamic boundaries of the M30 and H1 channels.

EXIT ZONE 1 — First Potential Exit (M30)

The first target is the opposite side of the 30-minute channel relative to the entry direction.

For BUY: The upper M30 channel boundary.

For SELL: The lower M30 channel boundary.

When price reaches this zone, traders may consider taking partial profits or activating a Profit Lock strategy.

A suggested approach is to manually move the protective stop into profitable territory after price touches the opposite M30 boundary, provided the trade has accumulated sufficient profit.

This may help protect part of the unrealized gains while allowing the remaining position to benefit from a possible continuation of the move.

EXIT ZONE 2 — Second Potential Exit (H1)

The second reference target is the opposite boundary of the hourly H1 channel.

For BUY: The upper H1 channel boundary.

For SELL: The lower H1 channel boundary.

If price continues moving favorably, traders may consider holding the remaining position toward this zone.

A protective stop established after reaching M30 may help limit the loss of previously accumulated profits.

Since channel boundaries are dynamic, the distance and order in which these zones are reached may change with market conditions.

Important: EXIT ZONE 1 and EXIT ZONE 2 are analytical reference levels, not guaranteed price targets. The indicator does not automatically place Stop Loss, Take Profit, or Profit Lock orders.

Trading Philosophy

Financial markets are constantly evolving.

Lower-timeframe movements gradually influence higher-timeframe structures, while changes in channel direction and leadership may reveal developing shifts in market momentum.

DRONOV FLUX combines extreme price movement analysis, dynamic channel leadership, and multi-timeframe channel interactions into a unified visual system.

Its primary purpose is to help traders identify potential changes in market direction, recognize entry opportunities, and evaluate possible exit areas.

Who Is DRONOV FLUX For?

DRONOV FLUX is designed for traders interested in:

  • Multi-timeframe technical analysis.

  • Channel-based trading methodologies.

  • Potential market reversal identification.

  • Dynamic support and resistance structures.

  • Visual confirmation of trading opportunities.

  • Manual trade management and profit protection.

Important Information

DRONOV FLUX is a technical analysis indicator, not an automated trading robot.

The indicator provides visual trading signals and potential exit reference levels. It does not independently open, manage, or close trading positions.

All trading decisions, position sizing, risk management, Profit Lock activation, and trade execution remain the responsibility of the trader.

Trading financial markets involves risk. No indicator can guarantee accurate signals or profitable results. Historical performance does not guarantee future outcomes.

DRONOV FLUX

Don't predict the market. Follow its flow.

🔥 Source Code Available for Purchase!

💻 Perfect for those who want to explore, customize, and further develop the trading algorithm.

📩 Interested? Send me a private message for more details!

P.S. The source code is for sale, but the secret to becoming a millionaire is still under development. 😎

おすすめのプロダクト
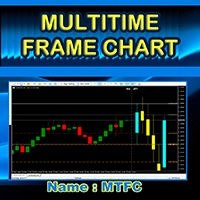
MTFC (Multi Timeframe Chart) – See 2 Timeframes on ONE Chart! "Trade Smarter, Not Harder – Eliminate Timeframe Switching Forever!" Imagine having the power to see any higher timeframe (M5, M15, H1, H4, D1, MN1, etc.) directly on your current chart.   No more flipping between charts, no more guesswork—just   pure trading clarity   in one place. That’s exactly what the   MTFC Indicator   delivers! 1. The Problem It Solves As traders, we know   context is king . But constantly switching between c
QuantumLogic AI
Silvano Cesar Silva Vieira
QuantumLogic AI QuantumLogic AIは、機関投資家レベルのアルゴリズム取引向けに設計された高度なExpert Advisorです。超高速の非同期ブロック決済システム(バスケット)と組み合わせた動的コスト平均法(グリッド)を利用します。 戦略の概要 EAは移動平均線を使用して市場の方向性をフィルタリングし、計算されたグリッド注文を実行します。QuantumLogic AIは厳密な時間枠内で動作し、独自の「オーバータイム」アルゴリズムを使用して、セッション終了時に取引を安全に管理および決済します。 主な機能と革新 トリプルセッション時間管理: 1日を3つの独立した期間に分割します。 オーバータイムトレーリングテクノロジー: セッション終了時に未決済注文が残っている場合、そのサイクルで達成された最大利益のカスタマイズ可能な割合を保護します。 内蔵ニュースフィルター: 影響の大きいUSDニュース(3つ星)をカレンダーでスキャンし、エントリーを一時停止して強制決済します。 非同期決済エンジン: 数十の注文をミリ秒単位で決済し、スリッページを削減します。 マルチレベル
Eye of Horus — an indicator for confirmed reversals for MetaTrader 5 Eye of Horus — this indicator identifies confirmed price reversals. It draws a coloured line connecting confirmed price movements. How it works The indicator tracks a potential high or low. It then waits for a price movement of at least the Signal Distance (Points). The reversal must be confirmed within the Confirmation Window (Bars) of closed candles following the specified price movement and time period. If the time windo
FiveStarFX Gold Reversal Edge Professional automated trading solution designed for structured execution and controlled risk management in the Gold market. Built for traders who value discipline, precision, and consistency. Key Features Fully automated trading One trade at a time (controlled exposure) Fixed Stop Loss and Take Profit Smart Break-Even protection Profit lock with buffer Step-based trailing management Spread protection system Works on any broker Trade Management The E
FREE
Limitless MT5 is a universal indicator suitable for every beginner and experienced trader. works on all currency pairs, cryptocurrencies, raw stocks Limitless MT5 - already configured and does not require additional configuration And now the main thing Why Limitless MT5? 1 complete lack of redrawing 2 two years of testing by the best specialists in trading 3 the accuracy of correct signals exceeds 80% 4 performed well in trading during news releases Trading rules 1 buy signal - the ap
RBM EA Deluxe
Renato Brendim Medici
An XAUUSD-focused robot that only enters when several market conditions line up at once: trend, volume, price structure and session. It shows you exactly what it’s analyzing on the chart, and why it decided to trade or wait. Most gold robots you’ll find out there run on something simple: a moving average cross, or a channel breakout, and that’s it. The problem is gold doesn’t trade that way. It sweeps liquidity, traps early entries, and usually only moves for real after shaking everyone out fir
Purpose DG Trend+Signs is an indicator that paints candles with trend colors and clearly shows consolidations, using both DoGMA Trend and DoGMA Channel indicators. It was created to help users in their trades, showing trends, consolidations and marking entry and exit points. The indicator also takes consolidations in consideration to identify breakouts. Key features Designed to be simple to use, with a few parameters Does NOT repaint Does NOT recalculate Signals on entries Works in ALL pairs Wo
トレンド指標, 市場フロー, モメンタム指標, プライスアクション, FXインジケーター, 売買シグナル, トレンド反転, ボラティリティ, テクニカル分析, MT5インジケーター, スキャルピング, 市場の強さ, 取引シグナル, アルゴリズム取引, 価格チャネル Quantum Pulse Force は、MetaTrader 5 向けに開発されたテクニカル指標であり、価格の動きの加速を分析し、トレンドおよびレンジ(横ばい)局面を識別し、複数の定量フィルターに基づいて重要な市場ポイントを強調します。 従来の方向のみを示す指標とは異なり、本指標は動きの強さとその変化を測定することに重点を置いており、リアルタイムで市場の挙動をより正確に把握することが可能です。 フローパーセンテージ(Flow Percentage) 本指標の中核は、2本の移動平均線の差のパーセンテージ変化です。 この計算により、移動平均間の距離が拡大しているか縮小しているかを判断し、動きの加速または減速を示します。 解釈: 正の値は上方向への加速を示す 負の値は下方向への加速を示す ゼロ付近の値は勢いの低下またはレンジ
RiskGuard PRO – Defesa Inteligente para Traders Sérios no EURJPY M15 O RiskGuard PRO é um Expert Advisor de alto desempenho, projetado exclusivamente para o par EURJPY no timeframe M15 , com foco total em preservação de capital, gestão de risco avançada e execução estratégica de múltiplas abordagens operacionais . Ao contrário dos EAs tradicionais, o RiskGuard PRO foi desenvolvido com tecnologia proprietária e arquitetura inteligente , capaz de operar com segurança mesmo em ambientes de merc
NQX Opening Break Daily BiasはMetaTrader 5用のシグナルインジケーターです:オープニングブレイクのシグナル(日足のバイアス方向にのみシグナルを出します)。 その日のオープニングレンジのブレイクアウトを検出するNQX独自のロジックです。日足のバイアス方向にのみシグナルを出します。推奨エントリー、短いストップ、遠めのターゲット(3:1、5:1、10:1、スイングでは最大20:1)を表示します。判断するのはあなたです。 チャート上に表示されるもの - 確定したシグナル足に矢印を表示します(確定したシグナルがリペイントされることはありません)。 - 推奨エントリー、短いストップ、遠めの推奨ターゲット(デフォルトはリスクの5倍)、さらに3 x 1、5 x 1、10 x 1の参考ライン。 - レベルに到達すると、チャート上にラベル(ターゲットまたはストップ)が表示されます。 - 最新のシグナルと、表示中の履歴に出現したシグナル数を示すパネル。 - 新しいシグナルのポップアップ通知とプッシュ通知(オプション)。 NQX独占ロジック:他のどのNQXインジケーターも
Winning Strategy Pro
Jasim Mohammed Mousa Bahiya
Winning Strategy Pro is a professional Expert Advisor for XAUUSD M5. It uses a unique algorithm combining multiple technical confirmations for high-probability entries with strict risk management. KEY FEATURES: - Smart price level detection - Multiple entry confirmation filters - Flexible Money Management (Fixed or % Risk) - Daily protection (loss/profit limits, max trades) - Trading time filter - Email & Push notifications - Visual trading zones on chart - Real-time info panel PROTECTION: -
BB out arrows
Smaylle Rafael Coelho Mariano
BB Out Arrows   is a powerful and intuitive indicator designed for MetaTrader 5 (MT5) that enhances trading strategies using Bollinger Bands. This indicator signals potential trading opportunities by displaying arrows when a candle closes outside of the Bollinger Bands, but with an added layer of precision through a wick percentage filter. Key Features: Bollinger Bands Integration:   Utilizes the classic Bollinger Bands to identify market volatility and potential price reversals. Arrows Indicati
FREE
After purchasing the product, please contact us at: escritorioremotoiq28@gmail.com or Natanael.playoff@gmail.com. ​Upon contacting us, you will receive an additional indicator (included in the image) along with a detailed guide on how to use it. The files and instructions will be sent directly to your email. **Flow Code: Institutional Liquidity & Amplitude Analyzer** **The Flow Code is the ultimate tool for those who want to trade the real market flow.** Developed for **professional traders*
# Multi-Timeframe Trend Sync Pro (MTTS Pro) ## Synchronize Multiple Timeframes and Trade with Trend Confluence **MTTS Pro** is an advanced technical indicator developed for traders seeking precision in multi-timeframe analysis. By consolidating information from multiple timeframes simultaneously, the indicator identifies points of high confluence where multiple timeframes confirm the same market direction. --- ## MAIN FEATURES ### **Simultaneous Multi-Timeframe Analysis** - Monitor up t
Multiple Timeframe MACD indicator. This indicator was built for making multiple timeframe analysis possible in MT5 using MACD Indicator. MACD Indicator traditionally shows two lines and one histogram. MACD Line(Yellow) is calculated by subtracting 12period EMA(fast) from 26period EMA (slow). Signal Line(Blue) is created by a 9period EMA from MACD Line. Histogram is just the difference between MACD and Signal lines. Histogram is colored based on the difference between its value and the previous h
Neural Bar Impulse is an indicator based on a neural network created and specially trained to predict the potential impulse of each next market bar. By bar impulse we mean the tendency of the market price to update the maximum or minimum of the bar relative to its opening price. We chose this particular feature of market bars because, based on our own research, we discovered an interesting feature of bar impulses to be harbingers of a change in price trend movements. The neural network we cre
BlinkBreakout EA is a professional automated trading system for MetaTrader 5 that trades breakouts of session ranges (London/New York) with dynamic ATR-based risk management. The EA identifies the consolidation range at the start of a user-defined session, then automatically enters when price breaks the High or Low. Every trade uses a hard Stop Loss calculated from current market volatility (ATR), with optional Take Profit, Break-Even, and Trailing Stop functions. Key features: • Session-based
PinPoint Level
Paulo Roberto Jusviak Dambros
Pinpoint Level is the indicator for Day Traders and Scalpers. Developed to deliver precision when entering or exiting trades without the need for manual configuration. Just drag it onto the chart and it will instantly map the most critical price zones for the current session. Ideal for Forex, Indices, and Cryptocurrencies, it automatically calculates the previous day's range and projects exact Fibonacci-based Support and Resistance expansions, keeping your chart clean and your focus on what mat
FREE
Dynamic Trend Visualizer: Momentum and Direction Indicator The Dynamic Trend Visualizer is an advanced flow analysis tool designed to translate the complexity of price movements into a clear and objective visual map. Through an internal trend-tracking algorithm, the indicator continuously scans price action and identifies who is in control of the market — bulls, bears, or indecision. Instead of cluttering your chart with lines and oscillators, it directly colors the candles in real-time, allowin
Descrição Geral O Scalping Pattern 123 WDO & WIN é um robô de alta performance desenvolvido especificamente para operar os contratos futuros mais líquidos da B3: Mini Dólar (WDOFUT) e Mini Índice (WINFUT) . Baseado na clássica e respeitada metodologia de reversão de tendência (Setup 1-2-3), o algoritmo automatiza a leitura de fluxo de preço e correções de curto prazo, eliminando o fator emocional das suas operações. Principais Funcionalidades Operação Multiativo: Projetado com parâmetros otimiza
FREE
HV Models is an Indicator that containes 4 methods for calculating historical volatility of the selected asset. Volatility is one of the fundamental values ​​describing changes in the underlying asset. In statistics, it usualy describes as a standard deviation. The price chart has 4 values ​​(Open High Low Close) when we calculate volatility using a standard indicator, only one of these values ​​is used as a result we get one-sided volatility picture. The presented indicator uses 4 volatility ca
HAWK 4.0 — GOLD SIGNAL INDICATOR The most precise signal indicator  for XAUUSD (Gold) trading. Built on ATR Bands + Pivot detection. Signals appear only at real reversal points. No repaint. No delay. No noise. WHAT YOU GET → Clear BUY / SELL arrows → Auto TP1 / TP2 / TP3 levels → Auto SL level → Built-in time filter (UTC) → Real-time success statistics → Full alert system DESIGNED FOR Symbol:    XAUUSD (Gold) Timeframe: M3 / M5 Ses
Strong Candle Indicates the size of each candlestick with the text value above it and indicates which candlestick has a body larger than the one specified in the parameters in percentage, that is, a strong candlestick (between Size_Min and Size_Max) with at least x% of body. The candlestick size is placed in the buffer and that is the buy or sell indication, where: value > 0 = bullish candle or value < 0 bearish candle, value = 0 means no indication (the candle did not match the desired pattern
HiLo Activator v1.02 by xCalper The HiLo Activator is similar to moving average of previous highs and lows. It is a trend-following indicator used to display market’s direction of movement. The indicator is responsible for entry signals and also helps determine stop-loss levels. The HiLo Activator was first introduced by Robert Krausz in the Feb. 1998 issue of Stocks & Commodities Magazine.
Volume Profile Indicator used by professional Traders at Traders Inside Ltd. If you want to succeed in trading you need to know if current price is cheap, expensive or fair valued. Key features: Fair price (Point of control, POC), high and low price zones (POH, POL) POC in different timeframes for better orientation Symbol and timeframe Chart resize on open positions/orders, VPRmax/min Historic POC - see, how POC has changed the last periods Button to show/hide VPR Calculated Bars (best results)
Golden Ideal Pro
Georgios Kalomoiropoulos
5 (1)
Golden Ideal Pro は、取引の「質」を最優先し、高確率なエントリーを特定する洗練されたアルゴリズムを搭載した最先端のトレーディングシステムです。このエキスパートアドバイザー(EA)は、実際のライブ市場環境で一貫したパフォーマンスを発揮し、低ドローダウンで安定した運用を求めるトレーダー向けに設計されています。資金効率の最大化、リスク分散、そして長期的な安定性を実現するために高度に最適化されたコア戦略エンジンによって稼働します。 ご不明な点がございましたら、いつでもお気軽にお問い合わせください。お客様を最大限にサポートし、すべての疑問を解決するために、私たちはいつでもここにいます。 グリッドなし、マーチンゲールなし、ポジション平均化なし 。すべての取引は   固定の ストップロス(損切り)とテイクプロフィット(利確)   ターゲットによって保護されており、リスクは常に厳格に定義されています。 ここをクリックして  Golden Ideal Pro ガイドを読む なぜ Golden Ideal Pro なのか? 多くの ゴールド  EAはレンジ相場で破綻しがちですが、 バック
Este EA combina a tendência do tempo gráfico principal com mais dois tempos gráficos configuráveis. Os stops são técnicos baseados na técnica dos canais OffRoad. Ao executar otimizações, é interessante buscar as combinações de tempos gráficos que corroboram para um bom resultado para cada ativo e seu comportamento. Estudos apontam para resultados mais assertivos quando os testes são feitos nos últimos meses para operar no próximo. O período do ADX e das bandas de Bollinger também podem variar co
### Overview Professor Prop ist ein vollständig automatisierter Expert Advisor, der für Trader entwickelt wurde, die menschliche Emotionen, Unentschlossenheit und Ermüdung vollständig aus ihrem Handelsalltag verbannen möchten. Ausgestattet mit null manuellem Aufwand steuert dieses System alles autonom – von der Marktanalyse und der Ausführung von Einstiegen bis hin zur präzisen Platzierung von Stop-Loss und Take-Profit. Egal, ob Sie ein persönliches Portfolio verwalten oder strenge Evaluierung
RBreaker Gold Indicatorsは、金先物の短期日内取引戦略であり、トレンドフォローと日内反転の2つの取引手法を組み合わせたものです。トレンド相場での利益を捉えるだけでなく、相場が反転した際には迅速に利確し、その流れに沿ってポジションを反転させることができます。 この戦略は、アメリカの雑誌『Futures Truth』において、15年連続で最も収益性の高い取引戦略トップ10に選ばれた実績を持ち、非常に長いライフサイクルを誇り、現在も国内外で広く使用・研究されています。 本インディケーターは、2026年の金先物の値動きに対応し、14日間のATR指標に基づいて、ブレイクアウト係数A、観察係数B、リバーサル係数Rをより合理的な値で定義しています。非常に優れたインディケーターであり、安定的な年間収益を実現しています。ぜひおすすめします〜
NewYork_SilasFernandes: H1 Entry Killer. Green signal for buy, red for sell – no lag, no repainting. Uses real volume to filter noise, Bollinger Bands to catch perfect reversals. Advantages: enters before the move, exits at the top, works only on H1 but you can test other timeframes. Parameters: VolumeThreshold (adjusts sensitivity, default 50), BollingerPeriod (default 20, default 2 deviations), SignalColorBuy (green), SignalColorSell (red).
このプロダクトを購入した人は以下も購入しています
Boba Analysis Suite
Trade Ready Solutions LLC
5 (2)
Boba Analysis Suite Boba Analysis Suite は、MetaTrader 5 向けの分析インジケーターです。市場構造、重要な価格帯、相場全体の状況を、一つのチャート画面にまとめて表示します。 トレーダーおよびトレーディング指導者としての実務経験をもとに開発され、市場の方向性の評価、重要な価格水準の特定、複数の時間足を組み合わせた分析など、体系的な分析プロセスを支援します。 相場の背景を踏まえた分析 個々のシグナルの意味は、相場の状況によって変わります。Boba Analysis Suite は、現在のチャート状況をより大きな市場構造と関連付け、あらかじめ定めたルールに沿って取引アイデアを検討するための分析を支援します。 主な分析機能: トレンドと市場構造: 市場の方向性と、その背景にある構造を評価します。 重要な価格帯と価格水準: さらに分析すべき重要な領域を視覚的に表示します。 複数の時間足: 異なる時間足の情報を組み合わせ、相場全体の状況を評価します。 視覚的な分析プロセス: 分析情報をチャート上で直接確認できます。 自主的な取引判断を支援 Boba
Sqn Max Indicator Sqn Max is an exclusive indicator to trade the market with high effectiveness. The indicator is based on price action, volatility and trend. This indicator is as simple as possible but not too simple. The indicator can generate alerts to ease the trading process. You don't have to stay all day in front of your screen. The indicator can be used with any class of assets and with any time frame. It is possible to achieve better results trading our list of selected assets. We achi
Azimuth Pro
Ottaviano De Cicco
5 (7)
Azimuth Pro V2:MT5向けシンセティック・フラクタル構造分析と確認済みエントリー 概要 Azimuth Pro は Merkava Labs によるマルチレベルスイング構造インジケーターです。4つのネストされたスイングレイヤー、スイングアンカーVWAP、ABCパターン検出、3タイムフレーム構造フィルタリング、そして確定バーでの確認済みエントリー — 1つのチャートで、ミクロスイングからマクロサイクルまでを網羅するワークフロー。 これはブラインドシグナル製品ではありません。ロケーション、コンテキスト、タイミングを重視するトレーダーのための構造ファーストワークフローです。 ハロウィンプロモーション — 35%オフ 相場が不気味に揺れても、あなたの優位性は鋭いまま。このオファーが霧の中に消える前に、35%オフで手に入れよう。 Azimuth Proが現在259 USD(通常399 USD)。 1. V2での変更点 シンセティック・マルチタイムフレームエンジン 上位タイムフレーム分析をMeridian Proと同じ独自のシンセティックアーキテクチャで一から再構築。より
ARICoin is a powerful trading companion designed to generate high-probability entry signals with dynamic TP/SL/DP levels based on volatility. Built-in performance tracking shows win/loss stats, PP1/PP2 hits, and success rates all updated live. Key Features: Buy/Sell signals with adaptive volatility bands Real-time TP/SL/DP levels based on ATR Built-in MA Filter with optional ATR/StdDev volatility Performance stats panel (Success, Profit/Loss, PP1/PP2) Alerts via popup, sound, push, or email Cust
ScalpPoint is a powerful trading companion designed to generate high-probability entry signals with dynamic TP/SL/DP levels based on volatility. Built-in performance tracking shows win/loss stats, PP1/PP2 hits, and success rates — all updated live. Key Features: Buy/Sell signals with adaptive volatility bands Real-time TP/SL/DP levels based on ATR Built-in MA Filter with optional ATR/StdDev volatility Performance stats panel (Success, Profit/Loss, PP1/PP2) Alerts via popup, sound, push, or emai
Naked Forex Kangaroo Tail Pro Indicator Kangaroo Tail Pro Indicator is a pattern recognition indicator for Forex, Stocks, Indices, Futures, Commodities and Cryptos. The Kangaroo Tail is a multi-bar pattern. The Kangaroo Tail pattern is very effective and is very simple to trade. The strategy that comes with the Kangaroo Tail is based on price action. The indicator does what it was designed for: displaying Kangaroo Tail patterns.     Don't expect to follow the up and down arrows and make mone
AriFocus - Non-Repainting Buy/Sell Signals AriFocus - one clear signal. AriFocus marks buy and sell signals directly on the chart and suggests a stop-loss level for each one. Every signal is confirmed on bar close and never repaints. - Buy/sell arrows, confirmed on bar close - Suggested stop-loss level for every signal - Trend band and candle coloring to show direction at a glance - 10 ready-made presets, or your own settings (14 calculation methods) - Pop-up, push and email alerts with entr
ARIPoint
Temirlan Kdyrkhan
1 (4)
ARIPoint is a powerful trading companion designed to generate high-probability entry signals with dynamic TP/SL/DP levels based on volatility. Built-in performance tracking shows win/loss stats, PP1/PP2 hits, and success rates all updated live. Key Features: Buy/Sell signals with adaptive volatility bands Real-time TP/SL/DP levels based on ATR Built-in MA Filter with optional ATR/StdDev volatility Performance stats panel (Success, Profit/Loss, PP1/PP2) Alerts via popup, sound, push, or email Cu
Zain Gold Scalping
Ahmed Gamal Abdel Nasser Mohamed
A complete price-action analysis tool built around dual independent entry logic, each confirmed against a volatility band, combined with a configurable set of nine optional confirmation filters that let you shape exactly how conservative or aggressive the tool's signals behave. Core Strategy Two independent entry setups, each triggering only when price moves outside a dynamic volatility band — giving two distinct ways to spot potential reversal points, which can be used together or separately.
Orderflow Big Trade 推定デルタヒートマップでローソク足内部の潜在圧力を可視化 通常のローソク足の 内部 で起きている重要なプライスアクションを見落としていませんか? Orderflow Big Trade は、 高度な値幅・終値加重アルゴリズムを用いて、 グループ化された価格帯ごとの買い圧力・売り圧力を推定します。 単なる出来高だけでなく、 価格の動態を明確な「デルタマップ」に変換。 大口(機関投資家)の吸収、 モメンタムの発生、 捕まったトレーダー(Trapped Traders)、 そしてレジスタンスやサポートの受容・拒絶を瞬時に見抜くことができます。 [ 無料デモ版をダウンロード ] 実際のチャートで全機能を今すぐお試しいただけます。設定の調整や視認性を確認し、ご自身のトレード戦略に適合するかご購入前にぜひ体験してください。 主なトレード上の優位性 足内部デルタ推定: ローソク足の値幅と終値位置を解析し、 特定の価格ゾーンにおける「買い vs 売り」の圧力を算出。 終値加重の精密アルゴリズム: 終値に近い価格グループへの推定デルタ加
OrderFlow Absorption – MT5用プロフェッショナル・デルタ&アブソープションシグナルインジケーター OrderFlow Absorptionで本物のオーダーフロー分析の力を解き放ちましょう。MetaTrader 5向けの究極のデルタヒストグラム&アブソープションシグナルインジケーターです。あらゆる価格変動の裏側で何が起きているのかを知りたいトレーダーのために設計されており、市場を動かす隠れた買い/売り圧力や吸収イベントを明らかにします。 特徴 デルタヒストグラムの可視化:   買い圧力・売り圧力を色分けされたヒストグラムで即座に表示。 アブソープションシグナル検出:   高度なロジックで強気・弱気の吸収イベントを特定し、反転の兆しを早期に通知。 チャートマーカー:   吸収シグナルをチャート上に直接マークし、視覚的に分かりやすく表示。 ポップアップアラート:   新しい吸収シグナルが出現した際にリアルタイムで通知。 カスタマイズ可能な閾値:   弱いシグナルを除外し、高確率のセットアップに集中。 リソース管理:   大きなチャートでも高速に動作する効率的な計算。
CGE Trading Suite
Carl Gustav Johan Ekstrom
5 (3)
Institutional-Grade Analytics for MT5 The full analytical edge of a professional trading desk, built into your MT5 chart. A full guided tour walks you through every feature step by step. Standard retail platforms lack the depth required for professional market analysis. The CGE Trading Suite bridges this gap, transforming MetaTrader 5 into a comprehensive workspace. By integrating 18 proprietary modules into a single, unified chart interface, the suite eliminates fragmented analysis. It provide
以下は Chimera Volume の日本語訳です。 MetaTrader 5用 Chimera Volume 高度な出来高分析と市場活動の可視化 Chimera Volumeは、MetaTrader 5向けに設計されたカスタムインジケーターです。正規化された出来高の動きを分析し、動的な視覚的フレームワークを通じて市場参加者の変化をリアルタイムで表示します。 このインジケーターは、適応型正規化アルゴリズムを用いてティック出来高データを処理し、出来高の強さ、蓄積フェーズ、および異なる市場条件下での活動シフトを構造化して表現します。 生の出来高を表示する標準的なインジケーターとは異なり、Chimera Volumeは追加の計算を適用することで、市場活動の相対的な変化を強調し、チャートの視認性を向上させます。 主な機能 ルート・インテント・ヒストグラム (Root Intent Histogram): 正規化された出来高の強さと市場参加度を視覚化する動的ヒストグラムです。適応型カラー・トランジションを採用しており、活動の活発化と参加の減少を明確に区別します。 慣性ライン (Inertia
SMC Sniper Pro MT5 SMC Sniper Pro by QuantFlow Labs is a chart indicator for liquidity-based intraday analysis. It combines session ranges, tracked liquidity sweeps and three selectable entry models in one configurable workspace. It displays setup context and entry references; it does not open, manage or close trades. Three selectable entry models Model 1 - Inverse Fair Value Gap breakout: after an eligible liquidity sweep, the indicator waits for a confirmed close through the relevant fair valu
GEM Signal Pro GEM Signal Pro は、MetaTrader 5 向けのトレンドフォロー型インジケーターです。より明確なシグナル、より整理されたトレードセットアップ、そして実用的なリスク管理をチャート上で確認したいトレーダーのために設計されています。 単純な矢印だけを表示するのではなく、GEM Signal Pro はトレード全体の考え方を、より見やすく分かりやすい形で表示します。条件が確認されると、インジケーターはエントリー価格、ストップロス、利確目標をチャート上に表示し、トレードセットアップをより効率的に確認できるようにします。 動作の仕組み このインジケーターは、まず内部ロジックに基づいて有効なシードシグナルを検出します。 確認条件が満たされると、GEM Signal Pro はチャート上に完全なセットアップを表示します。これにより、トレーダーはトレード構造をより明確に把握し、手作業による分析を減らすことができます。 チャート上のトレードレベル 確認済みシグナルに対して、GEM Signal Pro は以下を表示できます。 エントリー価格 ストップロス テ
VTrende Pro
Andrii Diachenko
5 (1)
VTrende Pro - MTF indicator for trend trading with a display panel for MT5 *** Videos can be translated into any language using subtitles (video language - Russian) Although the signals of the VTrende Pro indicator can be used as signals of a full-fledged trading system, it is recommended to use them in conjunction with the Bill Williams TS. VTrende Pro is an extended version of the VTrende indicator. Difference between Pro version and VTrende: - Time zones - Signal V - signal 1-2 waves -    S
QNC Scalper
Yordiana Enggelina Seko
Here is a professional and engaging description for the Indikator QNC Scalper tool in English, tailored for traders and platforms: Indikator QNC Scalper Unlock precision trading in fast-paced markets with the Indikator QNC Scalper —an advanced technical analysis tool engineered specifically for scalpers and day traders. Whether you are trading forex, crypto, or indices, this indicator cuts through market noise to deliver clear, high-probability entry and exit signals. Key Features Real-Time M
note: this indicator is for METATRADER4, if you want the version for METATRADER5 this is the link:  https://www.mql5.com/it/market/product/108106 TRENDMAESTRO ver 2.5 TRENDMAESTRO recognizes a new TREND from the start, he never makes mistakes. The certainty of identifying a new TREND is priceless. DESCRIPTION TRENDMAESTRO identifies a new TREND in the bud, this indicator examines the volatility, volumes and momentum to identify the moment in which there is an explosion of one or more of these da
OmniSync Projection
Antonio-alin Teculescu
5 (1)
Chronos Fractal Engine is an innovative price projection indicator for MetaTrader 5, designed to transform your technical analysis by intelligently identifying and projecting historical price patterns. Built upon an advanced correlation algorithm and the fractal principles of the market, this powerful tool visualizes potential future price movements, giving you a unique edge in your trading decisions. What is Chronos Fractal Engine? At its core, the Chronos Fractal Engine employs a sophisticat
Title:FX-AIEA Supply and Demand Zone Indicator (MT5) — Technical Overview Version: 2.51 | Platform: MetaTrader 5 Introduction Supply and demand zones are considered a core manifestation of institutional order flow, providing a more direct reflection of buying and selling pressure than traditional support/resistance levels. This indicator attempts to automate the identification of high-probability supply and demand zones using an adaptive ZigZag algorithm, reducing the subjectivity and time asso
ORB Seeker MT5
Marcela Goncalves De Oliveira
数量限定で特別価格!希少性を維持するための特別価格です! たったの599ドル! ご購入後、ボーナスとしてORB Seeker EAと個人最適化セットファイルをお受け取りいただくため、私にご連絡ください。 クリーンなセッションブレイクアウトを自信を持ってキャッチしましょう! ORB Seeker MT5は、正確性、シンプルさ、柔軟性、そして明確なチャート構造を求めるトレーダー向けに開発された、プロ仕様のオープニングレンジブレイクアウト(ORB)インジケーターです。 このシステムは、あらゆる銘柄のプレマーケットまたはカスタムセッションのレンジを自動的にプロットし、エントリー、ストップロス、テイクプロフィット、およびオプションの50%部分TPレベルを含む明確なブレイクアウトシグナルを提供します。すべての計算結果はリアルタイムでチャート上に表示されます。 ロンドンオープン、ニューヨークセッション、アジアセッション、または独自のカスタム市場時間帯で取引できます。ORB Seeker MT5は選択したセッション時間帯に合わせて調整されるため、市場レンジ、ブレイクアウトレベル、トレードレベルの位
Zain Gold ScalpingV5
Ahmed Gamal Abdel Nasser Mohamed
Zain Gold Scalping V5 is a technical analysis indicator for MetaTrader 5 designed for Forex and Gold markets. It provides chart-based market information, trend analysis, signal conditions, and an on-screen dashboard to help traders analyze price movement across multiple timeframes. Main Features The indicator supports multiple timeframes, including M1, M5, M15, M30, H1 and higher timeframes. It can be used with Gold (XAUUSD), Forex currency pairs, indices and other supported instruments. The in
The indicator is designed to close positions on the market in time. For example: to take profits ahead of schedule if the price has not reached TakeProfit, and the market is turning around. The indicator analyzes the momentum, not the trend. He does not give any information about the trend. The indicator is well suited for finding divergence. The Ershov 38 Parrots indicator dynamically adjusts to the market and detects price movement impulses of medium and high amplitude. It almost does not rea
First time on MetaTrader, introducing IQ Star Lines, an original Vedic Astrology Based Intraday Trading Indicator. We don't offer free or bonus indicators in exchange of reviews from you. You won't need any free products with this indicator to make it work. ;) Enjoy! Welcome to the new and updated  IQ Star Lines , the ultimate fusion of ancient planetary cycles and modern quantitative trading, published for the first time on Metatrader. This is an indicator built by the developer, who has spent
AriX
Temirlan Kdyrkhan
1 (4)
AriX Indicator for MT5 A powerful trend-following and signal-evaluation tool AriX is a custom MT5 indicator that combines Moving Averages and ATR-based risk/reward logic to generate clear buy/sell signals. It visualizes dynamic SL/TP levels, evaluates past trade outcomes, and displays win/loss statistics in a clean on-chart panel. Key features include: Buy/Sell signals based on MA crossovers ATR-based SL/TP1/TP2/TP3 levels with visual lines and labels Signal outcome tracking with real-time stat
MERAVITH SCANNERは、MetaTrader 5用のプロフェッショナルな金融市場インジケーターで、複数の分析ツールを一つの統合システムにまとめています。独自の出来高加重平均価格(VWAP)手法を使用してすべての計算を自動で行い、主観的な解釈を完全に排除します。 このインジケーターは、すべての資産クラス(FX、株式、指数、商品、暗号通貨)およびM1から月足までのすべての時間軸で動作します。基本原理は「価格は出来高に従う」というものです。MERAVITHは機関投資家の出来高が集中するポイントを特定し、その集中から数学的に正確な価格レベルを導き出します。予測や投機は行わず、計算のみを行います。 MERAVITH SCANNERを使用すると、28の主要FX通貨ペアをすべての時間軸でわずか2~3分でスキャンできます。また、任意の市場をスキャンすることも可能です。例えば、約100銘柄の株式を約10分でスキャンできます。 インジケーターは、消耗レベル、均衡線、偏差、統計レベル、およびターゲット予測を算出します。 チャート要素 Origin Point :すべての計算が始まる起点です。イン
Boom & Crash & PainX & GainX Ultimate Spike Detector Trade Spikes With Confidence — Not Guesswork Catching spikes should be one of the most profitable strategies in synthetic markets. But for most traders, it becomes one of the most frustrating. You enter too early… price goes against you. You wait for a spike… it never comes. You finally catch one… but don’t know whether to hold or close. You make profit… then give it all back because there’s no exit plan. This is exactly the problem the Ultim
一言でいうと このインジケーターは RSI と MACD という2人の専門家を1つにまとめたもの です。2つのチャートを別々に見て判断する代わりに、両方が同意したときだけ「買い」または「売り」の矢印を表示します。 矢印は再描画されません 。一度出現すれば、そのまま固定されます。 「コンボ」の意味 通常、トレーダーは RSI(値動きの勢い)と MACD(トレンドの方向)を別々に見ます。しかし両者が矛盾することも多いです。 このインジケーターでは、 両方が同時に同意したときのみシグナル を出します。これにより、多くの偽シグナルが排除されます。 画面で見えるもの 価格チャートとは別のインジケーターウィンドウ 青と赤の矢印 —— そのまま使えるシグナル 拡大表示された MACD ヒストグラム(見やすく強調されている) RSI と MACD のラインも表示されるが、注目すべきは矢印 こんな人におすすめ 初心者 —— 2つのインジケーターを別々に解釈し、矛盾に対処する必要がない 経験者 —— シグナルの高速フィルタリングと、再描画しないクリアなロジック 迷いたくない人 —— 「買い」「売り」「待て
MERAVITH は MetaTrader 5 向けのマルチタイムフレームの出来高・流動性インジケーターで、すべての時間足でトレンド、サポートとレジスタンスのゾーン、エントリー、ターゲット、ストップロスを表示します。市場の完全な流動性マップ、ヘッジファンド流の流動性ツールを提供し、独自の出来高加重平均価格の手法ですべての計算を自動で行うため、主観的な解釈はありません。 FX、ゴールド(XAUUSD)、指数、仮想通貨に対応し、すべての時間足で機能します。 購入後の特典:MERAVITH での取引方法を解説した動画レッスン集。購入後にメッセージをお送りください。 MERAVITH の機能 すべての時間足を分析し、それぞれで有効なトレンドを表示します。 流動性ゾーン(Volume Equilibrium)を示します。強気と弱気の出来高が等しくなる場所です。 すべての時間足の流動性レベルをチャート上に直接表示します。 参考用に市場のテキスト分析を書き出します。 現在のトレンドからエントリー、ターゲット、サポートレベル、ストップロスを計算します。 取引のリスクリワード比を計算します。 口座残高に
フィルタ:
レビューなし
レビューに返信