DronovFlux

DRONOV FLUX

Multi-Timeframe Adaptive Channel Indicator for MetaTrader 5

DRONOV FLUX is an advanced technical indicator designed to analyze dynamic price channels, identify changes in market structure, and highlight potential market reversal opportunities.

Unlike traditional indicators that rely on individual oscillator signals or standard moving average crossovers, DRONOV FLUX analyzes the interaction between price channels across multiple timeframes simultaneously.

The core methodology is based on Dynamic Channel Leadership — identifying which channel currently dominates price movement and detecting when its direction begins to change.

The indicator highlights potential BUY and SELL entry points with neon visual effects and provides two reference zones for potential trade exits.

Key Features

  • Multi-Timeframe Channel Analysis — simultaneous analysis of H4, H1, M30, M15, and M5 price channels.

  • Dynamic Channel Detection — visualization of evolving channel boundaries, directions, and interactions.

  • Adaptive Leader Identification — identification of the leading M5 or M15 channel during extended price movements.

  • Channel Crossover Signals — detection of potential reversals through directional channel crossovers.

  • H4 Pocket Detection — identification of extreme price movements beyond the outer H4 channel boundaries.

  • Neon Entry Signals — visually highlighted BUY ENTRY and SELL ENTRY points with colored glow effects.

  • Dual Exit Zones — two potential exit reference levels based on the opposite boundaries of the M30 and H1 channels.

  • Profit Protection Concept — the first exit zone can be used as a reference for manually activating a Profit Lock strategy.

How DRONOV FLUX Works

1. Multi-Timeframe Market Analysis

The indicator analyzes five timeframes:

  • H4 — Main Channel: Defines the broader market structure and extreme price boundaries.

  • H1 — Higher Working Channel: Provides additional market context and identifies the second potential exit zone.

  • M30 — Intermediate Channel: Visualizes developing market movements and identifies the first potential exit zone.

  • M15 — Fast Channel: Participates in leadership changes and potential reversal signal formation.

  • M5 — Fastest Channel: Helps detect early directional changes in price and channel dynamics.

All channels are displayed using distinctive neon colors for easy visual identification.

2. H4 Pocket — Extreme Price Zones

A potential trading setup begins when price moves beyond the outer boundary of the H4 channel.

SELL setup: Price extends above the upper H4 boundary.

BUY setup: Price extends below the lower H4 boundary.

This extended area is called the Pocket.

Entering the Pocket does not automatically generate a trading signal. It activates the monitoring of lower-timeframe channel interactions.

3. Dynamic Channel Leadership

Within the Pocket, the indicator monitors the relative positions and directions of the working channels.

The primary leadership candidates are M5 and M15.

The leading channel is identified by its extreme position relative to the other channels and the outer H4 boundary.

As market conditions change, leadership may shift between M5 and M15.

However, a leadership transition alone does not constitute a valid entry signal.

A qualifying signal requires a directional turn of the current leader followed by a corresponding channel crossover.

SELL Signal — Potential Bearish Reversal

A potential SELL signal is identified through the following sequence:

  1. Price moves above the upper H4 boundary.

  2. The working channels involved in the setup are positioned above the H4 outer boundary.

  3. M5 or M15 becomes the leading channel.

  4. The leading channel begins to curve downward.

  5. The leader crosses another working channel from above to below.

  6. A SELL ENTRY signal appears at the crossover point, highlighted by a red neon glow.

If another channel crosses a nearly horizontal leader from below to above, the event is treated as a potential leadership transition rather than an immediate SELL signal.

The indicator continues monitoring the new leader for a qualifying downward reversal.

BUY Signal — Potential Bullish Reversal

A potential BUY signal follows the opposite sequence:

  1. Price moves below the lower H4 boundary.

  2. The working channels involved in the setup are positioned below the H4 outer boundary.

  3. M5 or M15 becomes the leading channel.

  4. The leading channel begins to curve upward.

  5. The leader crosses another working channel from below to above.

  6. A BUY ENTRY signal appears at the crossover point, highlighted by a green neon glow.

Dual Exit Zones — Potential Trade Exit Areas

DRONOV FLUX provides two reference zones for evaluating and managing potential trading opportunities.

These zones are based on the dynamic boundaries of the M30 and H1 channels.

EXIT ZONE 1 — First Potential Exit (M30)

The first target is the opposite side of the 30-minute channel relative to the entry direction.

For BUY: The upper M30 channel boundary.

For SELL: The lower M30 channel boundary.

When price reaches this zone, traders may consider taking partial profits or activating a Profit Lock strategy.

A suggested approach is to manually move the protective stop into profitable territory after price touches the opposite M30 boundary, provided the trade has accumulated sufficient profit.

This may help protect part of the unrealized gains while allowing the remaining position to benefit from a possible continuation of the move.

EXIT ZONE 2 — Second Potential Exit (H1)

The second reference target is the opposite boundary of the hourly H1 channel.

For BUY: The upper H1 channel boundary.

For SELL: The lower H1 channel boundary.

If price continues moving favorably, traders may consider holding the remaining position toward this zone.

A protective stop established after reaching M30 may help limit the loss of previously accumulated profits.

Since channel boundaries are dynamic, the distance and order in which these zones are reached may change with market conditions.

Important: EXIT ZONE 1 and EXIT ZONE 2 are analytical reference levels, not guaranteed price targets. The indicator does not automatically place Stop Loss, Take Profit, or Profit Lock orders.

Trading Philosophy

Financial markets are constantly evolving.

Lower-timeframe movements gradually influence higher-timeframe structures, while changes in channel direction and leadership may reveal developing shifts in market momentum.

DRONOV FLUX combines extreme price movement analysis, dynamic channel leadership, and multi-timeframe channel interactions into a unified visual system.

Its primary purpose is to help traders identify potential changes in market direction, recognize entry opportunities, and evaluate possible exit areas.

Who Is DRONOV FLUX For?

DRONOV FLUX is designed for traders interested in:

  • Multi-timeframe technical analysis.

  • Channel-based trading methodologies.

  • Potential market reversal identification.

  • Dynamic support and resistance structures.

  • Visual confirmation of trading opportunities.

  • Manual trade management and profit protection.

Important Information

DRONOV FLUX is a technical analysis indicator, not an automated trading robot.

The indicator provides visual trading signals and potential exit reference levels. It does not independently open, manage, or close trading positions.

All trading decisions, position sizing, risk management, Profit Lock activation, and trade execution remain the responsibility of the trader.

Trading financial markets involves risk. No indicator can guarantee accurate signals or profitable results. Historical performance does not guarantee future outcomes.

DRONOV FLUX

Don't predict the market. Follow its flow.

🔥 Source Code Available for Purchase!

💻 Perfect for those who want to explore, customize, and further develop the trading algorithm.

📩 Interested? Send me a private message for more details!

P.S. The source code is for sale, but the secret to becoming a millionaire is still under development. 😎

추천 제품
Multi Timeframe Chart
Bekono Owona Roger Blaise
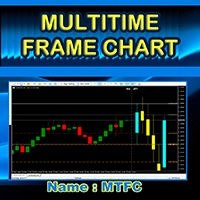
MTFC (Multi Timeframe Chart) – See 2 Timeframes on ONE Chart! "Trade Smarter, Not Harder – Eliminate Timeframe Switching Forever!" Imagine having the power to see any higher timeframe (M5, M15, H1, H4, D1, MN1, etc.) directly on your current chart.   No more flipping between charts, no more guesswork—just   pure trading clarity   in one place. That’s exactly what the   MTFC Indicator   delivers! 1. The Problem It Solves As traders, we know   context is king . But constantly switching between c
QuantumLogic AI
Silvano Cesar Silva Vieira
QuantumLogic AI QuantumLogic AI는 기관 수준의 알고리즘 거래를 위해 설계된 고도로 정교한 Expert Advisor입니다. 초고속 비동기 블록 청산 시스템(Basket)과 결합된 동적 비용 평균화 전략(Grid)을 활용합니다. 전략 개요 EA는 이동 평균을 사용하여 시장 방향을 필터링하고 계산된 그리드 주문을 실행합니다. QuantumLogic AI는 엄격한 시간 창 내에서 작동하며, 세션이 끝날 때 독점적인 "오버타임" 알고리즘을 사용하여 거래를 안전하게 관리하고 청산합니다. 핵심 기능 및 혁신 3중 세션 시간 관리: 하루를 세 개의 독립적인 기간으로 나눕니다. 오버타임 트레일링 기술: 세션 종료 시 미결제 주문이 남아 있는 경우 해당 주기에서 달성한 최대 수익의 사용자 지정 가능한 비율을 보호합니다. 내장 뉴스 필터: 영향력이 큰 USD 뉴스(3성)를 캘린더에서 스캔하여 진입을 일시 중지하고 강제 청산합니다. 비동기 청산 엔진: 수십 개의 주문을 밀리
Eye of Horus
Irina Kolosova
Eye of Horus — an indicator for confirmed reversals for MetaTrader 5 Eye of Horus — this indicator identifies confirmed price reversals. It draws a coloured line connecting confirmed price movements. How it works The indicator tracks a potential high or low. It then waits for a price movement of at least the Signal Distance (Points). The reversal must be confirmed within the Confirmation Window (Bars) of closed candles following the specified price movement and time period. If the time windo
FiveStarFX Gold Reversal Edge Professional automated trading solution designed for structured execution and controlled risk management in the Gold market. Built for traders who value discipline, precision, and consistency. Key Features Fully automated trading One trade at a time (controlled exposure) Fixed Stop Loss and Take Profit Smart Break-Even protection Profit lock with buffer Step-based trailing management Spread protection system Works on any broker Trade Management The E
FREE
Limitless MT5
Dmitriy Kashevich
Limitless MT5 is a universal indicator suitable for every beginner and experienced trader. works on all currency pairs, cryptocurrencies, raw stocks Limitless MT5 - already configured and does not require additional configuration And now the main thing Why Limitless MT5? 1 complete lack of redrawing 2 two years of testing by the best specialists in trading 3 the accuracy of correct signals exceeds 80% 4 performed well in trading during news releases Trading rules 1 buy signal - the ap
RBM EA Deluxe
Renato Brendim Medici
An XAUUSD-focused robot that only enters when several market conditions line up at once: trend, volume, price structure and session. It shows you exactly what it’s analyzing on the chart, and why it decided to trade or wait. Most gold robots you’ll find out there run on something simple: a moving average cross, or a channel breakout, and that’s it. The problem is gold doesn’t trade that way. It sweeps liquidity, traps early entries, and usually only moves for real after shaking everyone out fir
DG TrendSigns
David Gadelha
2 (1)
Purpose DG Trend+Signs is an indicator that paints candles with trend colors and clearly shows consolidations, using both DoGMA Trend and DoGMA Channel indicators. It was created to help users in their trades, showing trends, consolidations and marking entry and exit points. The indicator also takes consolidations in consideration to identify breakouts. Key features Designed to be simple to use, with a few parameters Does NOT repaint Does NOT recalculate Signals on entries Works in ALL pairs Wo
Quantum Pulse Force
Joas Da Silva Veiga
추세 지표, 시장 흐름, 모멘텀 지표, 가격 행동, 외환 지표, 매수 매도 신호, 추세 반전, 변동성 지표, 기술 분석, MT5 지표, 스캘핑, 시장 강도, 거래 신호, 알고리즘 거래, 가격 채널 Quantum Pulse Force는 가격 흐름의 가속도를 측정하고, 통계적 축적 구간을 식별하며, 높은 확률의 수렴 신호를 생성하도록 설계된 MetaTrader 5용 기술적 지표입니다. 이 지표는 여러 정량적 분석 기법을 결합하여 시장 움직임에 대한 통합적이고 객관적인 시각을 제공합니다. 시각적 구성 요소 지표는 차트에 다양한 그래픽 요소를 표시합니다: 색상 캔들 (흐름 및 강도 기반) 양수 및 음수 흐름 히스토그램 상단 및 하단 채널 라인 음영 처리된 구간 영역 신호 강도 라인 Z-Score 라인 매수 및 매도 화살표 차트 내 정보 패널 흐름 퍼센트 로직 핵심 계산은 두 이동평균 간 차이의 백분율 변화에 기반합니다. 해석: 양수 값은 상승 가속도를 의미 음수 값은 하락 가속도를 의미
Risk Guard Pro
Muniz Machado Thiago
RiskGuard PRO – Defesa Inteligente para Traders Sérios no EURJPY M15 O RiskGuard PRO é um Expert Advisor de alto desempenho, projetado exclusivamente para o par EURJPY no timeframe M15 , com foco total em preservação de capital, gestão de risco avançada e execução estratégica de múltiplas abordagens operacionais . Ao contrário dos EAs tradicionais, o RiskGuard PRO foi desenvolvido com tecnologia proprietária e arquitetura inteligente , capaz de operar com segurança mesmo em ambientes de merc
NQX Opening Break Daily Bias
Marcel De Oliveira Farias
NQX Opening Break Daily Bias은(는) MetaTrader 5용 시그널 인디케이터입니다: 시가 레인지 돌파 시그널(일간 바이어스 방향으로만 시그널을 냅니다). 당일 시가 레인지의 돌파를 감지하는 NQX 독자 로직입니다. 일간 바이어스 방향으로만 시그널을 냅니다. 제안 진입가, 짧은 손절, 먼 목표가(3:1, 5:1, 10:1, 스윙에서는 최대 20:1)를 표시하며, 결정은 당신이 합니다. 차트에 표시되는 내용 - 확정된 시그널 캔들에 화살표 표시(확정된 시그널은 절대 리페인트되지 않습니다). - 제안 진입가, 짧은 손절, 먼 제안 목표가(기본값: 리스크의 5배), 그리고 3 x 1, 5 x 1, 10 x 1 참조선. - 레벨에 도달하면 차트에 라벨(목표가 또는 손절)이 표시됩니다. - 마지막 시그널과 표시된 히스토리에 나타난 시그널 수를 보여주는 패널. - 새 시그널 발생 시 팝업 및 푸시 알림(선택 사항). NQX 전용 로직: 다른 어떤 NQX 인디케이터도 이와
Winning Strategy Pro
Jasim Mohammed Mousa Bahiya
Winning Strategy Pro is a professional Expert Advisor for XAUUSD M5. It uses a unique algorithm combining multiple technical confirmations for high-probability entries with strict risk management. KEY FEATURES: - Smart price level detection - Multiple entry confirmation filters - Flexible Money Management (Fixed or % Risk) - Daily protection (loss/profit limits, max trades) - Trading time filter - Email & Push notifications - Visual trading zones on chart - Real-time info panel PROTECTION: -
BB out arrows
Smaylle Rafael Coelho Mariano
BB Out Arrows   is a powerful and intuitive indicator designed for MetaTrader 5 (MT5) that enhances trading strategies using Bollinger Bands. This indicator signals potential trading opportunities by displaying arrows when a candle closes outside of the Bollinger Bands, but with an added layer of precision through a wick percentage filter. Key Features: Bollinger Bands Integration:   Utilizes the classic Bollinger Bands to identify market volatility and potential price reversals. Arrows Indicati
FREE
Fluxo smart L
Natanael Bastos Alves
After purchasing the product, please contact us at: escritorioremotoiq28@gmail.com or Natanael.playoff@gmail.com. ​Upon contacting us, you will receive an additional indicator (included in the image) along with a detailed guide on how to use it. The files and instructions will be sent directly to your email. **Flow Code: Institutional Liquidity & Amplitude Analyzer** **The Flow Code is the ultimate tool for those who want to trade the real market flow.** Developed for **professional traders*
Multi Timeframe Trend Sync
Jamille De Jesus Velasco
# Multi-Timeframe Trend Sync Pro (MTTS Pro) ## Synchronize Multiple Timeframes and Trade with Trend Confluence **MTTS Pro** is an advanced technical indicator developed for traders seeking precision in multi-timeframe analysis. By consolidating information from multiple timeframes simultaneously, the indicator identifies points of high confluence where multiple timeframes confirm the same market direction. --- ## MAIN FEATURES ### **Simultaneous Multi-Timeframe Analysis** - Monitor up t
Multiple TimeFrame MACD Confluency Tool
Kelvin Souza Da Costa Oliveira
Multiple Timeframe MACD indicator. This indicator was built for making multiple timeframe analysis possible in MT5 using MACD Indicator. MACD Indicator traditionally shows two lines and one histogram. MACD Line(Yellow) is calculated by subtracting 12period EMA(fast) from 26period EMA (slow). Signal Line(Blue) is created by a 9period EMA from MACD Line. Histogram is just the difference between MACD and Signal lines. Histogram is colored based on the difference between its value and the previous h
Neural Bar Impulse is an indicator based on a neural network created and specially trained to predict the potential impulse of each next market bar. By bar impulse we mean the tendency of the market price to update the maximum or minimum of the bar relative to its opening price. We chose this particular feature of market bars because, based on our own research, we discovered an interesting feature of bar impulses to be harbingers of a change in price trend movements. The neural network we cre
BlinkBreakout EA
Dariia Sinielnik
BlinkBreakout EA is a professional automated trading system for MetaTrader 5 that trades breakouts of session ranges (London/New York) with dynamic ATR-based risk management. The EA identifies the consolidation range at the start of a user-defined session, then automatically enters when price breaks the High or Low. Every trade uses a hard Stop Loss calculated from current market volatility (ATR), with optional Take Profit, Break-Even, and Trailing Stop functions. Key features: • Session-based
PinPoint Level
Paulo Roberto Jusviak Dambros
Pinpoint Level is the indicator for Day Traders and Scalpers. Developed to deliver precision when entering or exiting trades without the need for manual configuration. Just drag it onto the chart and it will instantly map the most critical price zones for the current session. Ideal for Forex, Indices, and Cryptocurrencies, it automatically calculates the previous day's range and projects exact Fibonacci-based Support and Resistance expansions, keeping your chart clean and your focus on what mat
FREE
Dynamic Trend Visualizer: Momentum and Direction Indicator The Dynamic Trend Visualizer is an advanced flow analysis tool designed to translate the complexity of price movements into a clear and objective visual map. Through an internal trend-tracking algorithm, the indicator continuously scans price action and identifies who is in control of the market — bulls, bears, or indecision. Instead of cluttering your chart with lines and oscillators, it directly colors the candles in real-time, allowin
Descrição Geral O Scalping Pattern 123 WDO & WIN é um robô de alta performance desenvolvido especificamente para operar os contratos futuros mais líquidos da B3: Mini Dólar (WDOFUT) e Mini Índice (WINFUT) . Baseado na clássica e respeitada metodologia de reversão de tendência (Setup 1-2-3), o algoritmo automatiza a leitura de fluxo de preço e correções de curto prazo, eliminando o fator emocional das suas operações. Principais Funcionalidades Operação Multiativo: Projetado com parâmetros otimiza
FREE
HV Models
Andrey Azatskiy
HV Models is an Indicator that containes 4 methods for calculating historical volatility of the selected asset. Volatility is one of the fundamental values ​​describing changes in the underlying asset. In statistics, it usualy describes as a standard deviation. The price chart has 4 values ​​(Open High Low Close) when we calculate volatility using a standard indicator, only one of these values ​​is used as a result we get one-sided volatility picture. The presented indicator uses 4 volatility ca
HAWK 4.0 — GOLD SIGNAL INDICATOR The most precise signal indicator  for XAUUSD (Gold) trading. Built on ATR Bands + Pivot detection. Signals appear only at real reversal points. No repaint. No delay. No noise. WHAT YOU GET → Clear BUY / SELL arrows → Auto TP1 / TP2 / TP3 levels → Auto SL level → Built-in time filter (UTC) → Real-time success statistics → Full alert system DESIGNED FOR Symbol:    XAUUSD (Gold) Timeframe: M3 / M5 Ses
Strong Candle2
Roberto Tavares
Strong Candle Indicates the size of each candlestick with the text value above it and indicates which candlestick has a body larger than the one specified in the parameters in percentage, that is, a strong candlestick (between Size_Min and Size_Max) with at least x% of body. The candlestick size is placed in the buffer and that is the buy or sell indication, where: value > 0 = bullish candle or value < 0 bearish candle, value = 0 means no indication (the candle did not match the desired pattern
XCalper HiLo Activator
Aecio de Feo Flora Neto
HiLo Activator v1.02 by xCalper The HiLo Activator is similar to moving average of previous highs and lows. It is a trend-following indicator used to display market’s direction of movement. The indicator is responsible for entry signals and also helps determine stop-loss levels. The HiLo Activator was first introduced by Robert Krausz in the Feb. 1998 issue of Stocks & Commodities Magazine.
Volume Profile Indicator used by professional Traders at Traders Inside Ltd. If you want to succeed in trading you need to know if current price is cheap, expensive or fair valued. Key features: Fair price (Point of control, POC), high and low price zones (POH, POL) POC in different timeframes for better orientation Symbol and timeframe Chart resize on open positions/orders, VPRmax/min Historic POC - see, how POC has changed the last periods Button to show/hide VPR Calculated Bars (best results)
Golden Ideal Pro
Georgios Kalomoiropoulos
5 (1)
Golden Ideal Pro 는 거래의 양보다 질을 우선시하며, 고확률 진입 자리를 식별하는 정교한 알고리즘을 탑재한 첨단 트레이딩 시스템입니다. 이 전문 어드바이저(EA)는 실제 라이브 시장 환경에서 일관된 성능을 발휘하고, 낮은 드로우다운으로 안정적인 운용을 원하는 트레이더를 위해 설계되었습니다. 자금 효율성의 극대화, 리스크 분산, 장기적 안정성을 실현하기 위해 고도로 최적화된 단일 코어 전략 엔진을 기반으로 구동됩니다. 궁금한 점이 있으시면 언제든지 문의해 주시기 바랍니다. 저희는 항상 고객을 가장 최선의 방법으로 지원하고 모든 의문점을 해결해 드리기 위해 준비되어 있습니다. 그리드 없음, 마틴게일 없음, 물타기 없음 . 모든 단일 거래는   고정된 손절매 및 익절매   타겟에 의해 보호되므로, 사용자의 리스크는 항상 엄격하게 제한됩니다. 여기서 Golden Ideal Pro  가이드 읽기 왜 Golden Ideal Pro 인가요? 대부분의 골드  EA는 횡보장에서 무너지
FTrend3
Sonia Tait
Este EA combina a tendência do tempo gráfico principal com mais dois tempos gráficos configuráveis. Os stops são técnicos baseados na técnica dos canais OffRoad. Ao executar otimizações, é interessante buscar as combinações de tempos gráficos que corroboram para um bom resultado para cada ativo e seu comportamento. Estudos apontam para resultados mais assertivos quando os testes são feitos nos últimos meses para operar no próximo. O período do ADX e das bandas de Bollinger também podem variar co
Professor Prop
Dayanand Pandey
### Overview Professor Prop ist ein vollständig automatisierter Expert Advisor, der für Trader entwickelt wurde, die menschliche Emotionen, Unentschlossenheit und Ermüdung vollständig aus ihrem Handelsalltag verbannen möchten. Ausgestattet mit null manuellem Aufwand steuert dieses System alles autonom – von der Marktanalyse und der Ausführung von Einstiegen bis hin zur präzisen Platzierung von Stop-Loss und Take-Profit. Egal, ob Sie ein persönliches Portfolio verwalten oder strenge Evaluierung
RBreaker
Zhong Long Wu
RBreaker Gold Indicators는 금 선물을 위한 단기 데이 트레이딩 전략으로, 추세 추종과 데이 내 반전의 두 가지 거래 방식을 결합합니다. 추세 장에서 수익을 포착할 수 있을 뿐만 아니라, 시장이 반전될 때 적시에 이익을 확정하고 추세에 맞춰 반대 포지션을 잡을 수 있습니다. 이 전략은 미국 잡지 Futures Truth에서 15년 연속으로 가장 수익성 높은 트레이딩 전략 상위 10위 안에 선정되었습니다. 긴 라이프사이클을 자랑하며, 현재까지 국내외에서 널리 사용되고 연구되고 있습니다. 본 지표는 2026년 금 선물의 움직임을 반영하여 14일 ATR 지표를 기반으로 돌파 계수 A, 관찰 계수 B, 반전 계수 R을 보다 합리적인 값으로 정의했습니다. 매우 훌륭한 지표이며, 안정적인 연간 수익성을 달성했습니다. 강력히 추천합니다~ 위 지표는 변동성이 높은 상품에 적합하며, 매개변수는 금 선물, 주가 지수 선물 등에 적합합니다. 다른 상품이 필요한 경우 돌파 계수 A
NewYork_SilasFernandes: H1 Entry Killer. Green signal for buy, red for sell – no lag, no repainting. Uses real volume to filter noise, Bollinger Bands to catch perfect reversals. Advantages: enters before the move, exits at the top, works only on H1 but you can test other timeframes. Parameters: VolumeThreshold (adjusts sensitivity, default 50), BollingerPeriod (default 20, default 2 deviations), SignalColorBuy (green), SignalColorSell (red).
이 제품의 구매자들이 또한 구매함
Boba Analysis Suite
Trade Ready Solutions LLC
5 (2)
Boba Analysis Suite Boba Analysis Suite는 MetaTrader 5용 분석 지표입니다. 시장 구조, 주요 가격 영역, 전반적인 시장 상황을 하나의 차트 화면에 통합하여 표시합니다. 트레이더이자 트레이딩 코치로서의 실무 경험을 바탕으로 개발되었으며, 시장 방향 평가, 주요 가격 수준 식별, 여러 시간대의 종합적인 분석 등 체계적인 분석 과정을 지원합니다. 시장 맥락을 고려한 분석 개별 신호의 의미는 시장 상황에 따라 달라집니다. Boba Analysis Suite는 현재 차트 상황을 더 넓은 시장 구조와 연결하고, 사전에 정한 규칙에 따라 매매 아이디어를 검토할 수 있도록 돕습니다. 주요 분석 기능은 다음과 같습니다. 추세 및 시장 구조: 시장 방향과 관련 구조적 맥락을 평가합니다. 주요 가격 영역 및 수준: 추가 분석이 필요한 중요한 영역을 차트에 시각적으로 표시합니다. 여러 시간대: 서로 다른 시간대의 정보를 통합하여 전반적인 시장 상황을 평가합니다.
SQN Max indicator for MT5 by ITC
Renaud Herve Francois Candel
Sqn Max Indicator Sqn Max is an exclusive indicator to trade the market with high effectiveness. The indicator is based on price action, volatility and trend. This indicator is as simple as possible but not too simple. The indicator can generate alerts to ease the trading process. You don't have to stay all day in front of your screen. The indicator can be used with any class of assets and with any time frame. It is possible to achieve better results trading our list of selected assets. We achi
Azimuth Pro
Ottaviano De Cicco
5 (7)
Azimuth Pro V2: Synthetic Fractal Structure and Confirmed Entries for MT5 Overview Azimuth Pro is a multi-level swing structure indicator by Merkava Labs . Four nested swing layers, swing-anchored VWAP, ABC pattern detection, three-timeframe structural filtering, and closed-bar confirmed entries — one chart, one workflow from micro-swings to macro-cycles. This is not a blind signal product. It is a structure-first workflow for traders who care about location, context, and timing. Halloween P
ARICoins
Temirlan Kdyrkhan
ARICoin is a powerful trading companion designed to generate high-probability entry signals with dynamic TP/SL/DP levels based on volatility. Built-in performance tracking shows win/loss stats, PP1/PP2 hits, and success rates all updated live. Key Features: Buy/Sell signals with adaptive volatility bands Real-time TP/SL/DP levels based on ATR Built-in MA Filter with optional ATR/StdDev volatility Performance stats panel (Success, Profit/Loss, PP1/PP2) Alerts via popup, sound, push, or email Cust
ScalpPoint
Temirlan Kdyrkhan
ScalpPoint is a powerful trading companion designed to generate high-probability entry signals with dynamic TP/SL/DP levels based on volatility. Built-in performance tracking shows win/loss stats, PP1/PP2 hits, and success rates — all updated live. Key Features: Buy/Sell signals with adaptive volatility bands Real-time TP/SL/DP levels based on ATR Built-in MA Filter with optional ATR/StdDev volatility Performance stats panel (Success, Profit/Loss, PP1/PP2) Alerts via popup, sound, push, or emai
Naked Forex Kangaroo Tail Pro Indicator Kangaroo Tail Pro Indicator is a pattern recognition indicator for Forex, Stocks, Indices, Futures, Commodities and Cryptos. The Kangaroo Tail is a multi-bar pattern. The Kangaroo Tail pattern is very effective and is very simple to trade. The strategy that comes with the Kangaroo Tail is based on price action. The indicator does what it was designed for: displaying Kangaroo Tail patterns.     Don't expect to follow the up and down arrows and make mone
AriFocus
Temirlan Kdyrkhan
AriFocus - Non-Repainting Buy/Sell Signals AriFocus - one clear signal. AriFocus marks buy and sell signals directly on the chart and suggests a stop-loss level for each one. Every signal is confirmed on bar close and never repaints. - Buy/sell arrows, confirmed on bar close - Suggested stop-loss level for every signal - Trend band and candle coloring to show direction at a glance - 10 ready-made presets, or your own settings (14 calculation methods) - Pop-up, push and email alerts with entr
ARIPoint
Temirlan Kdyrkhan
1 (4)
ARIPoint is a powerful trading companion designed to generate high-probability entry signals with dynamic TP/SL/DP levels based on volatility. Built-in performance tracking shows win/loss stats, PP1/PP2 hits, and success rates all updated live. Key Features: Buy/Sell signals with adaptive volatility bands Real-time TP/SL/DP levels based on ATR Built-in MA Filter with optional ATR/StdDev volatility Performance stats panel (Success, Profit/Loss, PP1/PP2) Alerts via popup, sound, push, or email Cu
Zain Gold Scalping
Ahmed Gamal Abdel Nasser Mohamed
A complete price-action analysis tool built around dual independent entry logic, each confirmed against a volatility band, combined with a configurable set of nine optional confirmation filters that let you shape exactly how conservative or aggressive the tool's signals behave. Core Strategy Two independent entry setups, each triggering only when price moves outside a dynamic volatility band — giving two distinct ways to spot potential reversal points, which can be used together or separately.
Orderflow Big Trade 추정 델타 히트맵으로 캔들 내부에 숨겨진 매수·매도 압력 포착 일반 캔들 차트 내부 에서 일어나는 결정적인 거래 활동을 놓치고 계신가요? Orderflow Big Trade 는 고도화된 변동폭 및 종가 가중치 알고리즘을 사용하여 그룹화된 가격대별 매수 및 매도 압력을 추정합니다. 단순 거래량에만 의존하는 대신, 프라이스 액션 동역학을 명확한 시각적 델타 맵으로 변환하여 기관의 물량 흡수(Absorption), 모멘텀 돌파, 갇힌 트레이더(Trapped Traders), 그리고 주요 구간의 수용 및 거절을 즉각 식별할 수 있도록 돕습니다. [ 무료 데모 버전 다운로드 ] 지금 바로 실제 차트에서 모든 기능을 테스트해보세요. 구매 전 설정 변경, 시각적 명확성 확인, 본인의 매매 전략과의 적합성을 부담 없이 경험하실 수 있습니다. 트레이딩 핵심 강점 캔들 내부 델타 추정: 캔들의 고저 범위와 종가 위치를 분석하여 특정 가격 클러스터
OrderFlow Absorption – MT5용 전문 델타 & 흡수 신호 인디케이터 OrderFlow Absorption으로 진정한 오더플로우 분석의 힘을 경험하세요. MetaTrader 5를 위한 궁극의 델타 히스토그램 및 흡수 신호 인디케이터입니다. 가격 움직임의 이면에서 실제로 무슨 일이 일어나는지 알고 싶은 트레이더를 위해 설계된 이 도구는, 시장을 움직이는 숨겨진 매수/매도 압력과 흡수 이벤트를 드러냅니다. 주요 기능 델타 히스토그램 시각화:   매수와 매도 압력을 색상별 히스토그램으로 즉시 확인할 수 있습니다. 흡수 신호 감지:   고급 로직으로 강세 및 약세 흡수 이벤트를 식별하여 반전 신호를 미리 알려줍니다. 차트 마커:   흡수 신호가 차트에 직접 표시되어 시각적으로 쉽게 확인할 수 있습니다. 팝업 알림:   새로운 흡수 신호가 발생하면 실시간으로 알림을 받을 수 있습니다. 사용자 지정 임계값:   약한 신호는 필터링하고, 확률이 높은 기회에 집중할 수 있습니다.
CGE Trading Suite
Carl Gustav Johan Ekstrom
5 (3)
Institutional-Grade Analytics for MT5 The full analytical edge of a professional trading desk, built into your MT5 chart. A full guided tour walks you through every feature step by step. Standard retail platforms lack the depth required for professional market analysis. The CGE Trading Suite bridges this gap, transforming MetaTrader 5 into a comprehensive workspace. By integrating 18 proprietary modules into a single, unified chart interface, the suite eliminates fragmented analysis. It provide
Chimera Volume
Marko Milenkovic
MetaTrader 5용 Chimera Volume 고급 거래량 분석 및 시장 활동 시각화 Chimera Volume은 MetaTrader 5 전용 사용자 정의 지표로, 정규화된 거래량 활동을 분석하고 역동적인 시각적 프레임워크를 통해 시장 참여도의 변화를 보여주도록 설계되었습니다. 이 지표는 적응형 정규화 알고리즘을 사용하여 틱 거래량 데이터를 처리하며, 다양한 시장 상황 속에서 거래량의 강도, 매집 단계, 활동 변화를 구조화된 형태로 생성합니다. 원시 거래량 값을 표시하는 일반 거래량 지표와 달리, Chimera Volume은 추가 계산을 적용하여 시장 활동의 상대적 변화를 강조하고 차트의 가독성을 향상시킵니다. 주요 기능 루트 인텐트 히스토그램 (Root Intent Histogram): 정규화된 거래량 강도와 시장 참여도를 시각화하는 동적 히스토그램입니다. 적응형 색상 전환을 사용하여 활동 증가 시기와 참여 감소 시기를 명확하게 구분합니다. 관성 라인 (Inertia Line
SMC Sniper Pro MT5
Jordan Steven R Machell
SMC Sniper Pro MT5 SMC Sniper Pro by QuantFlow Labs is a chart indicator for liquidity-based intraday analysis. It combines session ranges, tracked liquidity sweeps and three selectable entry models in one configurable workspace. It displays setup context and entry references; it does not open, manage or close trades. Three selectable entry models Model 1 - Inverse Fair Value Gap breakout: after an eligible liquidity sweep, the indicator waits for a confirmed close through the relevant fair valu
Gem SIGNAL
Shengzu Zhong
5 (1)
GEM Signal Pro GEM Signal Pro는 MetaTrader 5용 추세추종형 지표로, 차트에서 더 명확한 신호, 더 구조적인 트레이드 설정, 그리고 더 실용적인 리스크 관리를 원하는 트레이더를 위해 설계되었습니다. 단순한 화살표만 표시하는 것이 아니라, GEM Signal Pro는 전체 트레이드 아이디어를 더 깔끔하고 읽기 쉬운 방식으로 보여줍니다. 조건이 확인되면 진입가, 손절가, 목표가를 차트에 표시하여 트레이더가 설정을 더 효율적으로 검토할 수 있도록 도와줍니다. 작동 방식 이 지표는 먼저 내부 로직에 따라 유효한 초기 신호를 식별합니다. 확인 조건이 충족되면, GEM Signal Pro는 차트에 전체 설정을 표시합니다. 이를 통해 트레이더는 거래 구조를 더 명확하게 보고, 수동 분석 작업을 줄일 수 있습니다. 차트에 표시되는 거래 레벨 확인된 신호에 대해, GEM Signal Pro는 다음을 표시할 수 있습니다. 진입가 손절가 목표가 1 목표가 2 목표가 3 손
VTrende Pro
Andrii Diachenko
5 (1)
VTrende Pro - MTF indicator for trend trading with a display panel for MT5 *** Videos can be translated into any language using subtitles (video language - Russian) Although the signals of the VTrende Pro indicator can be used as signals of a full-fledged trading system, it is recommended to use them in conjunction with the Bill Williams TS. VTrende Pro is an extended version of the VTrende indicator. Difference between Pro version and VTrende: - Time zones - Signal V - signal 1-2 waves -    S
QNC Scalper
Yordiana Enggelina Seko
Here is a professional and engaging description for the Indikator QNC Scalper tool in English, tailored for traders and platforms: Indikator QNC Scalper Unlock precision trading in fast-paced markets with the Indikator QNC Scalper —an advanced technical analysis tool engineered specifically for scalpers and day traders. Whether you are trading forex, crypto, or indices, this indicator cuts through market noise to deliver clear, high-probability entry and exit signals. Key Features Real-Time M
TrendMaestro5
Stefano Frisetti
note: this indicator is for METATRADER4, if you want the version for METATRADER5 this is the link:  https://www.mql5.com/it/market/product/108106 TRENDMAESTRO ver 2.5 TRENDMAESTRO recognizes a new TREND from the start, he never makes mistakes. The certainty of identifying a new TREND is priceless. DESCRIPTION TRENDMAESTRO identifies a new TREND in the bud, this indicator examines the volatility, volumes and momentum to identify the moment in which there is an explosion of one or more of these da
OmniSync Projection
Antonio-alin Teculescu
5 (1)
Chronos Fractal Engine is an innovative price projection indicator for MetaTrader 5, designed to transform your technical analysis by intelligently identifying and projecting historical price patterns. Built upon an advanced correlation algorithm and the fractal principles of the market, this powerful tool visualizes potential future price movements, giving you a unique edge in your trading decisions. What is Chronos Fractal Engine? At its core, the Chronos Fractal Engine employs a sophisticat
Title:FX-AIEA Supply and Demand Zone Indicator (MT5) — Technical Overview Version: 2.51 | Platform: MetaTrader 5 Introduction Supply and demand zones are considered a core manifestation of institutional order flow, providing a more direct reflection of buying and selling pressure than traditional support/resistance levels. This indicator attempts to automate the identification of high-probability supply and demand zones using an adaptive ZigZag algorithm, reducing the subjectivity and time asso
ORB Seeker MT5
Marcela Goncalves De Oliveira
한정 수량 판매 및 제품 희소성 유지를 위한 특별 가격입니다! 단돈 599달러! 구매 후 저에게 연락 주시면 보너스 ORB Seeker EA와 개인 최적화 설정 파일을 보내드립니다. 깔끔한 세션 브레이크아웃을 자신감 있게 활용하세요! ORB Seeker MT5는 정확성, 단순성, 유연성 및 명확한 차트 구조를 원하는 트레이더를 위해 개발된 전문적인 시가 범위 돌파(ORB) 지표입니다. 이 프로그램은 모든 금융 상품에 대해 장전 거래 또는 사용자 지정 세션 범위를 자동으로 표시하고, 진입, 손절매, 목표 수익 및 선택적으로 50% 부분 목표 수익 수준을 포함한 명확한 돌파 신호를 제공합니다. 모든 계산은 실시간으로 차트에 직접 표시됩니다. 런던 개장, 뉴욕 세션, 아시아 세션 또는 사용자 지정 시장 시간대를 선택하여 거래하세요. ORB Seeker MT5는 사용자가 선택한 세션 시간에 맞춰 작동하므로 시장 범위, 돌파 레벨 및 거래 레벨을 정확하게 확인할 수 있습니다. 모든 구매
Zain Gold ScalpingV5
Ahmed Gamal Abdel Nasser Mohamed
Zain Gold Scalping V5 is a technical analysis indicator for MetaTrader 5 designed for Forex and Gold markets. It provides chart-based market information, trend analysis, signal conditions, and an on-screen dashboard to help traders analyze price movement across multiple timeframes. Main Features The indicator supports multiple timeframes, including M1, M5, M15, M30, H1 and higher timeframes. It can be used with Gold (XAUUSD), Forex currency pairs, indices and other supported instruments. The in
The indicator is designed to close positions on the market in time. For example: to take profits ahead of schedule if the price has not reached TakeProfit, and the market is turning around. The indicator analyzes the momentum, not the trend. He does not give any information about the trend. The indicator is well suited for finding divergence. The Ershov 38 Parrots indicator dynamically adjusts to the market and detects price movement impulses of medium and high amplitude. It almost does not rea
First time on MetaTrader, introducing IQ Star Lines, an original Vedic Astrology Based Intraday Trading Indicator. We don't offer free or bonus indicators in exchange of reviews from you. You won't need any free products with this indicator to make it work. ;) Enjoy! Welcome to the new and updated  IQ Star Lines , the ultimate fusion of ancient planetary cycles and modern quantitative trading, published for the first time on Metatrader. This is an indicator built by the developer, who has spent
AriX
Temirlan Kdyrkhan
1 (4)
AriX Indicator for MT5 A powerful trend-following and signal-evaluation tool AriX is a custom MT5 indicator that combines Moving Averages and ATR-based risk/reward logic to generate clear buy/sell signals. It visualizes dynamic SL/TP levels, evaluates past trade outcomes, and displays win/loss statistics in a clean on-chart panel. Key features include: Buy/Sell signals based on MA crossovers ATR-based SL/TP1/TP2/TP3 levels with visual lines and labels Signal outcome tracking with real-time stat
Meravith Scanner
Ivan Stefanov
5 (3)
MERAVITH SCANNER는 MetaTrader 5용 전문 금융 시장 지표로, 여러 분석 도구를 하나의 통합 시스템으로 결합합니다. 독점적인 거래량 가중 평균 가격(VWAP) 방법론을 사용하여 모든 계산을 자동으로 수행하며, 주관적인 해석을 완전히 배제합니다. 이 지표는 모든 자산 클래스(Forex, 주식, 지수, 상품, 암호화폐)와 M1부터 월간 차트까지 모든 시간 프레임에서 작동합니다. 기본 원리는 “가격은 거래량을 따른다”입니다. MERAVITH는 기관 거래량이 집중되는 위치를 식별하고, 그 집중에서 수학적으로 정확한 가격 수준을 도출합니다. 예측이나 투기를 하지 않으며, 계산만 수행합니다. MERAVITH SCANNER를 사용하면 28개의 주요 Forex 통화쌍을 모든 시간 프레임에서 단 2~3분 만에 스캔할 수 있습니다. 또한 원하는 시장을 스캔할 수도 있으며, 예를 들어 약 100개의 주식을 약 10분 안에 스캔할 수 있습니다. 지표는 소진 레벨, 균형선, 편차, 통계
Boom & Crash & PainX & GainX Ultimate Spike Detector Trade Spikes With Confidence — Not Guesswork Catching spikes should be one of the most profitable strategies in synthetic markets. But for most traders, it becomes one of the most frustrating. You enter too early… price goes against you. You wait for a spike… it never comes. You finally catch one… but don’t know whether to hold or close. You make profit… then give it all back because there’s no exit plan. This is exactly the problem the Ultim
한 문장으로 이해하면 이 인디케이터는 RSI와 MACD, 두 전문가를 하나로 묶은 것 입니다. 두 지표를 따로 보며 판단할 필요 없이, 둘 다 동의할 때만 "매수" 또는 "매도" 화살표를 보여줍니다. 화살표는 다시 그려지지 않습니다 . 한 번 나타나면 그 자리에 고정됩니다. "콤보"의 의미 보통 트레이더는 RSI(가격 움직임의 힘)와 MACD(추세 방향)를 따로 봅니다. 그런데 둘의 신호가 충돌할 때가 많죠. 이 인디케이터는 두 지표가 동시에 같은 방향을 가리킬 때만 신호를 냅니다 . 덕분에 가짜 신호가 훨씬 줄어듭니다. 화면에서 보이는 것 가격 차트와 분리된 인디케이터 창 파란색과 빨간색 화살표 – 바로 쓸 수 있는 매매 신호 확대된 MACD 히스토그램 (모멘텀을 쉽게 파악하도록 더 크고 선명하게 표시) RSI와 MACD 선도 함께 표시되지만, 주목할 것은 화살표 이런 분께 적합합니다 초보자 – 두 지표를 따로 해석하고 모순을 처리할 필요 없음 경험자 – 빠른 신호 필터링, 다시
Meravith MT5
Ivan Stefanov
5 (3)
MERAVITH는 MetaTrader 5용 멀티 타임프레임 거래량·유동성 지표로, 모든 타임프레임에서 추세, 지지와 저항 구간, 진입, 목표, 손절을 보여줍니다. 시장의 완전한 유동성 지도, 헤지펀드 스타일의 유동성 도구를 제공하며, 자체 거래량 가중 평균 가격 방식으로 모든 계산을 자동으로 수행하므로 주관적인 해석이 없습니다. 외환, 금(XAUUSD), 지수, 암호화폐에서 작동하며, 모든 타임프레임에서 사용할 수 있습니다. 구매 후 보너스: MERAVITH로 거래하는 방법에 대한 동영상 강의 모음. 구매 후 저에게 메시지를 보내주세요. MERAVITH의 기능 모든 타임프레임을 분석하고 각 타임프레임에서 현재 유효한 추세를 보여줍니다. 유동성 구간(Volume Equilibrium)을 표시합니다. 상승 거래량과 하락 거래량이 같아지는 지점입니다. 모든 타임프레임의 유동성 레벨을 차트에 직접 표시합니다. 참고용으로 시장의 텍스트 분석을 작성합니다. 현재 추세를 기준으로 진입, 목표,
필터:
리뷰 없음
리뷰 답변