AlgoTrade Spread and Slippage Monitor

AlgoTrade Spread and Slippage Monitor displays the chart symbol spread and fill slippage on the chart. It runs on any chart and reads account data only.

What it shows

  • Current spread in points, along with the average and widest spread since the indicator started, updated on every new tick.
  • Today's average and widest spread based on 1-minute bars.
  • Hourly spread over the last 7 days (1 to 60 days), showing the widest hour, narrowest hour, and usual spread for the current hour.
  • Slippage in points: the distance between each fill price and the requested order price for market orders, stop orders, stop losses, limit orders, and take profits.
  • The share of fills at a worse, the same, or a better price, and the estimated money gained or lost by slippage.
  • Data for the chart symbol or all symbols over the last 7 days, the last 30 days, or all history, accessible with one click.
  • An optional alert when the spread exceeds a set number of points, with an optional push notification.

How to use

  • Attach the indicator to any chart. It can run alongside an Expert Advisor on the same chart.
  • Use the tabs at the top of the panel. Click "Fold" to collapse it into a single line on the chart, or "Open" to display the full panel.

Inputs: page shown first, days of 1-minute bars, alert points, push notification, symbols shown first, period shown first, panel corner.

Please read

  • This indicator reads account data only and does not open, modify, or close trades.
  • A point is the symbol's smallest price step. The hourly and today's figures use the spread stored by the broker with each 1-minute bar, which is often the lowest spread of that minute.
  • Fills without a price asked in the order, such as some market orders on market execution accounts, are not counted. Stop outs and rollover deals are not counted.
  • The money amount is an estimate based on today's point value.
  • For questions or feature requests, please post in the comments section on this page. Your reviews help us plan updates.

Made by AlgoTrade Pte. Ltd. Trading always carries risk. Past results do not guarantee future results.

おすすめのプロダクト
概要 このインジケーターは、クラシックな ドンチャンチャネル を強化したバージョンで、実践的なトレード機能を追加しています。 標準の3本線(上限、下限、中央線)に加え、 ブレイクアウト を検出し、チャート上に矢印で視覚的に表示します。また、チャートを見やすくするために、 現在のトレンド方向と逆側のラインのみを表示 します。 インジケーターの機能: 視覚的シグナル :ブレイクアウト時にカラフルな矢印を表示 自動通知 :ポップアップ、プッシュ通知、Eメール RSIフィルター :市場の相対的な強弱に基づいてシグナルを検証 カスタマイズ可能 :色、ラインの太さ、矢印コード、RSI閾値など 動作原理 ドンチャンチャネルは次のように計算します: 上限線 :直近N本のクローズ済みローソク足の最高値 下限線 :直近N本のクローズ済みローソク足の最安値 中央線 :最高値と最安値の平均値 上方ブレイクアウト は終値が上限線を超えたときに発生し、 下方ブレイクアウト は終値が下限線を下回ったときに発生します。 インジケーターは以下を行います: 3本のドンチャンラインを描画 方向転換後の最初のブレイクアウト
FREE
Donchian Channel is an indicator created by Richard Donchian. It is formed by taking the highest high and the lowest low of the last specified period in candles. The area between high and low is the channel for the chosen period. Its configuration is simple. It is possible to have the average between the upper and lower lines, plus you have alerts when price hits one side. If you have any questions or find any bugs, please contact me. Enjoy!
FREE
Indicator Description 4 Hull MA Color + Envelopes is a powerful trend-following indicator for MetaTrader 5 that combines four Hull Moving Averages (HMA) with Moving Average Envelopes to clearly identify market direction, trend strength, and potential reversal or pullback zones. This indicator is designed to reduce noise, react quickly to price movement, and provide a clean visual structure for professional trading.   Key Features   4 Hull Moving Averages (20, 50, 100, 200) Automatic color change
FREE
Free automatic Fibonacci is an indicator that automatically plots a Fibonacci retracement based on the number of bars you select on the BarsToScan setting in the indicator. The Fibonacci is automatically updated in real time as new highest and lowest values appears amongst the selected bars. You can select which level values to be displayed in the indicator settings. You can also select the color of the levels thus enabling the trader to be able to attach the indicator several times with differe
FREE
DF Fib Trader Pro DF Fib Trader Proは、MetaTrader 5向けに設計された自動取引システムです。 フィボナッチベースの価格水準とトレンドおよびストラクチャー分析を組み合わせ、エントリーポイントとエグジットポイントを決定します。このEAはロングポジションとショートポジションの両方をサポートし、リスク管理パラメータも組み込まれています。 主な機能: • フィボナッチ・リトレースメントとエクステンション・ロジックを用いて、エントリーポイント、SLポイント、TPポイントをプロットします。 • ロットサイズと損切り/利益確定レベルを設定可能 • エントリーポイントは1つまたは2つから選択可能 • 市場状況に応じて、固定または動的な損切り/利益確定をサポート • 複数の時間枠と通貨ペアに対応 • 最大スプレッド、スリッページ、取引頻度の制御オプションを搭載 • 自動取引管理:損益分岐点、トレーリングストップ、部分決済オプション • 希望に応じて成行注文もサポート入力項目の概要: • リスク管理:ロットサイズ、取引ごとのリスク、最大取引回数 • エントリー
FREE
Are you tired of drawing trendlines every time you're analyzing charts? Or perhaps you would like more consistency in your technical analysis. Then this is for you. This indicator will draw trend lines automatically when dropped on a chart. How it works Works similar to standard deviation channel found on mt4 and mt5. It has 2 parameters: 1. Starting Bar 2. Number of bars for calculation The   starting bar   is the bar which drawing of the trend lines will begin, while the   number of bars for c
FREE
Most lot size calculators assume one pip is worth ten dollars. That assumption is wrong on gold, wrong on indices, wrong on JPY crosses, and wrong on every account not denominated in USD - which is to say, wrong exactly where oversizing hurts. This one asks your server instead. It reads the tick value, tick size, point size, volume step and margin requirements actually published for the symbol on your chart, so the number it gives you is the number your account will accept. How it works Attach i
FREE
TrendVision AI
Murtadha Majid Jeyad Al-Khuzaie
TrendVision AI – Smart Trend Channels & Price Forecasting for MetaTrader 5 Discover market structure and explore potential future price direction with TrendVision AI, an advanced technical indicator for MetaTrader 5 that combines automatic trendline analysis with a machine-learning-based price forecasting model. How Does TrendVision AI Work? TrendVision AI analyzes historical candlestick data within a configurable lookback window. It automatically draws two trendlines directly on the chart:
FREE
MSX Hybrid Heiken Scalper Overview MSX Hybrid Heiken Scalper is a MetaTrader 5 indicator based on a modified Heiken Ashi methodology with closed-bar smoothing. The indicator is designed to display trend direction through color-coded candles while reducing sensitivity to short-term market fluctuations. All calculations are performed using completed candles, allowing historical values to remain fixed after bar close. Features • Modified Heiken Ashi calculation • Closed-bar processing • Color-code

FREE
MT5 History Checker Can you trust the historical data behind your MT5 backtest? MT5 History Checker is a diagnostic utility designed to identify missing periods and coverage problems in the historical data supplied by your MetaTrader 5 broker. Select the symbol and date range you want to examine and run the checker. The utility analyses the available history and provides a clear PASS, WARNING or FAIL result. What it checks Historical tick-hour coverage M1 historical-data coverage Missing periods
FREE
概要 Heiken Ashi Smoothwaveは、メインチャートウィンドウ上でチャートを直接スムージングされた平均足キャンドルに変換し、標準キャンドルを置き換えてよりクリーンなトレンドビューを提供します。別ウィンドウ不要、シンプルな表示。 動作の仕組み 各バーで実際の価格データから平均足のOHLC値を計算します。 カラー表示された平均足キャンドルをメインチャート上に直接描画します。 ネイティブのチャートキャンドルを自動的に非表示にし、平均足キャンドルのみを表示します。 インジケーターを削除すると、標準キャンドルが自動的に復元されます。 入力パラメータ 設定可能なパラメータはありません。アタッチするだけで使用できます。 推奨設定 あらゆる銘柄、あらゆる時間足に対応。Forex、ゴールド、指数、MetaTrader 5で利用可能なすべての銘柄で動作します。 スクリーンショット Heiken Ashi Smoothwave適用後のチャート、ネイティブキャンドルは自動的に非表示。 免責事項 本インジケーターはトレンド分析のための視覚的ツールであり、売買シグナルを生成するものではあ
FREE
Follow The Line MT5
Oliver Gideon Amofa Appiah
4.6 (35)
This indicator obeys the popular maxim that: "THE TREND IS YOUR FRIEND" It paints a GREEN line for BUY and also paints a RED line for SELL. (you can change the colors). It gives alarms and alerts of all kinds. IT DOES NOT REPAINT and can be used for all currency pairs and timeframes. Yes, as easy and simple as that. Even a newbie can use it to make great and reliable trades. NB: For best results, get my other premium indicators for more powerful and reliable signals. Get them here: https://www.m
FREE
XAU VWAP Mean Reversion H4 Expert Advisor for MetaTrader 5 — Gold / XAUUSD focus Version: 1.00 What it is XAU VWAP Mean Reversion H4 is an Expert Advisor for gold on the H4 chart. Intraday VWAP mean-reversion style participation on gold H4. Built for structured automated participation — not grid , not martingale . Evaluate on your broker and risk profile before any live use. This product is a technical system . Exact thresholds and entry equations remain internal product design and are not publ
FREE
RiskCompass Panel MT5 1. The Problem and the Approach You have a position idea, and the first real question is always the same: how much of this account am I about to put at risk, and can the account carry it. The information that answers that question is scattered across half a dozen windows. Balance is on one tab. Margin level is somewhere else. The spread you just paid is visible only if you look at the instrument row. The server day, which decides whether your daily loss limit has already be
FREE
JT360 DNA Mini PnL Pointer V1.04 Public Компактно. Наглядно. Всегда перед глазами. JT360 DNA Mini PnL Pointer — это лёгкий индикатор для MetaTrader 5, который отображает суммарную текущую прибыль или убыток по всем открытым позициям текущего символа графика. Компактная индикация непосредственно на графике объединяет PnL относительно первоначального риска в формате R, тонкую мини-полоску и настраиваемую цветовую матрицу. Фирменные цвета JT360 — бирюзовый и пурпурный — выделяют крайние значения и
FREE
Note from Developer: This is the lite version of the Double TMA with Bands Indicator. You can find the paid version that comes with alerts and on screen signal arrows built in here . I will also be selling an EA based on this trading system soon once all backtesting and optimization have been completed. Unlock your trading potential with the Double TMA Indicator with Reversal Detection! Designed for swing and reversal trading, this versatile tool integrates two Triangular Moving Averages (
FREE
IMPORTANT NOTE: This is a professional Trade Management Utility and on-chart assistant. It is NOT an automated trading robot. It does not open trades on its own. The UltraFast Trade Manager MT5 is the ultimate execution and risk-management suite designed to give you absolute control over your manual and algorithmic trades. When managing multiple positions, calculating complex net break-even points, or constantly monitoring the economic calendar, hesitation can lead to costly mistakes. This utili
FREE
High Low Open Close
Alexandre Borela
4.98 (46)
このプロジェクトが好きなら、5つ星レビューを残してください。 このインジケータは、指定されたためのオープン、ハイ、ロー、クローズ価格を描画します 特定のタイムゾーンの期間と調整が可能です。 これらは、多くの機関や専門家によって見られた重要なレベルです トレーダーは、彼らがより多くのかもしれない場所を知るために有用であり、 アクティブ。 利用可能な期間は次のとおりです。 前の日。 前週。 前の月。 前の四半期。 前年。 または: 現在の日。 現在の週。 現在の月。 現在の四半期。 現年。
FREE
Risk Calculator EA – Utility for Precise Trade Sizing If you find this tool useful consider to  Buy me a coffee!   The Ultimate Risk Calculator is a lightweight in-chart Expert Advisor (EA) designed to help you easily and quickly calculate position size and set stop-loss / take-profit levels with full control over risk management directly on the chart. What it does? It turns manual risk decisions into fast, visual, and accurate calculations. You draw or adjust the Entry, Stop-Loss and Take-P
FREE
Position Selective Close MT5
Francisco Manuel Vicente Berardo
The Position Selective Close is a multi-symbol multi-timeframe script used to close simultaneously various positions.  General Description   The Position Selective Close   possesses   three operation modes (Intersection,   Union   and All) that control the way   as   four position features (symbol, magic number,   type   and profit) are used. The modes, available through the Selection Mode input parameter, relate to the features, available through the “Select by Feature” and “Feature” input pa
FREE
Renko subwindow
Alexandre Vincent Traber
Overview Renko SubWindowは、メインチャートに影響を与えずに、独立したインジケーターウィ ンドウ内にカラーローソク足でレンコブロックチャートを描画します。ブロックサイズは ポイントで固定するか、ATRを使ってボラティリティに応じて動的に調整できます。 How it works 現在の銘柄/時間足の終値からレンコブロックを再構築します。 価格が前のブロックの終値から設定したブロックサイズを超えると新しいブロックが形成 されます。 ブロックは色付きローソク足として表示され、陽線・陰線の色が区別 されます。 新しいバー形成時、または時間足/履歴変更時のみ再計算し、軽量で 安定した動作を保ちます。 Inputs Renko_BrickPoints: 固定ブロックサイズ(ポイント);0の場合はATRを使用 Renko_ATR _Period: BrickPointsが0の場合のATR期間 Renko _MaxBricks: ウィンドウに表示する最大ブロック数 Recommended setup 任意の銘柄・時間足で使用可能。主要 Forexペアではブロックサイズ50-15
FREE
Description : Rainbow MT5 is a technical indicator based on Moving Average with period 34 and very easy to use. When price crosses above MA and MA changes color to green, then this is a signal to buy. When price crosses below MA and MA changes color to red, then this is a signal to sell. The Expert advisor ( Rainbow EA MT5 ) based on Rainbow MT5 indicator is now available here . MT4 version is available here .
FREE
Important Lines
Terence Gronowski
4.88 (24)
This indicator displays Pivot-Lines, preday high and low, preday close and the minimum and maximum of the previous hour. You just have to put this single indicator to the chart to have all these important lines, no need to setup many single indicators. Why certain lines are important Preday high and low : These are watched by traders who trade in a daily chart. Very often, if price climbs over or falls under a preday low/high there is an acceleration in buying/selling. It is a breakout out of a
FREE
Trade Behavior Mirror は、自分の口座の確定した取引履歴だけを読み、「損失が確定した直後に、自分のふだんの水準より大きいロットで新規ポジションを開いた」というパターンを1つだけ数えるツールです。予測も助言もしません。パネルに出るのは、すでにこの口座で起きたことの実測値だけです。 数字の作り方: 全銘柄・全マジック番号を対象に、最大31日分の確定した約定を読み込みます(チャートの銘柄に限らない、口座全体の集計です)。当日より前の30日間から、1日あたりの新規エントリー件数の中央値と、そのエントリーのロットの中央値を求めます。平均ではなく中央値を使うのは、1件だけ大きな取引があっても基準値全体が引きずられないようにするためです。その30日間のエントリーが5件に満たない場合は、十分な標本が無いということなので、無理に数字を出さず「Collecting history」と表示します。 核となる集計(画面では Entries within 10min of a loss, at above-median lot: の行): 新しいエントリーのたびに、その直前10分以内に損
FREE
Эксперт  MACD_LevelTrader MT5   создан для торговле валютной пары XAUUSD. Данная версия это наработки того, что можно извлечь  из  индикатора MACD и Moving Average.  Важно   перед тестированием изменить настройку с 1000 на 5000                       Offset in points UP from SMA200 for sell              5000                       Offset in points DOWN from SMA200 for buy        5000   Тайм фрейм  М5. Два варианта логики, П араметр  true=вход по уровню  MACD +   SMA200, false=вход по MACD  Тестиру
FREE
Indicator Test Report
Narayanan Mohanan Mohanan Krishnan
MetaTrader 5 のIndicator Test Report — インジケーターが実際にどのように動作するかを示す再描画チェッカーおよびインジケーター テスター コンパイルされたインジケーターの内部を見ることはできません。Indicator Test Reportは、購入、作成、または MetaTrader に組み込まれたあらゆるインジケーターを読み込み、再描画するのか、どのくらいの履歴が必要なのか、実際に何を公開するのかなど、説明では説明できない質問に答えます。行動を報告してくれます。採点はしません。 ストラテジーテスターに​​任意のインジケーターをロードすると、その動作の 12 の側面に関する平易な言語のレポートが得られます。つまり、発行するバッファーの数、値が意味を持つ前にどれだけの履歴が必要か、閉じたバーの値がその後変更されるかどうか、読み取りにかかるコストなどです。 指標が優れているかどうかについてのスコアや合格点、評決はありません。観察されたことと、それが何を証明し、何が証明しないのかだけが考慮されます。 答えは何ですか 1. バッファー。 インジケーターが実際に
FREE
Girassol Sunflower MT5 Indicator
Saullo De Oliveira Pacheco
3.86 (7)
This is the famous Sunflower indicator for Metatrader5. This indicator marks possible tops and bottoms on price charts. The indicator identifies tops and bottoms in the asset's price history, keep in mind that the current sunflower of the last candle repaints, as it is not possible to identify a top until the market reverses and it is also not possible to identify a bottom without the market stop falling and start rising. If you are looking for a professional programmer for Metatrader5, please
FREE
Risk Manager – Account Protection Tool Risk Manager is an Expert Advisor for MetaTrader 5 designed to protect your trading account by applying automatic risk management rules. This tool does not open trades . It continuously monitors your account and enforces predefined limits to help prevent excessive losses and maintain disciplined trading. Risk Manager works in the background and can manage positions opened by manual trading or other Expert Advisors. It is particularly useful for: • Manual tr
FREE
RSI back arrows
Smaylle Rafael Coelho Mariano
The   RSI Back Arrows   indicator is a powerful tool designed for traders who rely on the Relative Strength Index (RSI) to identify potential market reversals. This indicator specifically highlights when the RSI has exited the   oversold   or   overbought   zones, providing clear visual signals to inform trading decisions. Key Features: Visual Cues : The indicator marks arrows on the chart when the RSI crosses back into a neutral zone, making it easy to spot potential entry and exit points. Over
FREE
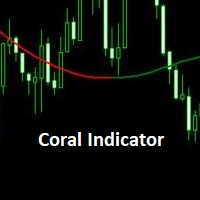
Coral trend is   a trend-following indicator that is widely popular among FOREX traders . It is usually used as a confluence with other indicators. It uses combinations of moving averages with complex smoothing formulas! It has two configurable parameters: Coefficient   - smoothing ratio (*) Applied price Calculation: Coral = (-0.064) * B6 + 0.672 * B5 - 2.352 * B4 + 2.744 * B3
FREE
このプロダクトを購入した人は以下も購入しています
Trade Assistant MT5
Evgeniy Kravchenko
4.43 (216)
取引 ごとのリスクの 計算、新規注文 の 簡単 な 設置、部分的 な 決済機能 を 持 つ 注文管理、 7 種類 のトレーリングストップなど 、便利 な 機能 を 備 えています 。 追加の資料と説明書 インストール手順   -   アプリケーションの手順   ライン機能 チャート上にオープニングライン、ストップロス、テイクプロフィットを表示します。この機能により、新規注文を簡単に設定することができ、注文を出す前にその特徴を確認することができます。   リスク計算 リスク計算機能は、設定されたリスクとストップロス注文のサイズを考慮して、新規注文のボリュームを計算します。ストップロスの大きさを自由に設定できると同時に、設定したリスクを守ることができます。 Lot calc ボタン - リスク 計算 を 有効 / 無効 にします 。 Risk フィールドでは 、必要 なリスクの 値 を 0 から 100 までのパーセンテージまたは 預金通貨 で 設定 します 。 設定」 タブで 、 リスク 計算 の 種類 を 選択 します :「 $ 通貨」、「 % 残高」、「 % エクイティ 」、「
Trade Manager EAへようこそ。これは、取引をより直感的、正確、そして効率的にするために設計された究極の リスク管理ツール です。これは単なるオーダー実行ツールではなく、包括的な取引計画、ポジション管理、リスク管理のためのソリューションです。初心者から上級者、迅速な実行を必要とするスキャルパーまで、Trade Manager EAはあらゆるニーズに対応し、為替、指数、商品、暗号通貨などさまざまな市場で柔軟に対応します。 Trade Manager EAを使用すると、複雑な計算が過去のものになります。市場を分析し、エントリーポイント、ストップロス、テイクプロフィットのレベルをチャート上のラインでマークし、リスクを設定するだけで、Trade Managerが最適なポジションサイズを即座に計算し、SLとTPをピップ、ポイント、口座通貨でリアルタイムに表示します。すべての取引が簡単かつ効果的に管理されます。 主な機能: ポジションサイズ計算機 :定義されたリスクに基づいて取引サイズを瞬時に決定します。 簡単な取引計画 :エントリー、ストップロス、テイクプロフィットを設定するためのド
Farmed Hedge Yield Farming | All Markets (Manual - Hybrid - Semi/Automated EA) VERIFIED TRADING RESULTS - Farmed Hedge Yield Axi Copy:  https://www.mql5.com/en/signals/2356376 - Farmed Hedge Yield Exn Copy:   https://www.mql5.com/en/signals/2356404 - Farmed Hedge Yield V Copy:  https://www.mql5.com/en/signals/2357156 IMPORTANT NOTICE: FarmedHedge is a MANUAL-FOCUSED TRADING UTILITY ,not a fully automated EA. Results shown on this Signal include manual trades and overall strategic management.
Telegram to MT5 Multi-Channel Copier   は、 Telegram と Discord チャンネルのトレードシグナルを MetaTrader 5 へ自動コピーします。ボット不要、ブラウザ拡張不要、手動コピー不要。Telegram や Discord にシグナルが届くと、EA が数秒であなたのターミナルに注文を出します。 さらに、チャンネルをコピーする前に、内蔵バックテスターでそのチャンネルがあなたの口座でどう動いたかを確認できます。 製品は 2 つのコンポーネントで構成されます:Telegram チャンネルを監視する Windows アプリと、MT5 ターミナルでシグナルを執行する本 EA です。MT4 版もあります   こちら . 購入前にお試しください:   アプリは無料でダウンロードできます。ご自身のチャンネルを接続し、各シグナルがどのように読み取られるかをご確認ください。Backtest タブと実際の取引には、購入またはレンタルした EA が必要です。このページの無料デモはストラテジーテスターでのみ動作し、テスターでは Telegram と D
Local Trade Copier EA MT5
Juvenille Emperor Limited
4.94 (149)
Local Trade Copier EA MT5 は、同一の Windows PC または Windows VPS 上で稼働する複数の MetaTrader 5 口座間で、取引をコピーおよび管理するための高速で柔軟なトレードコピーツールです。 ローカルでの取引同期に加え、Receiver 側でロットサイズ、リスク管理、取引フィルター、シンボルマッピング、取引管理、口座保護を個別に設定できます。 Transmitter と Receiver のターミナルは約 1分 で設定でき、同一ブローカーまたは異なるブローカーの口座間で、手動取引や EA による取引をコピーできます。適切な条件下では、ローカルの MetaTrader ターミナル間で取引情報を 0.5秒未満 で同期できます。実際の約定速度は、ブローカーのレイテンシー、ネットワーク状況、PC/VPS の性能、ターミナルの負荷によって異なります。 ご購入前に無料デモをお試しください Local Trade Copier EA MT5 の完全機能版無料デモ を、MT5 デモ口座で 1回につき4時間 テストできます。 Local Trad
Strategy Ledger Pro
Abdullah Uygar Tuna
5 (14)
日本語に対応しました。 Strategy Ledger Pro は、MetaTrader 5 用の読み取り専用の口座分析パネルです。口座の成績をエキスパートアドバイザー(EA)、戦略、銘柄、マジックナンバーごとに分け、それぞれが実際にどれだけ貢献しているかを明らかにします。 パネルは 11 言語に対応しています:English、Français、Deutsch、Español、Italiano、Português、Русский、Türkçe、中文、日本語、한국어。 デモをダウンロードする前に。 Market では、有料製品のデモはストラテジーテスター内でのみ実行されます。このパネルはご自身の口座の取引を分析しますが、ストラテジーテスターには読み取る口座履歴がないため、デモは空のパネルで起動し、その旨を表示します。これはデモの仕組みによるもので、製品の制限ではありません。 この説明内の動画では、実口座でのパネルの動作をご覧いただけます。 すべての機能を解説した詳しい マニュアル (英語)と、情報交換やお知らせのための AureusAI Trading Suite グループをご用意し
自分の取引ルールで Telegram のシグナルをコピー Telegram to MT5 Signal Trader は、Telegram の公開・非公開チャンネルやグループから、テキスト形式の取引シグナルを MetaTrader 5 へ自動でコピーします。1つのデスクトップアプリで複数の配信者と MT5 口座を管理し、 配信者ごとにリスクと取引設定を個別に指定 できます。 シグナルのコピーに Telegram ボットや API 設定は必要ありません。 電話番号または QR コードでご自身の Telegram アカウントにログインし、すでに参加しているチャンネルやグループを選ぶだけです。ボットの作成や、Telegram API トークン、API ID、API hash の入力は不要です。 ポジションサイズを選び、複数の利確水準に分けて決済し、建値へのストップ移動やトレーリングストップを自動化できます。配信者のシグナルを受け取りながら、実際の取引方法は自分で管理できます。 本製品は、この MT5 エキスパートアドバイザ(EA)と、必須の Windows 連携アプリで構成されます。 インス
TradePanel MT5
Alfiya Fazylova
4.88 (170)
Trade Panelは多機能なトレーディングアシスタントです。アプリには手動取引用の50以上のトレーディング機能が搭載されており、ほとんどの取引作業を自動化することができます。 アプリの説明書: https://www.mql5.com/en/blogs/post/756482 デモ口座用アプリの試用版: https://www.mql5.com/en/blogs/post/750865 アプリのインストール方法: https://www.mql5.com/en/blogs/post/756239 アプリをビジュアルモードでテストする方法: https://www.mql5.com/en/blogs/post/770277 VPSのMetaTraderにアプリをインストールする方法: https://www.mql5.com/en/blogs/post/770190 取引。 ワンクリックで取引操作を行うことができます: リスクを自動計算して指値注文やポジションを開く。 複数の注文やポジションをワンクリックで開く。 注文のグリッドを開く。 保留中の注文やポジションをグループごとに閉じる
VirtualTradePad PRO SE MT5 — MetaTrader 5向けプロフェッショナル取引コントロールセンター VirtualTradePad PRO SE は、 MetaTrader 5 向けのプレミアムなチャートベースの取引パネルであり、トレード管理ワークスペースです。より速い執行、明確なポジション管理、構造化されたトレード管理、視覚的なレベル計画、そしてチャート上で完結するプロフェッショナルなワークフローを求めるトレーダー向けに設計されています。 これは単なる BUY / SELL パネルではありません。PRO SE は、手動取引、予約注文、ポジション管理、部分決済、バスケット損益管理、平均化レベル、ATMルール、シグナル監視、リアルタイム市場情報、ストラテジーテスター (Strategy Tester) ワークフロー、VPS向け運用を、1つの連携されたインターフェースに統合します。 MT4版 | 完全な説明とスクリーンショット | 購入方法 | インストール方法 | ログファイルの取得方法 | テストと最適化の方法 | Expforex のすべての製品 PRO
================================================================================ POC BREAKOUT - V20.72. Full Professional Grade Toolkit ================================================================================ POC Breakout is a full MetaTrader 5 trading dashboard for discretionary traders who want breakout signals, Point of Control (POC) context, volume profiles, order flow, market structure, news, alerts, and advanced trade planning in one professional workspace. Attached directly to you
REVDEN AI Desk:あなた自身の AI との一つの会話で、REVDEN のマーケットコンテキストをもとにトレードを運営する トレードのすべてを一つの会話で運営する姿を想像してみてください。 REVDEN AI Desk はそれを MetaTrader 5 にもたらします。あなた自身の AI に相場をどう読んでいるかを尋ねると、AI はあなたが取引する銘柄について REVDEN の完全なコンテキストをもとに答えます。銘柄の状態、リスク像、今後の指標発表まで含めてです。AI の提案はエントリー、ストップ、ターゲット、リスクとともに届き、合うものをあなたが承認します。ルールの変更も同じ方法です。変えたい点を書けば、AI が新しいルールブックの草案を作り、採用するかどうかはあなたが決めます。会話の周りには、マーケット全体が一つの画面にまとまっています。 デスクとセットアップガイドをご覧ください。 すべての画面、すべての設定、そしてあなた自身の AI との最初のステップ: stein.investments/products/revden-ai-desk AI との一つの会話、マーケッ
MT5 to Telegram Signal Provider は、Telegramのチャット、チャンネル、またはグループに 指定された シグナルを送信することができる、完全にカスタマイズ可能な簡単なユーティリティです。これにより、あなたのアカウントは シグナルプロバイダー になります。 競合する製品とは異なり、DLLのインポートは使用していません。 [ デモ ] [ マニュアル ] [ MT4版 ] [ Discord版 ] [ Telegramチャンネル ]  New: [ Telegram To MT5 ] セットアップ ステップバイステップの ユーザーガイド が利用可能です。 Telegram APIの知識は必要ありません。必要な全ては開発者から提供されます。 主な特長 購読者に送信する注文の詳細をカスタマイズする機能 例えば、Bronze、Silver、Goldといった階層型のサブスクリプションモデルを作成できます。Goldサブスクリプションでは、すべてのシグナルが提供されます。 id、シンボル、またはコメントによって注文をフィルターできます 注文が実行されたチャート
Exp COPYLOT CLIENT for MT5
Vladislav Andruschenko
3.97 (35)
MetaTrader 5 用のプロフェッショナル取引コピー機 MetaTrader 向けの高速・高性能・信頼性の高い 取引コピー機 です。 COPYLOT は、MT4 と MT5 のターミナル間で Forex 取引をコピーでき、 Hedge 口座と Netting 口座の両方に対応しています。 COPYLOT MT5 版の対応構成: - MT5 Hedge → MT5 Hedge - MT5 Hedge → MT5 Netting - MT5 Netting → MT5 Hedge - MT5 Netting → MT5 Netting - MT4 → MT5 Hedge - MT4 → MT5 Netting MT4 版 完全な説明 + DEMO + PDF 購入方法 インストール方法 ログファイルの取得方法 テストと最適化の方法 Expforex のすべての製品 MT4 ターミナルへのコピーも可能です(MT4 → MT4、MT5 → MT4): COPYLOT CLIENT for MT4 COPYLOT は、2台、3台、さらには10台のターミナル間で同時に動作できる、プロフェッ
News Trade EA MT5
Konstantin Kulikov
4.55 (11)
僕自身が数年間使っている便利なロボットをご紹介します。半自動モードでも完全自動モードでもお使いいただけます。 >>> Chat <<< 当プログラムは経済指標カレンダーで発表されるニュースをもとにした取引の柔軟な設定が可能です。戦略テスターでは確認不可です。実際の取引のみです。 最新の設定アーカイブをダウンロードしてください: https://www.mql5.com/en/blogs/post/747929 シグナルモニタリング: https://www.mql5.com/en/signals/author/test-standart 当該エキスパート・アドバイザーのためのカスタマイズ設定セットを作る場合は、ブログの全パラメータの説明を参照してください :   https://www.mql5.com/en/blogs/post/748545 。 基本的なデフォルト設定について 一つのチャートからGBPとの通貨ペア(GBPUSD、EURGBP、GBPJPY、GBPCAD、GBPAUD、GBPCHF)で取引をします。GBPは最もボラティリティの高い通貨のため、取引が成功するチ
Trade copier MT5
Alfiya Fazylova
4.61 (57)
Trade Copierは、取引口座間の取引をコピーして同期するように設計された専門的なユーティリティです。 コピーは、同じコンピューターまたはvps にインストールされている、サプライヤーのアカウント/端末から受信者のアカウント/端末に行われます。 購入する前に、デモ アカウントでデモ バージョンをテストできます。 デモ版 こちら 。 詳細な説明は こちら 。 主な機能と利点: MT5ネッティングアカウントを含む、MT5> MT5、MT4> MT5、MT5> MT4のコピーをサポートします。 高いコピー速度(0.5秒未満)。 ベンダーモードと受信者モードは同じ製品内に実装されています。 チャートから直接リアルタイムでコピーを制御できる、簡単で直感的なインターフェイス。 接続が切断されたり、端末が再起動されたりしても、設定と位置が失われることはありません。 コピーするシンボルを選択できます。また、受信者のシンボルを置き換えることもできます(例:EURUSD> USDJPY)。 各シンボルごとにコピーの個別設定を行うことができます。 バックコピーをサポートします。 特定の注文のみのコピー
Seconds Chart - MetaTrader 5で秒足チャートを作成するユニークなツールです。 Seconds Chart を使用すると、秒単位のタイムフレームでチャートを構築でき、標準的な分足や時間足チャートでは得られない柔軟性と分析精度を実現します。例えば、 S15 は15秒足を表します。カスタムシンボルをサポートしているインジケーターやEAをすべて使用できます。標準的なチャートと同様に便利に操作できます。 標準的なツールとは異なり、 Seconds Chart は超短期のタイムフレームでも高い精度と遅延なく作業できるように設計されています。 Free Demo: Seconds Chart v2.29 Demo.ex5 無料デモをダウンロードしてご自身でお確かめください: 完全機能版 - すべての機能が利用可能 24時間テスト - 精度と利便性を評価するのに十分な時間 デモ口座のみ - ほとんどのブローカーで簡単に開設可能 GBPCADチャートのみ - ほとんどの端末で利用可能 これらの制限はデモ版のみに適用されます。製品版は、あらゆる口座タイプ(リアル、デモ、コンテス
The Patch It never opens a trade. It walks behind the ones that did. Every open position, every pending order — checked twice a second for the one thing that's easy to forget: a stop, a target. Found bare, it doesn't ask. It writes the missing number in, measured in points from wherever the position began, and moves on to the next. No strategy, no opinion on direction. Just the quiet assumption that nothing should ever sit on the market unprotected — not because someone decided it shouldn't,
EA Overfitter
Stephen J Martret
5 (1)
That backtest looks great. But will it still be making money tomorrow, next week, next month? EA Overfitter re-runs your EA on 100 price histories it has never seen. One score tells you if the edge is real. A backtest tells you what an EA did on one price history — the one that happened to occur. What you cannot tell from it is how much of that result was the strategy and how much was the particular path. EA Overfitter answers that. It builds up to 100 synthetic price histories your EA has n
次回アップデート — バージョン 2.52 近日公開!【新機能】 市場分析とトレードワークフローを強化する、4つの主要な新機能にご期待ください 皆様のトレードニーズに応える4つの新機能により、市場分析を次のレベルへと引き上げます。新機能をご紹介します: 1. TRADE OVERVIEW DASHBOARD 2. CONFLUENCE AT ZONE 3. STRONG & WEAK HIGH/LOW 4. OTE 1. TRADE OVERVIEW DASHBOARD 市場全体の状況をより簡単に把握できるダッシュボードです。トレード判断をサポートするガイダンスを提供し、市場分析とトレード計画を体系的に行えるよう支援します。すべてを1つの画面で確認できます。 マルチタイムフレーム市場概要(Multi-Timeframe Market Overview) 市場の方向性と価格構造をより明確に把握 市場状況をすばやく確認 体系的な市場分析とエントリー計画のためのガイダンス 2. CONFLUENCE AT ZONE 価格が重要なゾーンに入るとき…いくつのサポート要因が一致しているかを確認で
The product will copy all telegram signal to MT5 ( which you are member) , also it can work as remote copier.  Easy to set up, copy order instant, can work with almost signal formats, image signal,  s upport to translate other language to English Work with all type of channel or group, even channel have "Restrict Saving Content", work with  multi channel, multi MT5 Work as remote copier: with signal have ticket number, it will copy exactly via ticket number. Support to backtest signal. How to s
RETAILBERG FOOTPRINT CHART PRO — Order-Flow Workspace for MetaTrader 5 Version 7.00  |  Professional System  |  31 tools  |  One chart A full 150-page illustrated User Manual is included. Please read the full manual to understand this feature packed footprint chart elements and ui. https://www.mql5.com/en/blogs/post/777982 DEMO / STRATEGY TESTER — PLEASE READ FIRST
25% discount on the release of the tool: only for the next 3 buyers Send a message to receive a demo version. AstroTrade Trading Assistant AstroTrade is a comprehensive multi-functional trading utility developed for the MetaTrader 5 platform. It integrates essential tools for trade execution, risk management, and technical monitoring into a single unified interface. The application is designed to assist traders in managing their daily operations through a visual and structured environment. Vi
HINN MAGIC ENTRY – the ultimate tool for entry and position management! SIMPLE. FASTEST. INTUITIVE. MAX AUTOMATED. Place orders by selecting a level directly on the chart! full description   ::  demo-version  :: 60-sec-video-description Key features: - Market, limit, and pending orders - Automatic lot size calculation - Automatic spread and commission accounting - Unlimited partitial take-profits  - Breakeven and trailing stop-loss and take-profit  functions - Invalidation leves - Intuitive, a
Timeless Charts
Samuel Manoel De Souza
5 (9)
Timeless Charts is an all-in-one trading utility for professional traders. It combines custom chart types such as Seconds Charts and Renko with advanced order flow analysis using Footprints , Clusters , Volume Profiles , VWAP studies, and anchored analysis tools for deeper market insight. Trading and position management are handled directly from the chart through an integrated trade management panel , while Market Replay and Virtual Accounts provide environments for practicing trading skills and
Floor Watch
Syed Tauqeer Hussain Shah
Floor Watch One number, watched every thirty seconds: how far equity has fallen since the day began — or since its highest point, if it's told to trail the peak instead of the open. Cross the line and it doesn't argue. Every open position closes, every pending order vanishes, and anything that slips through afterward gets shut the moment it appears. Not asked. Removed. The floor holds until the clock turns 5 AM Pakistan time — then, and only then, does the day start over. One rule. No except
Telegram To MT5 — シグナルコピア Telegram チャンネルのトレードコールを、実際の MT5 注文に変換します — 自動で、好きなだけの口座に対応し、リスクとルールは完全にあなたの管理下に置けます。 Telegram To MT5 は、あなたが Telegram で既にフォローしている VIP / シグナルチャンネルを MetaTrader 5 端末に接続します。無料の付属デスクトップアプリがメッセージを読み取り(ボットを禁止しているチャンネルでも可能)、この EA があなたの口座でそれらを執行します — あなた自身のリスク設定、シンボルマッピング、テイクプロフィット処理、セッションおよびニュースフィルターを適用します。 これはシグナルコピアであり、ブラックボックス戦略ではありません。どのチャンネルを信頼するか、各トレードのロットと管理方法をあなたが決めます。 ステップバイステップの設定と付属アプリのインストールガイド 仕組み [あなたの Telegram チャンネル] -> [付属デスクトップアプリ] -> [MT5 + この EA] -> 注文 付属デスクトッ
Power Candles Strategy Scanner - 自動最適化型マルチシンボル設定ファインダー パワーキャンドル・ストラテジー・スキャナーは 、パワーキャンドル・インジケーターを駆動するのと全く同じ自己最適化エンジンを、マーケットウォッチに登録されているすべての銘柄に対して並行して実行します。1つのパネルで、現在統計的に取引可能な銘柄、各銘柄で勝率の高い戦略、最適なストップロス/テイクプロフィットの組み合わせが表示され、新たなシグナルが発生した瞬間に通知が届きます。 このツールは、Stein Investmentsのエコシステムの一部です。  18種類以上のツールをすべて閲覧し、AIを活用したセットアップの推奨を受け取り、  https://stein.investments でコミュニティに参加しましょう 市場動向を網羅。銘柄ごとに3,000件以上の自動最適化。2種類のアラート。ワンクリックでチャートを切り替えて即座にアクション。 なぜこれが必要なのか 多くのマルチ銘柄スキャナーは、 価格の動き (ボラティリティ、変動率、銘柄ごとのRSI)を表示するだけです。それ
Equity Protect Pro: 安心取引のための総合的な口座保護エキスパート 口座保護、資産保護、ポートフォリオ保護、マルチ戦略保護、利益保護、利益確定、取引セキュリティ、リスク管理プログラム、自動リスク管理、自動決済、条件付き決済、スケジュール決済、動的決済、トレーリングストップロス、ワンクリッククローズ、ワンクリック決済、ワンクリック復元などの機能をお探しなら、Equity Protect Pro が最適なプログラムです。 設定は簡単で、事前設定された条件に達すると、すべてのチャートを閉じることができ、シグナルサブスクリプションのキャンセルもサポートします(これは、すべての取引プログラムも停止することを意味します)。この時点で、新しい注文は生成されなくなり、最終的にすべての注文が閉じられ、予期せぬ損失を効果的に防止し、安心して取引できるようになります。 Equity Protect Pro (Technical Manual) Equity Protect Pro Demo Version for yo u to test   Equity Protect Pro MT4
Trader Evolution
Siarhei Vashchylka
5 (7)
" Trader Evolution " - A utility designed for traders who use wave and technical analysis in their work. One tab of the utility is capable of money management and opening orders, and the other can help in making Elliott wave and technical analysis. Manual (Be sure to read before purchasing) | Version for MT4 Advantages 1. Trading in a few clicks. Immediate and pending orders are available in the panel 2. Money management. The program automatically selects the appropriate lot size 3. Simplifies
MT5 Professional Copy Trading System(MT5版) MT5 Professional Copy Trading System は、工業レベルの超高速 LOCAL トレードコピア であり、プロトレーダー、シグナル提供者、機関レベルのマルチアカウント運用のために設計されています。一般的なクラウド型やリテール向けコピーシステムとは異なり、本システムは同一 Windows 環境で動作することを前提とした LOCAL アーキテクチャに基づいて構築されています。 工業級 LOCAL アーキテクチャ LOCAL 設計により、同一 PC または同一 Windows VPS 上で稼働する複数のターミナル間で、低遅延かつ高い安定性を実現します。不要なネットワーク依存を減らすことで、より高速な同期、正確な約定、Master と Receiver 間の高い一貫性を確保できます。これは高頻度取引や 24/7 無人運用に適した環境を提供します。 Master / Slave / Self-Copier + Cross Copy(MT4 ↔ MT5) MT5 版は Master
作者のその他のプロダクト
AlgoTrade Margin Call Levels shows the prices where your broker's margin call and stop out would start for open positions on the active chart symbol. It draws horizontal lines at each level and shows the distance to them. What it shows The current margin level, used margin and free margin. The margin call price and stop out price for the symbol, based on the account settings from your broker. The distance to each level in points, percentage and average daily ranges. The potential loss before rea
FREE
AlgoTrade Gold Range Meter shows how far the price has moved today compared with an average day. It is made for XAUUSD and works on any symbol. What it shows The average daily range of the last 20 closed days (high minus low; weekend bars and flat bars are left out). Today's range so far and the percentage of an average day it has reached, with a bar marked at 100% and 150%. Two dotted lines: today's low plus the average range, and today's high minus the average range. Today becomes an average-s
FREE
AlgoTrade Position Size Panel works out the lot size for the risk you choose. Drag three lines on the chart (entry, stop loss and take profit) and the panel shows the result at once. What it shows Lot size for a risk in percent of balance, percent of equity or a fixed amount in the account currency, rounded down to the broker lot step so the loss stays within your risk. Loss at the stop and profit at the target, in money and in percent of the balance. Reward to risk, margin needed and free margi
FREE
AlgoTrade News on Chart displays the MetaTrader 5 economic calendar directly on your chart. It draws vertical lines for events affecting the currencies of the chart symbol and lists upcoming events on a compact card, including forecast, previous, and actual values. What it shows A dotted vertical line at each event: red for high importance, orange for medium importance, and grey for low importance. Hover over a line to view the event name, time, and values. The next high-importance event with a
FREE
AlgoTrade ATR Stop Levels displays the average true range (ATR) of the chart symbol and the stop distance: ATR times a multiplier. It draws the stop for a buy and the stop for a sell on the chart, and shows the ATR on four timeframes on a card. It reads data only. What it does The ATR of the last closed bars (14 by default), on the chart timeframe or on M15, H1, H4 or D1. Stop distance equals ATR times the multiplier (1.5 by default), rounded up to whole ticks. Two dashed lines from the newest b
FREE
AlgoTrade News Impact Statistics shows how your closed trades performed around economic news. It runs on any chart and reads account data only. What it shows Trades opened near news: an event of the symbol's currencies within 30 minutes before or after entry (1 to 240 minutes). Trades held through news: an event occurring later while the trade was open. Trades away from news. For each group: the number of trades, the share of winning trades, the net result, and the average trade. The net result
FREE
AlgoTrade Basket Manager treats your open trades as one basket. It shows the net result of the basket and closes all of its trades at the net profit or the net loss you choose. It never opens a trade. What it shows The net result of the basket: floating profit, swaps and the commission paid when the trades were opened. The number of buy trades and sell trades and their lots. The break-even price of the trades on the chart symbol, drawn as a line on the chart. The prices where the basket would cl
FREE
AlgoTrade Round Number Levels draws round price levels around the price and shows on a card the levels just above and below, the distance to each, and how many times the price visited each one today. It reads data only. What it does Major levels: 100 pips on forex pairs, or a step of about 1% of the price on other symbols (for example 50 on gold). You can also set the step yourself. Minor levels: 50 pips on forex, or a smaller step such as 10 on gold. Quarter levels (25 and 75 pips) can be turne
FREE
AlgoTrade Currency Strength Meter shows the strength of each of the 8 major currencies (USD, EUR, GBP, JPY, CHF, CAD, AUD, NZD) against the other 7, ranked on a card with the strongest and the weakest. It reads data only. What it does Strength is the average move of each currency against the other 7 across the 28 pairs: since the open of today's, this week's, or this month's candle in server time, or over the last hours (4 by default). Displays a ranked list with a bar for each currency, stronge
FREE
AlgoTrade Previous Day High Low draws the previous day's high, low, and close, today's open, and the previous week's and month's high and low on the chart, displaying the price position relative to these levels on a card. It reads data only. What it does Lines for each level from the start of the current day, week, or month, showing the level's name and price. Colors adapt to dark or light charts or can be set in the inputs. A card showing the price position relative to yesterday's range (above
FREE
AlgoTrade Pivot Points draws the daily, weekly, or monthly pivot point, resistance, and support levels on the chart and shows the current price position on a card. It reads data only. What it does Five formulas: Classic, Fibonacci, Camarilla, Woodie and DeMark, based on the previous day's, week's or month's high, low and close (DeMark also uses the open). Levels from R1 and S1 up to R3 and S3, or up to R4 and S4 with Camarilla. Lines for the current period from its start, showing each level's na
FREE
AlgoTrade Line Alerts monitors the lines drawn on the chart and alerts you when the price crosses a line or when a vertical line's time is reached. A card lists each line with its level, distance from the price, and alert status. It reads data only and does not modify your lines. What it does Works with horizontal, trend, and vertical lines. Draw them as usual from Insert > Objects > Lines; each new line is watched immediately. Alerts when the chart price crosses or touches a horizontal or trend
FREE
AlgoTrade Trading Sessions draws the Sydney, Tokyo, London and New York sessions as boxes on the chart from the high to the low of each session, and shows on a card which sessions are open, when the next one opens, and each session's range against its average. It reads data only. What it does Boxes for the sessions of recent days (5 by default) on charts up to H4, with the session name and its range in points. Colors fit a dark or a light chart, or can be set in the inputs. A card with each sess
FREE
AlgoTrade Swap and Commission Tracker shows what your trades paid in commission, swap and fees, and what the next rollover may cost your open positions. It runs on any chart and reads account data only. What it shows Four periods with one click: today (from 00:00 server time), the last 7 days, the last 30 days and all history. For the period: the price result of closed trades, commission, swap, fees and charges, the net result, the number of closing deals and lots, and the cost per closed lot. T
FREE
AlgoTrade Loss Streak Guard helps you take a break after losing trades. It monitors your closed trades and pauses trading according to your rules. A trade opened during a pause is closed immediately or only reported, depending on your settings. The rules A wait after every losing trade (5 minutes by default). A longer pause after a specified number of losing trades in a row (3 losses and 1 hour by default). Each subsequent loss restarts the pause until a winning trade occurs. An optional stop fo
FREE
AlgoTrade Prop Guard watches the loss limits of your prop firm account in real time and shows them in one table: the limit, where you are now, a bar and the result. It warns you near a limit (70% by default). At the level you choose (90% by default) it closes all positions, deletes pending orders and keeps trading paused. What it checks Daily loss: from the balance at the daily reset, or from the higher of balance and equity. The limit is a % of the account size or of the start-of-day value. Max
AlgoTrade Drawdown Recovery Planner shows how far your account is below its high-water mark and the gain needed to recover. It runs on any chart and reads account data only. What it shows The high-water mark: the highest balance in the account history or the highest equity seen while the indicator runs, adjusted for deposits and withdrawals. You can also enter a custom value. Current equity, the drawdown in money and percentage, and the gain needed to return to the mark. A plan based on your inp
FREE
AlgoTrade Trading Hours Heatmap shows how your closed trades performed by the weekday and hour they were opened. It runs on any chart and reads account data only. What it shows A grid of weekdays and hours (broker server time). Saturday and Sunday rows appear when they have trades. Three measures with one click: net result, share of winning trades, and number of trades. All symbols or only the chart symbol, for the last 30 days, 90 days, 1 year or all history. The number of closed trades, the sh
FREE
AlgoTrade Account Statistics displays closed trade statistics on the chart. It runs on any chart and reads account data only. What it shows The net result of closed trades and the gain as a percentage of the starting balance. The number of closed trades, trades per week, the share of winning trades, and the profit factor. The average win, average loss, average trade, best trade, and worst trade. The longest runs of winning and losing trades. The deepest drop in closed-trade results, in money and
FREE
AlgoTrade Trade Journal records your trades automatically without manual typing. It runs on any chart and reads account data only. What it does Writes one row to a CSV file for every trade open, addition, partial close, close, and reversal. Each row includes the time, symbol, side, volume, price, stop loss, take profit, deal result, total trade result on close, magic number, reason (manual, Expert Advisor, stop loss, take profit), and comment. Takes a screenshot of the trade's symbol chart when
FREE
AlgoTrade Multi-Account Monitor shows all your MT5 accounts on one panel. Run it in each MetaTrader 5 terminal on the same computer: every copy shares its own account and shows all of them. It reads account data only. What it does Shows each account's equity and currency, floating result, margin level, today's closed result, and number of open positions. A headline at the top states "All accounts OK" or indicates how many accounts need attention. Warns when the margin level is below your limit,
FREE
AlgoTrade Weekly Trading Review displays a weekly summary of your closed trades directly on the chart, comparing the current or previous week to the preceding one alongside notes on notable patterns. It also saves each week as an HTML report. It reads account data only. What it does Displays the week's net result, number of closed trades, winning share, average win, average loss, profit factor, best day, and worst day, alongside the same metrics for the prior week. Provides notes based on your t
FREE
AlgoTrade Candle Timer displays the time remaining for the current candle next to the price, and on a card showing candles from M1 to monthly, the spread, server time, and when the symbol's market opens or closes. It reads data only. What it does Displays the time remaining for this chart's candle next to the latest candle in your chosen color and size. Shows "closed" when the market is closed. A card displaying the time remaining for M1, M5, M15, M30, H1, H4, daily, weekly, and monthly candles,
FREE
AlgoTrade Correlation Matrix shows how the symbols of your list move together, as a colored matrix on a card, with the symbols that move most with and most against the chart symbol. It reads data only. What it does Up to 10 symbols from a comma separated list (by default EURUSD, GBPUSD, USDJPY, AUDUSD, USDCAD, USDCHF, NZDUSD, XAUUSD). The chart symbol is added when it is not in the list. Finds each symbol at your broker, with the chart symbol's prefix and suffix (for example EURUSD.pc). Tabs for
FREE
フィルタ:
レビューなし
レビューに返信