MarketProfileEngine

MarketProfile Engine

Market Profile analysis, value areas and session context for MetaTrader 5

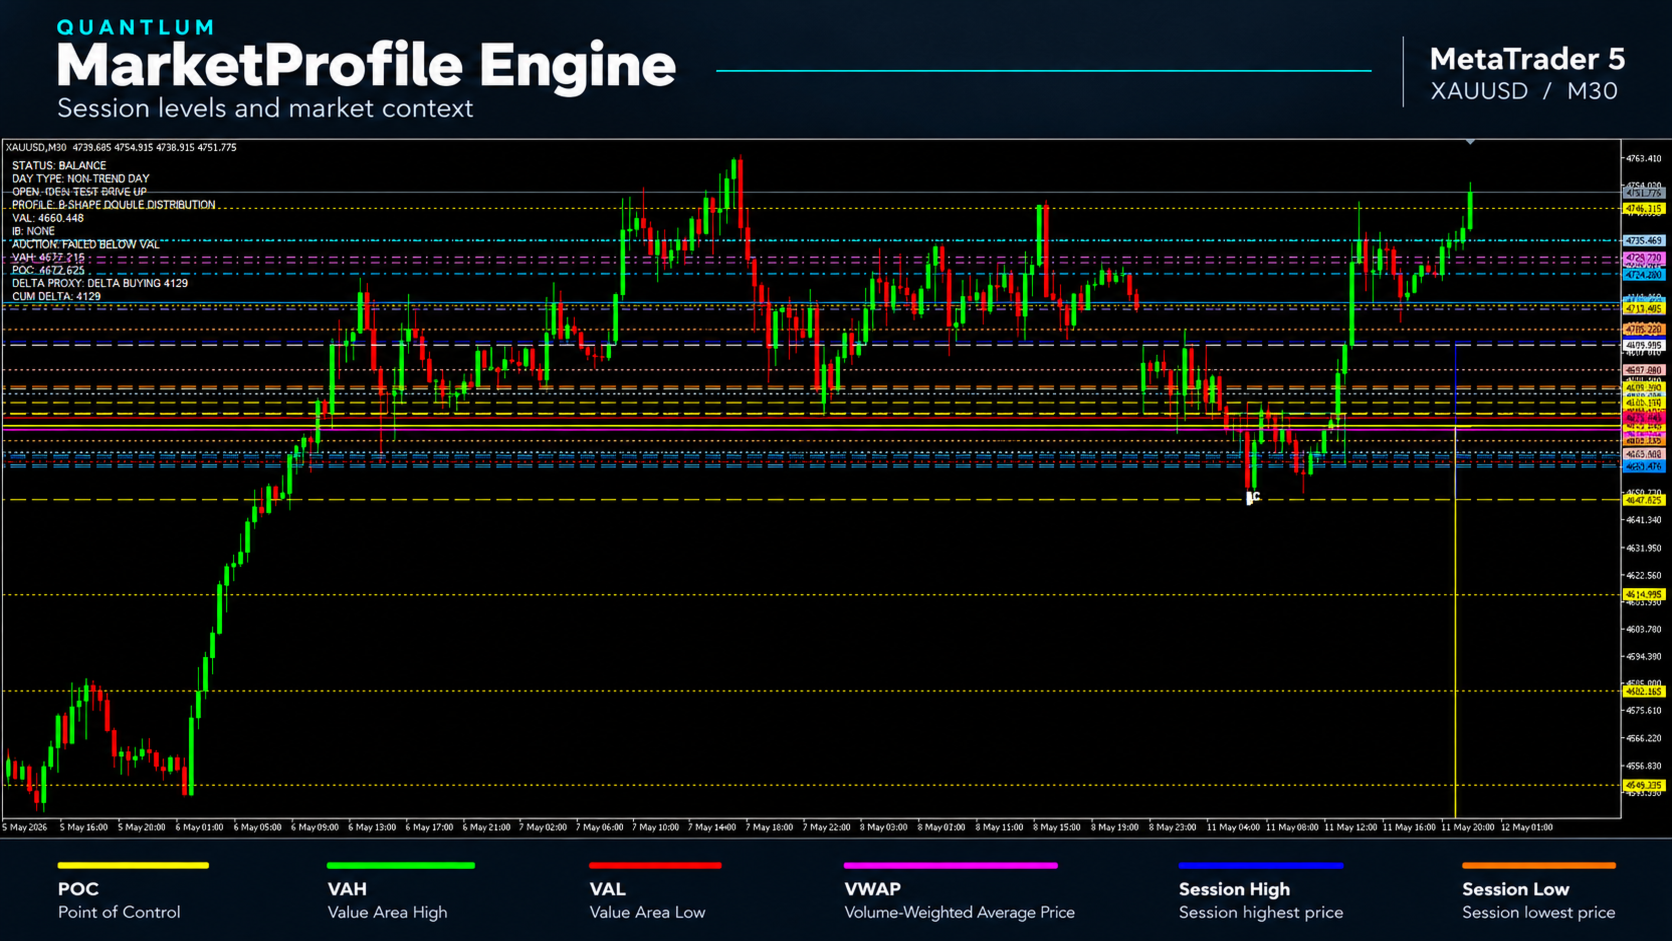
MarketProfile Engine is an advanced analysis indicator for MetaTrader 5 that brings Volume Profile, Time Price Opportunity (TPO) analysis and key market reference levels together on your chart.

It helps you examine where price is trading relative to value, follow changing bullish and bearish conditions, and study how the market responds around important levels. An integrated information panel adds context to the selected session, supporting a structured approach to chart analysis.

MarketProfile Engine is designed for traders who want to understand price movement within the broader session structure and use that information when developing their own trading scenarios.

Key features

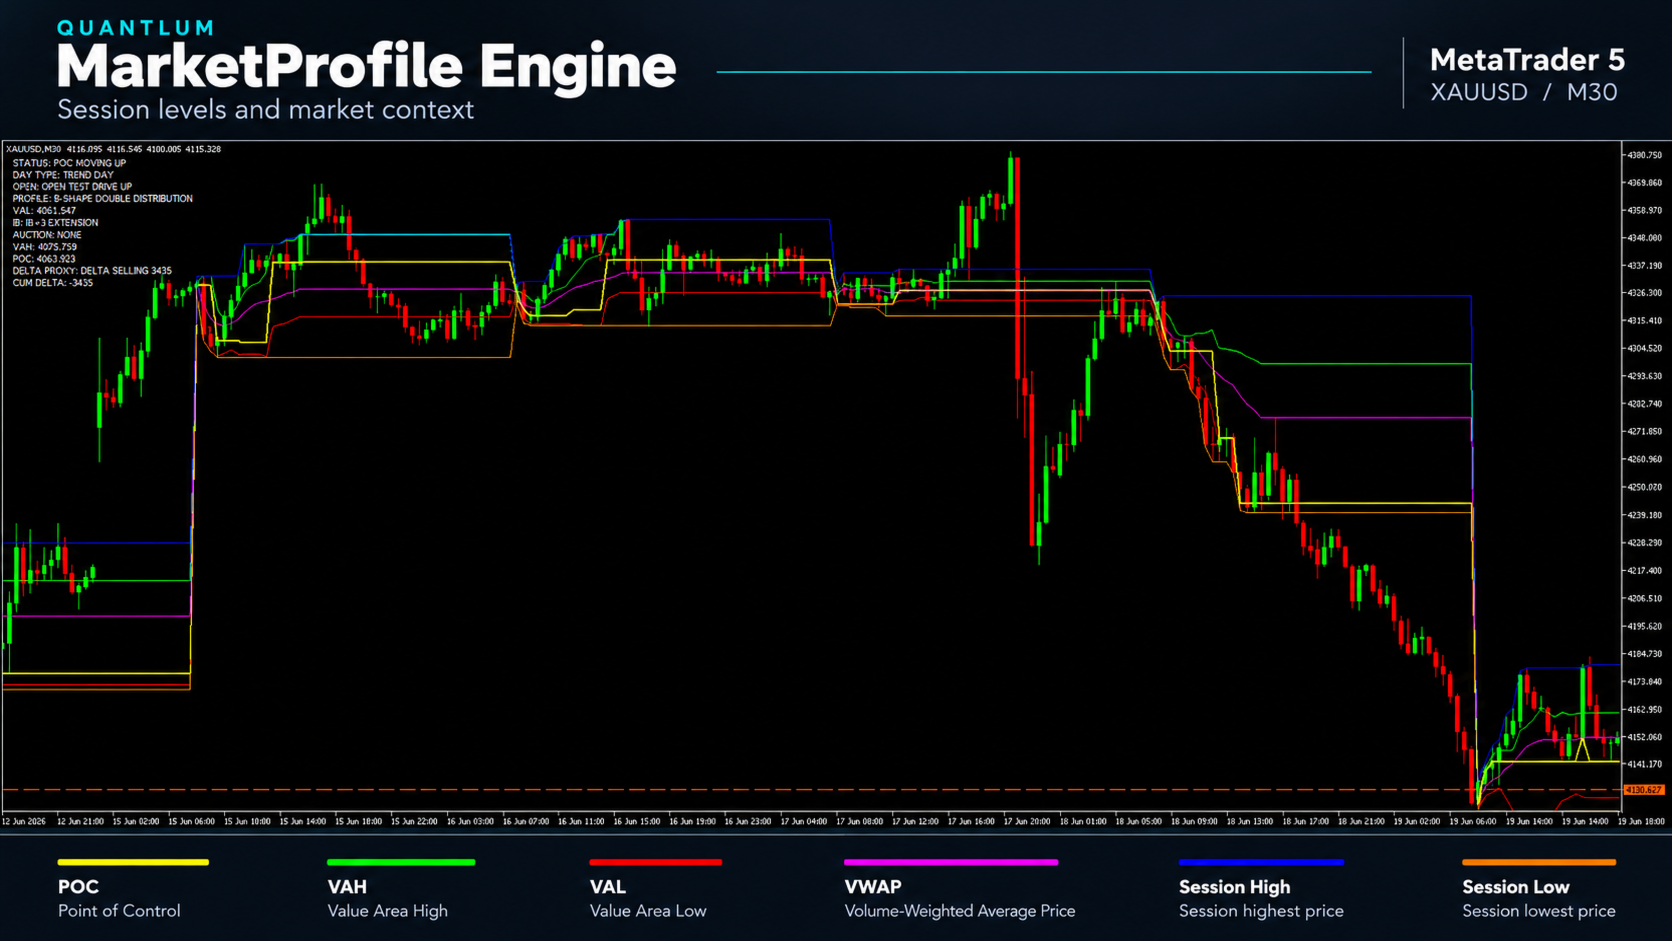
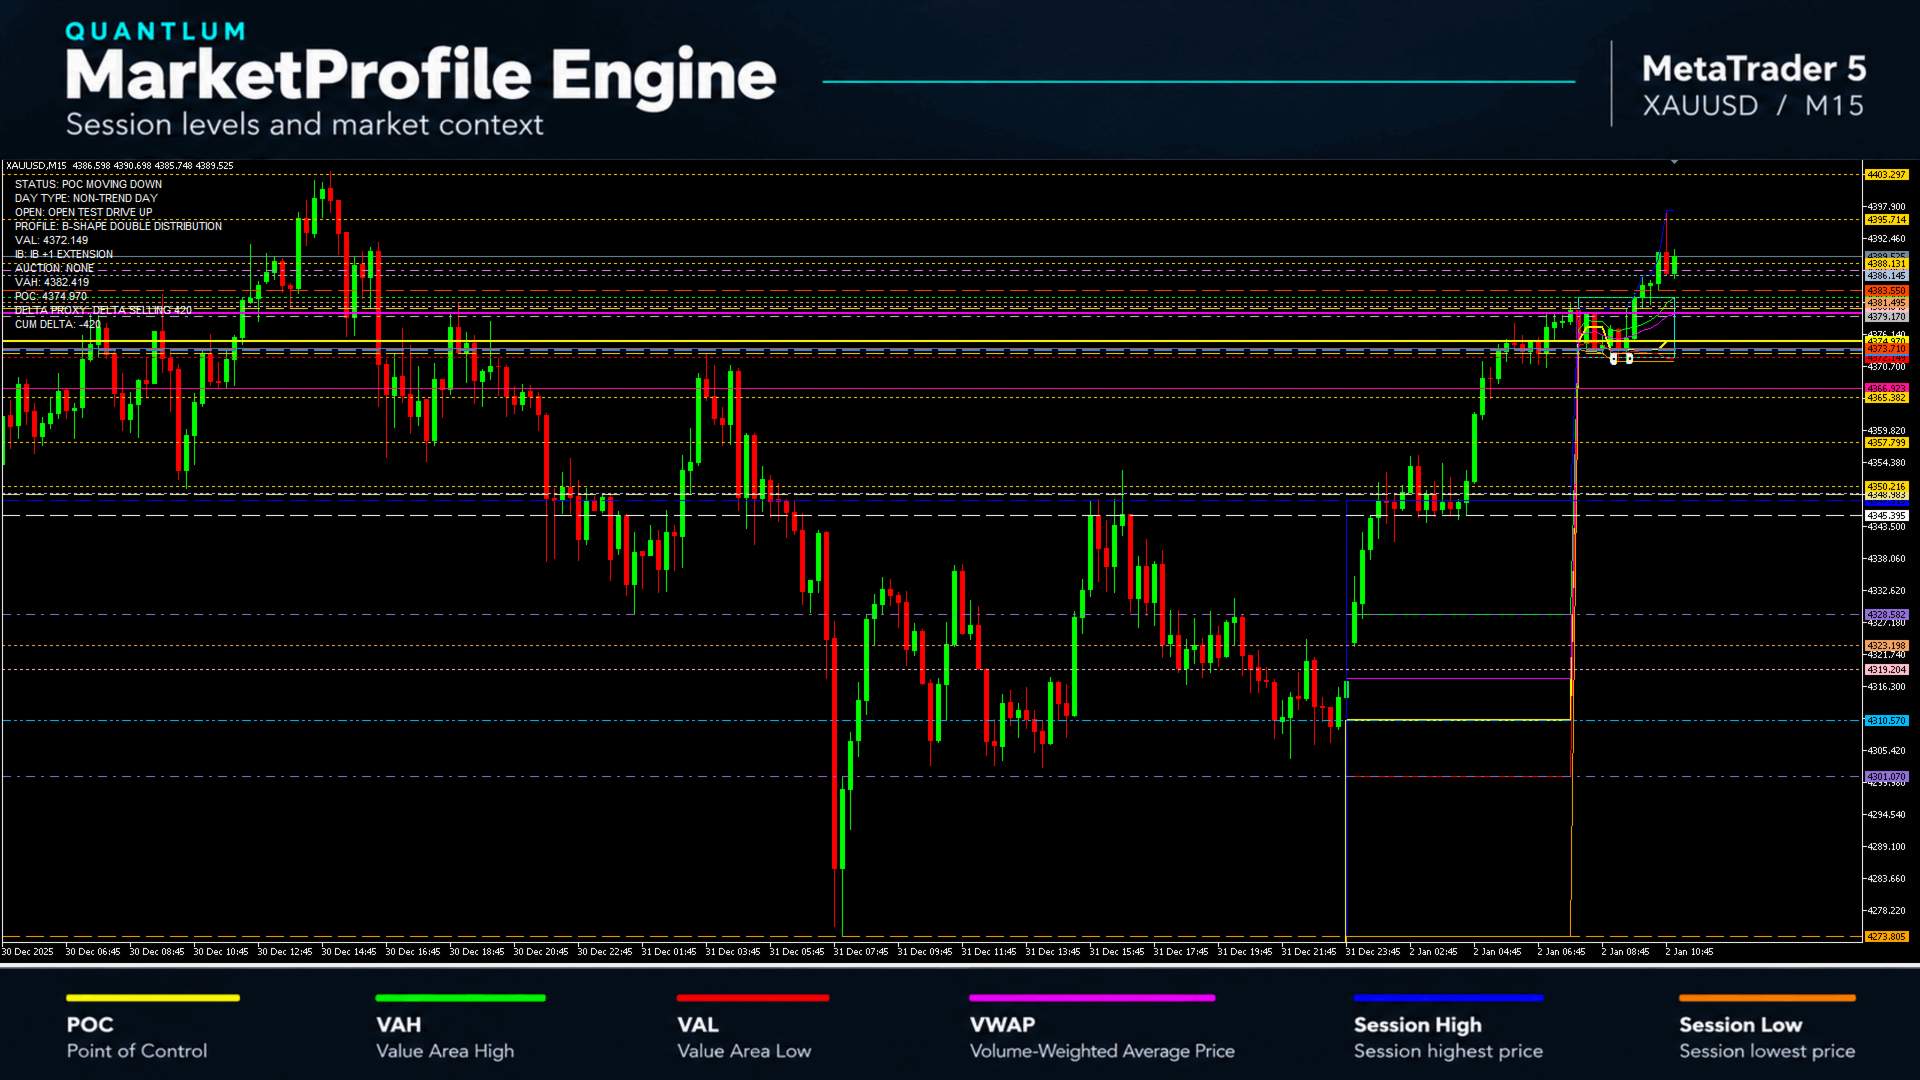
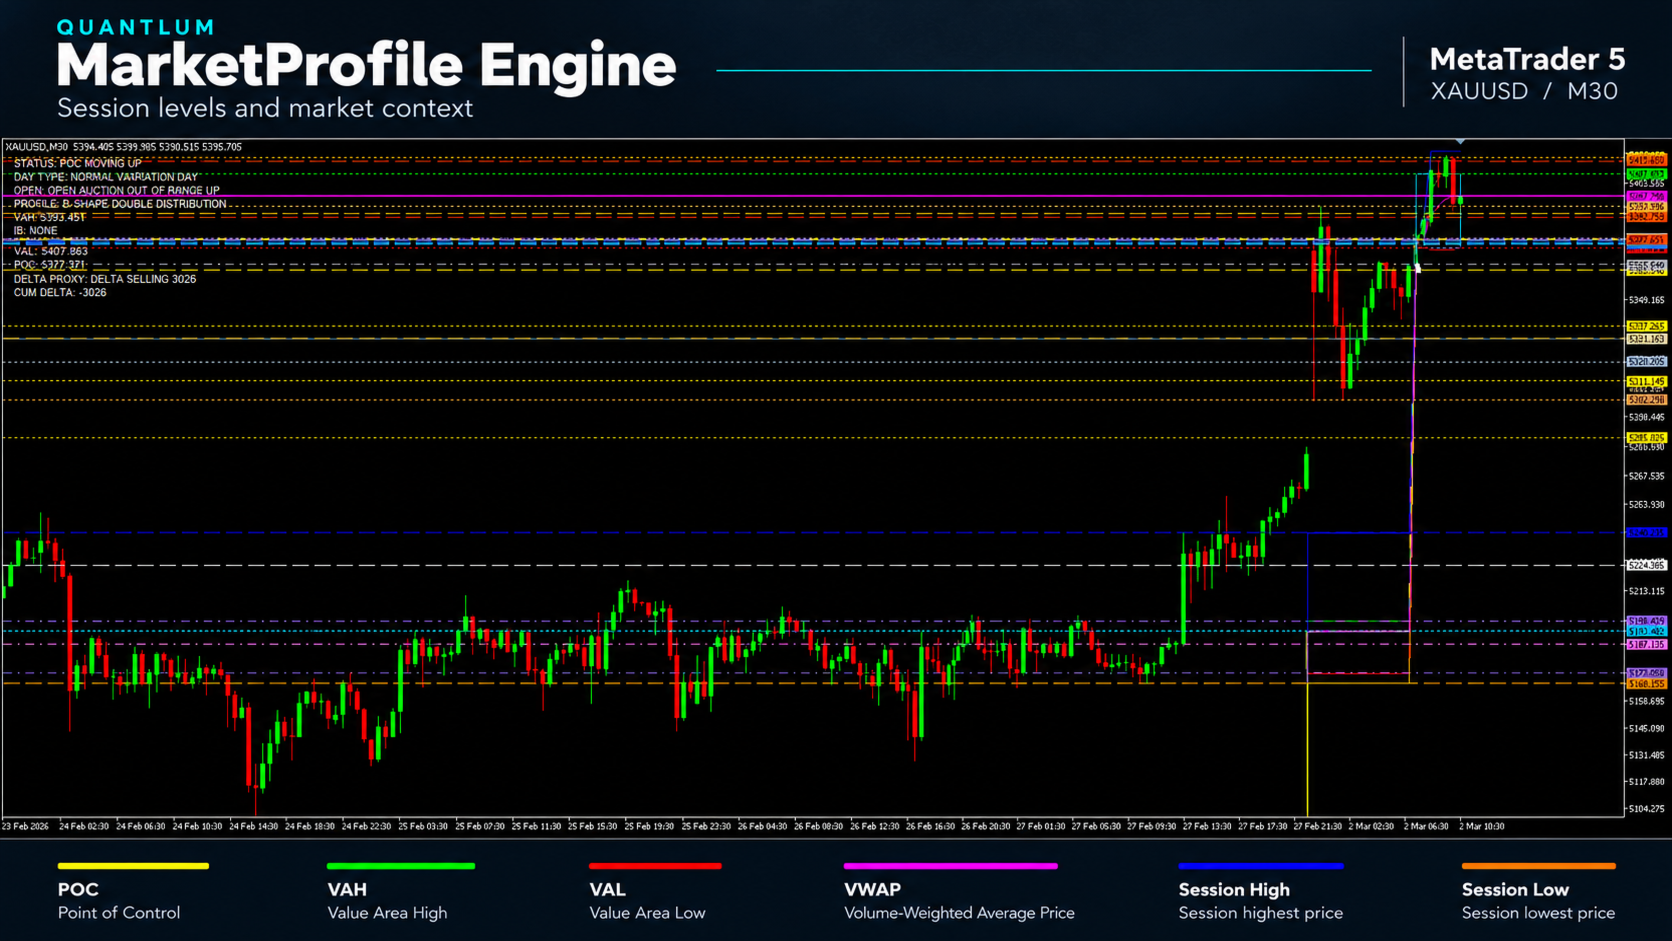
  • Volume and TPO profile views. Display profile information alongside Point of Control (POC), Value Area High (VAH), Value Area Low (VAL) and Volume Weighted Average Price (VWAP). TPO letters and a chronological matrix provide additional ways to examine the session.

  • Initial Balance levels and extensions. Follow Initial Balance High and Low, together with three extension levels above and below the initial range, including MP-IB-3-HIGH and MP-IB-3-LOW. These levels provide reference points for observing range expansion and price reactions.

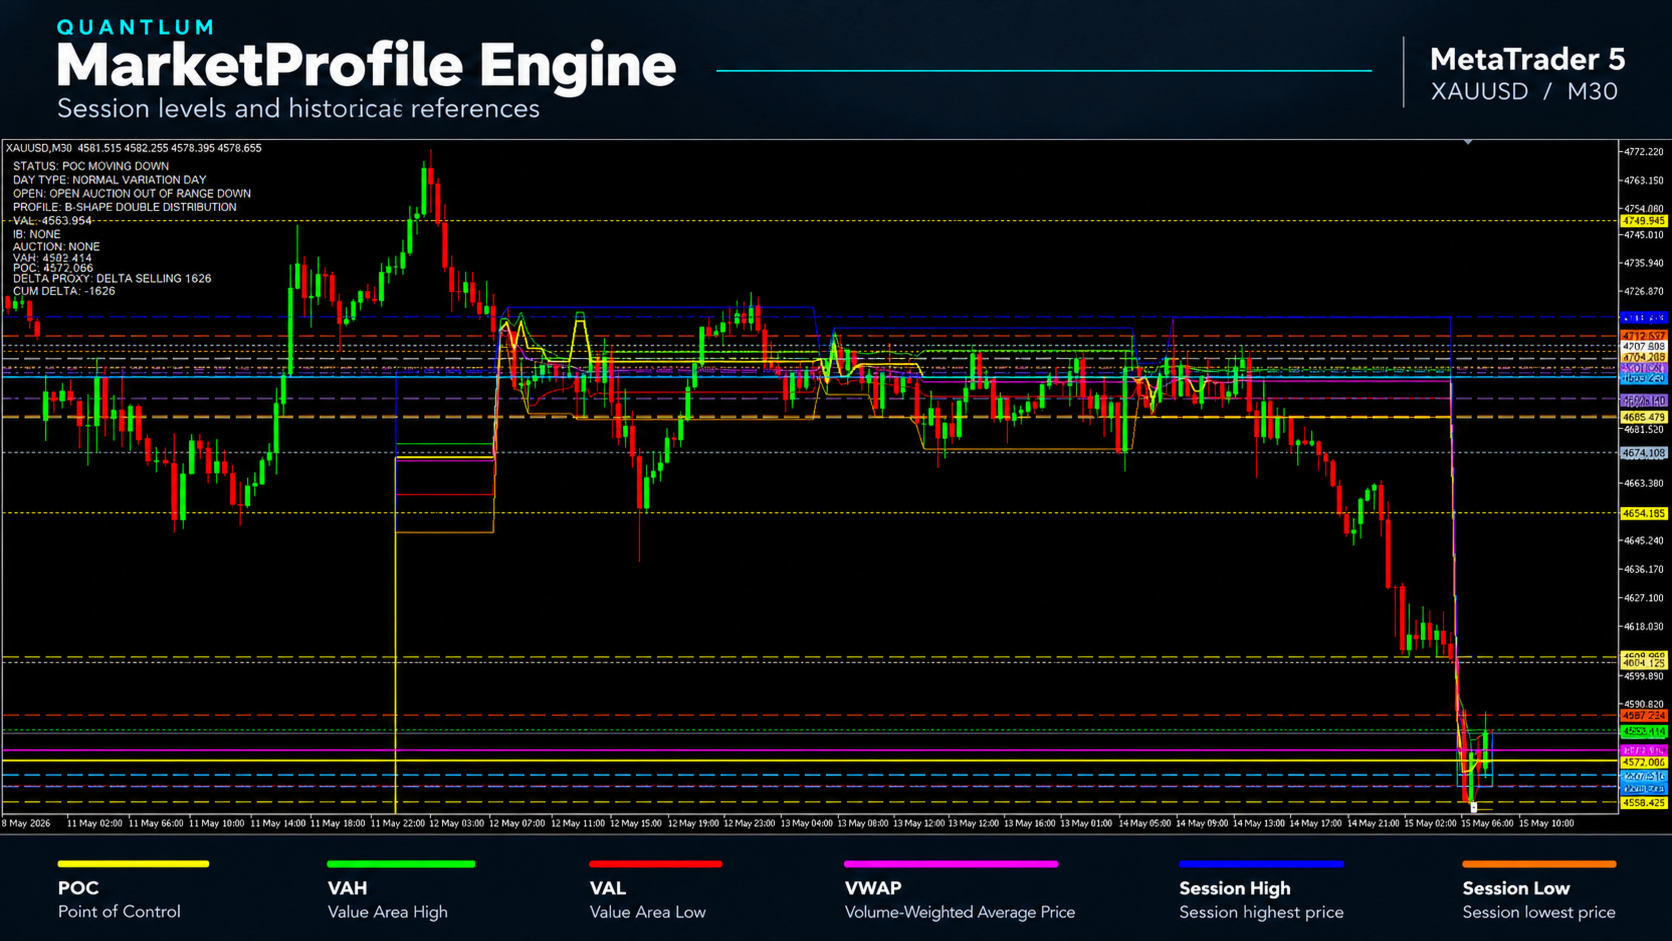
  • Historical and broader market references. View previous-session price levels, historical POC and value-area references, high and low volume nodes, and references across multiple sessions, including weekly and monthly levels.

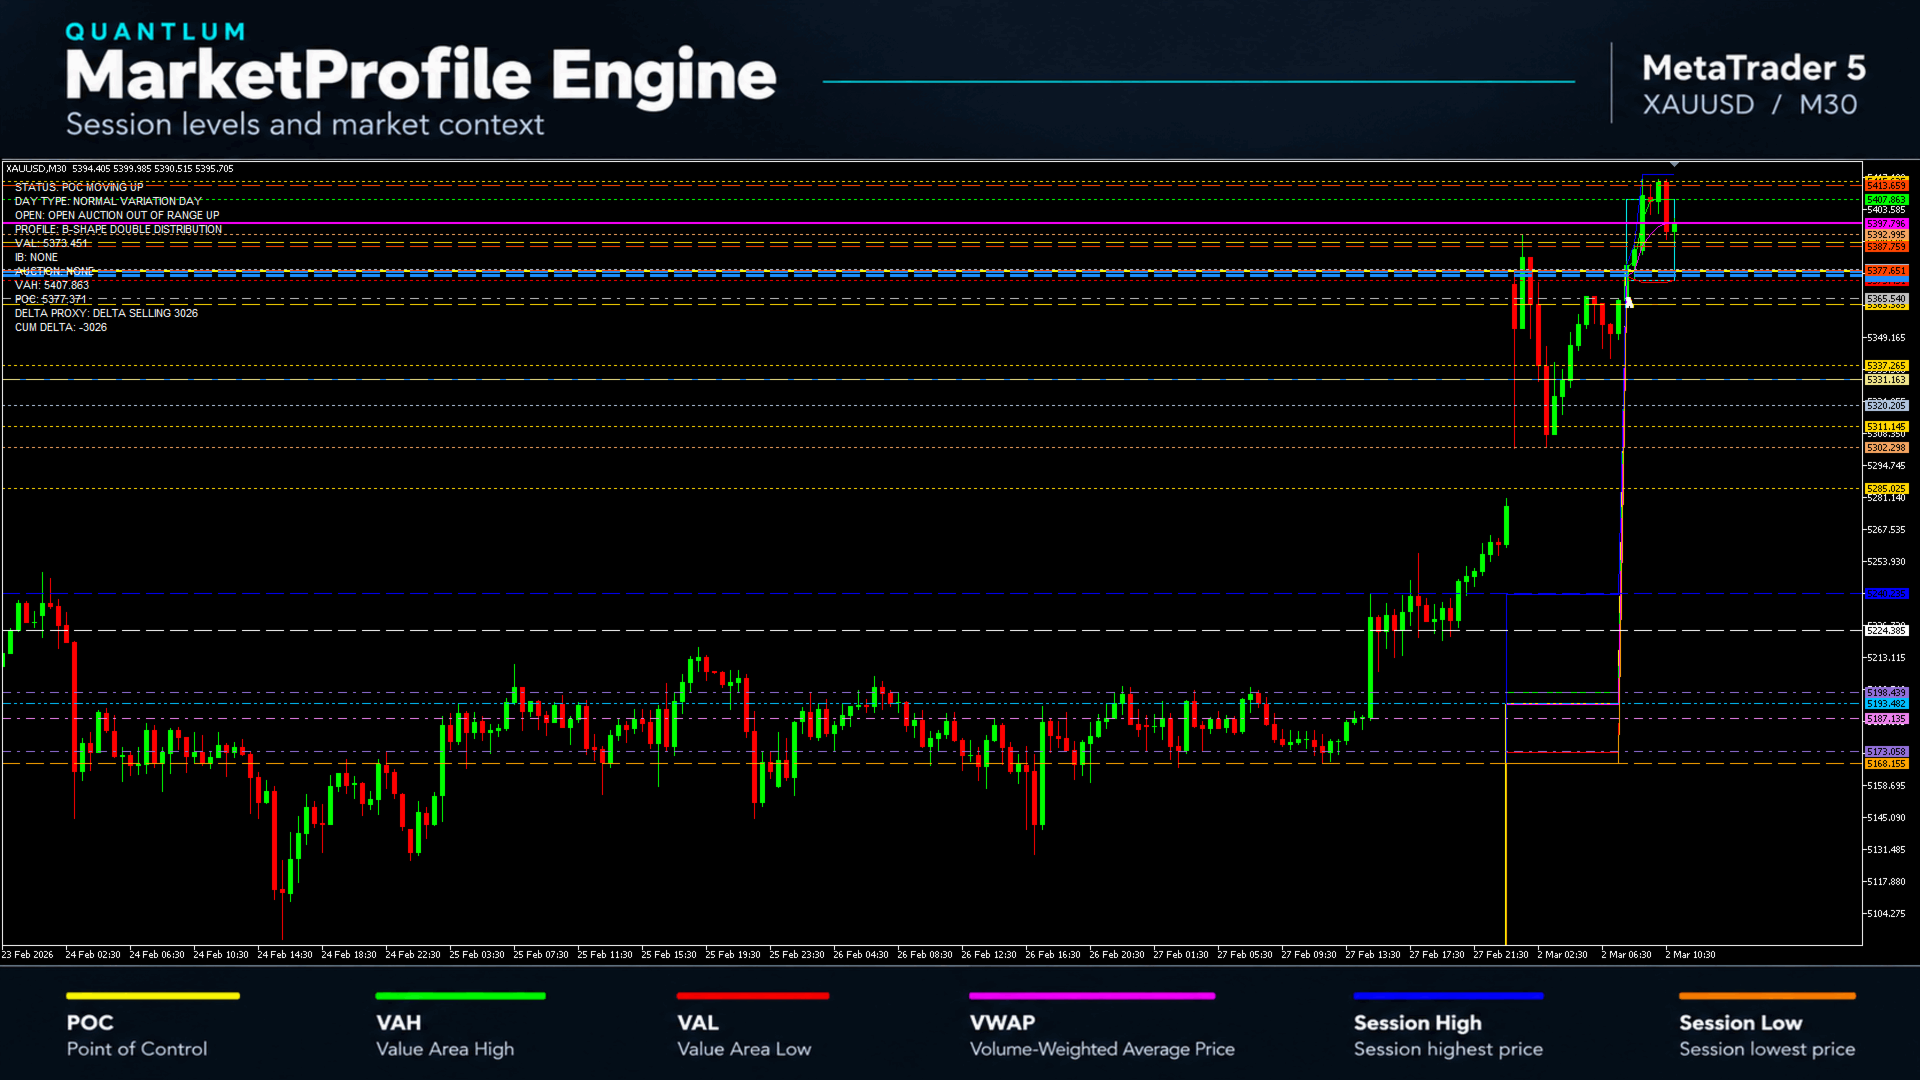
  • Session information panel. Review a structured summary of the selected session, including opening behavior, session structure, value-area conditions and directional context. Compact and full display modes let you choose the amount of information shown.

  • Flexible chart presentation. Adjust session settings, profile display options, colors, text and panel placement to suit your chart layout and analysis preferences.

Read price movement in context

MarketProfile Engine gives you reference levels for studying several types of market behavior.

During a directional move, you can follow how price progresses through the session’s value area and Initial Balance extensions. Around a breakout, you can examine whether price remains beyond a reference level or returns to the previous range. During a pullback, you can observe the reaction when price revisits an earlier level.

In more balanced conditions, the profile and value-area references help you examine how price is distributed within the session and where activity is concentrated.

This supports a consistent analysis process: identify the relevant area, observe the market’s response and assess the situation within the wider session context. Each level should be interpreted together with price behavior and your own trading rules.

Getting started

  1. Attach MarketProfile Engine to a chart in MetaTrader 5.

  2. Select the session you want to analyze and check the session time settings against your broker’s chart time.

  3. Choose your preferred profile view, display options and information panel mode.

  4. Review the displayed levels and session context before applying your own entry, exit and risk-management rules.

Sufficient historical data must be available for the selected symbol and analysis period.

Data and interpretation

The information displayed depends on the market data available from your broker. Volume and delta readings may include estimates. Developing session levels and panel readings can change as new market data becomes available.

MarketProfile Engine is an analytical indicator. It does not place or manage trades automatically.

Guidance and support

Further usage guidance and practical chart examples are planned to help users understand the displayed levels, session context and chart interpretation.

For setup questions and product support, please use the product’s Comments section or contact the author through MQL5.

Risk information

MarketProfile Engine supports market analysis and does not guarantee trading results. Historical chart examples illustrate past price behavior and do not establish future performance. Trading involves the risk of loss, and users remain responsible for their trading decisions and risk management.
おすすめのプロダクト
Master Editionは、ボリュームとマネーフローの視点を通じて市場構造を可視化するために設計されたプロフェッショナルグレードの分析ツールです。標準のボリュームインジケーターとは異なり、このツールはチャート上に日足ボリュームプロファイルを直接表示し、価格発見がどこで行われたか、そして「スマートマネー」がどこに位置しているかを正確に確認できます。 このMaster Editionは、明確さとスピードを考慮して設計されており、ロード時にチャートレイアウトを即座に美化するユニークな自動テーマ同期システムを備えています。 主な機能: 真のマネーフロー計算: 標準のティックボリュームを超えます。「Use Money Flow」を有効にすると、ボリュームは価格によって重み付けされ、特定の価格レベルでの実際の資本コミットメントが明らかになります。 バリューエリア (VA) の可視化: バリューエリア(デフォルトではボリュームの70%)を自動的に計算します。 VA Fill: コントロールゾーンを即座に識別するために、バリューエリアの背景をシェーディングします。 主要レベル: コントロールポイン
インジケーター技術仕様 – Delta Profile for MetaTrader 5 Delta Profile は MetaTrader 5 用に開発されたインジケーターで、指定されたローソク足範囲内の出来高フローを詳細に分析するためのものです。異なる価格レベルにおける正の出来高(上昇に関連)と負の出来高(下降に関連)の不均衡を構造化し、可視化します。その結果、ユーザーは最も多くの取引が集中する価格帯や実際の市場不均衡が形成される領域を明確に把握できます。 以下に、本インジケーターの主要な技術特性と設定パラメータを示します。 基本コンセプト インジケーターは 価格レベル を識別し、それらを正の出来高、負の出来高、および純 Delta(正負の出来高差)に分類します。 各価格レベルは 水平バー としてチャートに表示され、市場の活動ゾーンや不均衡領域を視覚的に確認できます。 ユーザーは 分析対象ローソク足数 、 価格の丸め精度 、 最大表示レベル数 、および 表示スタイル を自由に設定できます。 主要機能 価格レベルのマッピング :設定された精度に基づき価格を丸め、対応するローソク足の
SPECIAL LAUNCH OFFER: $30 (1-Month Rent) Limited time offer to build our community and gather feedback! AmbM GOLD Institutional Scalper A high-precision M5 algorithm for XAUUSD (Gold) , engineered to trade exclusively at Institutional Liquidity Levels ($5/$10 psychological marks). PERFORMANCE DATA (BUY ONLY) • Win Rate: 87.09%. • Safe Growth: +$4,113 profit on $10k (13.75% Max Drawdown). • Extreme Stress Test: Successfully generated +$22,997 in a 5-year stress test (2020-2026), proving
SuperAgent v7.0 Diamond Pro - 定量的スコアリングとダイナミックリスク 説明: SuperAgent v7.0 Diamond Proは、高度なPython金融アルゴリズムをMT5用に忠実に移植したプロフェッショナルなエキスパートアドバイザー(EA)です。 定量的スコアリングエンジン と ダイナミックリスク管理 を組み合わせ、機関投資家レベルのポートフォリオ管理を実現します。 主な特徴: 多層決定エンジン:   「低遅延シグナル処理」「トレンドバイアス確認」「モメンタムスコアリング」の3つの次元で市場を評価します。 Auto-Lot(ダイナミックリスク):   余剰証拠金に対するリスクの割合に基づいてロット数を自動計算し、「資金不足」エラーを防止します。 StopLevel Guard:   ブローカーの「ストップレベル」と「フリーズレベル」をリアルタイムで監視。SLおよびTPを自動的に正規化し、ブローカーの制限を遵守します。 プロアクティブ・マージンチェック:   注文実行前に必要証拠金を計算し、残高不足の場合はログを汚さずにトレードをスキップします。
BTC Master Pro
Farzad Saadatinia
4.58 (12)
BTC Master Pro — 規律あるビットコイントレードのための信頼できるパートナー。 最新バージョンでは OpenAI の人工知能 を統合し、高ボラティリティな暗号資産市場において、より高度な執行判断と取引フィルタリングを実現します。 本プロフェッショナル向けエキスパートアドバイザーは、 MetaTrader 5 上での Bitcoin(BTCUSD) 取引専用に設計されており、構造化された執行ロジック、エクスポージャー管理、そして高度なリスクマネジメントに重点を置いています。 価格: $699  →  次段階: $999  →  最終価格: $999 LIVE SIGNAL HERE OpenAI搭載・執行フィルター 最新バージョンでは OpenAI 技術を活用し、リアルタイムで市場環境を分析し、質の低いエントリーや不利なセットアップをフィルタリングします。 AIセーフティレイヤー: AIモジュールは取引実行前の第二承認レイヤーとして機能します。これは予測ツールではなく、あくまで執行フィルターとして設計されています。すべての取引は構造化ロジックとインテリジェントな検証プ
ONNYX INDICATOR バージョン 1.14 MetaTrader 5 用のサプライ・デマンド分析インジケーターです。確定したスイングからゾーンを作成し、ATR で幅を調整し、品質をパーセント表示します。確定足の BUY/SELL シグナルは後から消えない設計です。 主な機能 - ゾーン内に品質パーセントを表示するサプライ・デマンドゾーン。 - 確定足で表示される大きな BUY/SELL 矢印。 - EMA トレンドフィルターとローソク足反発確認。 - トレンド、価格レベル、市場状況パネル。 - 関連する経済指標を最大5件表示。発表前は Forecast/Previous、発表後は Actual を表示。 - 60秒ごとのニュース更新とストラテジーテスター用カレンダーキャッシュ。 - ポップアップ、プッシュ、メール通知。 - iCustom 用バッファ:0=BUY価格、1=SELL価格。 使用方法 チャートに適用し、履歴の読み込みを待ってから、トレンドと有効ゾーンを確認し、確定足シグナルを独自のリスク管理と組み合わせてください。XAUUSD H1 は見やすい構造、M15 はより
Apex Momentum Sentinel MT5 – Next-Generation Institutional Breakout Algorithm Apex Momentum Sentinel is a high-tech trading system designed to capture powerful momentum moves as the market exits consolidation. The advisor is based on the "smart breakout" concept, implemented through six independent algorithmic modules that work synergistically to ensure maximum entry accuracy. Unlike most systems that use risky loss compensation methods, Apex Sentinel is based on a rigorous mathematical model a
Support & Resistance Auto Plot Lines Indicator for MT5 – Perfect for Scalping! Make your trading easier with our Support & Resistance Auto Plot Lines indicator for MT5. This powerful tool automatically detects key support and resistance levels on your chart, helping you make better trading decisions with minimal effort. Why Choose This Indicator? Perfect for Scalping – Quickly identify strong price zones for fast, precise entries and exits. Automatic Level Detection – No need to manually dra
TPO Profile MT5
Kyra Nickaline Watson-gordon
Definition : TPO is a Time Price Opportunity. Instead of using bars or candles with an Open, High, Low, and Close price, each "bar" in a Market Profile is represented by horizontal bars against the price It is called Market Profile terminology. In other words time-price-opportunity (TPO) profiles are histograms of how much time was spent at each price within the span of the profile. By using a TPO chart, you are able to analyze the amount of trading activity, based on time, for each price level
Gold Crazy EA   is an Expert Advisor designed specifically for trading Gold H1/ EU M15. It use some indicators to find the good Entry. And you can set SL or you can DCA if you want. It can be an Scalping or an Grid/ Martingale depend yours setting. This EA can Auto lot by Balance, set risk per trade. You also can set TP/ SL for earch trade or for basket of trade. - RSI_PERIOD - if = -1, then the default strategy works, if >0, then the RSI strategy works - MAX_ORDERS - to trade with only 1 order,
PositionMap Pro — Account Overview Panel for MT5 A real-time panel that groups all open positions by symbol and shows Buy lots, Sell lots and net profit/loss directly on your chart — the whole account at a glance. Instead of counting lots symbol by symbol in the Terminal tab, PositionMap Pro groups everything automatically. You instantly see how much exposure you have on each symbol, split by direction. Panel example Symbol Buy Lot Sell Lot Net P/L EURUSD 0.50 — +12.30 XAUUSD — 1.00 −45.00 GBPUS
FREE
ボリュームプロファイルマルチモード:インジケーターのやり方ではなく、あなた自身のやり方でボリュームを分析しましょう。 ほとんどのボリュームプロファイル指標は、トレーダーをあらかじめ定義された分析範囲に限定します。しかし、市場は固定されたテンプレート内で動くわけではありません。なぜあなたの分析もそうあるべきなのでしょうか? ボリュームプロファイルマルチモードを 使えば、ボリューム分析の場所、タイミング、方法を自由に決定できます。市場構造の分析、取引セッションのプロファイリング、上位時間軸のアクティビティの監視、あるいは進行中のオークションの追跡など、どのような目的であれ、このインジケーターはあなたの取引スタイルに合わせて調整されるため、あなたがインジケーターに合わせる必要はありません。 直感的なワークフローを求める初心者から、柔軟性を重視するプロフェッショナルまで、あらゆるユーザー向けに設計されたボリュームプロファイルマルチモードは、4つの強力なプロファイリング手法を1つの高度にインタラクティブでカスタマイズ可能なトレーディングツールに統合しています。 4つの強力なプロファイリングモード
Volume Profile Multiple — アルゴリズム取引対応バッファ付き マルチブロック・ボリュームプロファイル 時間足を変えるたびにボリュームプロファイルを一つずつ描き直し、再計算する手間にうんざりしていませんか? Volume Profile Multiple は、チャート上に複数の連続したボリュームプロファイルを自動的に描画し、直近の表示範囲だけでなく、相場の各区間で機関投資家の関心が実際にどこにあったのかを明らかにします。 この指標が行うこと 本指標は価格履歴をN本のローソク足ごとのブロックに分割し(ブロック数と1ブロックあたりの本数は自由に設定可能)、各ブロックについて完全なボリュームプロファイルを計算します:コントロールポイント(POC)、バリューエリアの上限・下限(VAH/VAL)、高出来高ゾーンと低出来高ゾーン(HVN/LVN)です。結果として、ブロックごとの市場構造を視覚化したマップが得られ、実出来高に基づく蓄積ゾーン、サポート・レジスタンス、バリューエリア間の価格ローテーションの特定に役立ちます。 アルゴリズム取引にも対応 多くのボリュームプロファイル系
Ignition
Dansie Software Limited
Strategy Overview The Ignition EA tries to take advantage of sudden momentum when the Ignition pattern is detected. The final bar in the ignition pattern has a small opening wick, a very little or no closing wick, is large in comparison to recent bars and must start from the lower end of the current range (for a bullish ignition) Quick Testing Use Symbol EURUSD, Timeframe M2, and remove the GBPUSD symbol from the "Symbols" input (stratergy 1 and stratergy 2) Settings The below settings appe
Was: $249  Now: $99   Market Profile defines a number of day types that can help the trader to determine market behaviour. A key feature is the Value Area, representing the range of price action where 70% of trading took place. Understanding the Value Area can give traders valuable insight into market direction and establish the higher odds trade. It is an excellent addition to any system you may be using. Inspired by Jim Dalton’s book “Mind Over Markets”, this indicator is designed to suit the
PURE HFT – Automated Basket and Grid Trading Expert Advisor OVERVIEW Pure HFT is an automated Expert Advisor designed for systematic entry, basket management, grid recovery, and controlled profit closing. The EA automatically detects whether the trading account uses Hedging or Netting mode and adjusts its trading process to suit the account environment. Pure HFT does not require DLL access, external licensing, or WebRequest connections. KEY FEATURES • Automatic detection of Hedging and Netting a
Volume Footprint & Heatmap Indicator This indicator combines Volume Footprint and Heatmap visualization, inspired by the Order Flow and Heatmap concepts found in Bookmap. Unlike futures markets, the Forex market does not provide real exchange-traded volume data. Instead, it only offers Tick Volume . This indicator is designed to simulate Bookmap-style market visualization as closely as possible using the available Tick Volume data. Because the indicator relies on Tick Volume, the quality and acc
TradeVisonPro Forex Analyzer Pro MT5取引口座分析・モニタリングダッシュボード TradeVisonPro Forex Analyzer Proは、MetaTrader 5ユーザー向けに設計された取引分析および口座モニタリングソリューションです。 本製品は、MT5の取引データを構造化されたWebダッシュボードに整理し、口座情報の確認、保有ポジションの監視、取引履歴の分析、戦略の追跡、トレードジャーナルの記録、パフォーマンス統計の確認を可能にします。 TradeVisonPro Forex Analyzer Proは、取引情報を整理し、対応するデスクトップおよびモバイルWebブラウザからアクセスできるようにすることを目的としています。 主な機能 • MT5口座ダッシュボード • 保有ポジション監視 • 取引履歴分析 • トレードカレンダー • 戦略追跡 • トレードジャーナル • 口座パフォーマンス統計 • パフォーマンスレポート • 取引通知 • 複数口座対応 • 共有可能な読み取り専用レポート MT5口座ダッシュボード MetaTrader 5取引口
FREE
WayCof Donin
Fabio Cunha Gaissler Donin
(EN) — What this EA does Wyckoff EA – Simplified (RSI + MACD) is a MetaTrader 5 Expert Advisor that opens buy/sell trades on basic RSI and MACD signals, applying Stop Loss, Take Profit , and an optional Trailing Stop . It evaluates once per new bar on the selected timeframe. Reason #5: Proven robustness — 13 years of profitability The 2839 setup performed well across all market cycles over the past 13 years: Period Market Performance 2013–2019 Calm bull market Consistent profit 2020 COVID
Equinox Gold
Dmitriq Evgenoeviz Ko
Equinox Gold is a high-tech trading expert advisor (EA) specifically designed for the gold market ( XAUUSD ). The system is based on a unique Market Equilibrium algorithm that identifies areas of imbalance between supply and demand during extreme volatility. Unlike most robots that use dangerous sit-and-wait methods, Equinox Gold relies on mathematical momentum confirmation and strict risk control for every trade. MAIN ADVANTAGES VRP Filter (Volatility Range Filter): The robot automatically ada
PatternScope — Multi-Pattern Recognition for MT5 PatternScope is a multi-pattern recognition indicator for MetaTrader 5. It scans price action for classic chart patterns, confirms breakouts, and draws clear   Entry, Stop Loss and Take Profit   levels. A compact dashboard shows the latest pattern, bias and Risk:Reward. Patterns:   Double Top/Bottom, Triple Top/Bottom, Head and Shoulders (and inverted), Bullish & Bearish Flag, Pennant, Rising & Falling Wedge, Triangle, Rectangle, Cup and Handle —
Dragon Eyes PRO
Seif-eddine Boukhechima
# Dragon Eyes – MT5 Expert Advisor ## Overview **Dragon Eyes** is a professional Expert Advisor (EA) developed for **MetaTrader 5**, designed to automate trading with speed, precision, and disciplined risk management. It continuously monitors the market, identifies trading opportunities based on its built-in strategy, and executes trades automatically without emotional influence. The EA is optimized for stable performance and is suitable for traders who want a reliable automated trading sol
Babel Assistant
Iurii Bazhanov
4.33 (9)
Babel assistant 1 MT5ネッティングロボット「Babel_assistant_1」は、ZigZagインジケーターを使用してM1、M5、M15、H1、H4、D1、W1の時間足全体でフィボナッチレベルを生成し、買いトレンドと売りトレンドの強さを計算します。指定されたトレンドレベル4.925を超えると、「Lot for open a position」の設定を使用してポジションをオープンします。その後、Babelは特定のフィボナッチレベルに指値注文(または逆指値注文)を配置し、指定されたストップロス(Stop Loss)およびテイクプロフィット(Take Profit)のラインを設定します。画面には、ポジション、トレード、トレンドの現在の結果が表示されます。 0.02ロット以上の手動でのポジション追加は、ロボットによって独自の保留注文のトリガーとして認識されます。0.01ロットの保留注文または成行注文は、執行時に単にポジション量を変更します。 免責事項: 以下の資料は、情報提供および教育目的のみを目的としています。外国為替市場向けの自動取引プログラムである本製品「Babel
FREE
CyberTradeTHxAI Gold Sniper MT5 Professional Gold Trading Signal Indicator for MetaTrader 5 CyberTradeTHxAI Gold Sniper MT5 is a professional-grade Gold (XAUUSD) trading indicator developed to identify high-probability Buy and Sell opportunities using trend analysis, pullback confirmation, and intelligent market structure detection. Designed for both beginner and advanced traders, the indicator automatically calculates optimal Entry Zones, Stop Loss, and multiple Take Profit levels while provid
Wyckoff VSA Double Barrier is an automated MetaTrader 5 Expert Advisor that combines H1 Wyckoff and Volume Spread Analysis context with M5 confirmation and structured basket management. MAIN FEATURES • H1 directional analysis with M5 entry confirmation. • Integrated Wyckoff sequence, VSA confirmation, Dow structure and wave analysis. • Double-barrier take-profit logic based on H1 swing highs and lows. • Minimum risk-to-reward filter, set to 1:2 by default. • Configurable initial stop loss and
Here   our more valuable tools SMC Trend Trading   ,  Easy SMC Trading  ,  Institutional SMC Architect Volume Analysis Tools  ,  Volume flow Profile  ,  Market volume profile  , FVG with Volume  , Liquidity Heatmap Profile  ,  Volume Spread Analysis The    Liquidity Heatmap   is a sophisticated institutional trading tool designed to reveal where over-leveraged traders are trapped. By calculating estimated liquidation levels based on volume spikes and leverage, this indicator draws a dynamic "h
Phantom Edge SMC — The Ultimate Smart Money Indicator for MT5 Tired of manually drawing structures while trading SMC or ICT concepts? Let Phantom Edge SMC do the heavy lifting for you. Key Features Internal & Swing Structure: Automatically detects BOS and CHoCH across two structural levels. Order Blocks (OB): Identifies Internal and Swing OBs with automated mitigation tracking. Equal Highs / Lows: Highlights EQH / EQL to pinpoint Liquidity pools. Fair Value Gaps (FVG): Displays FVGs with
The Bitcoin Reaper
Profalgo Limited
3.71 (34)
発売プロモーション: 現在の価格で入手できるコピーの数はごく限られています。 最終価格: 999ドル 新規 (349 ドルから) --> 1 EA を無料で入手 (取引口座番号 2 つ)。 究極のコンボディール   ->   こちらをクリック 公開グループに参加する: ここをクリック   LIVE SIGNAL LIVE SIGNAL V2.0 UPDATE 2.0 INFO BITCOIN REAPER へようこそ!   Gold Reaper が大成功を収めた後、同じ勝利の原則を Bitcoin 市場に適用する時が来たと判断しました。そして、それは非常に有望に見えます!   私はこれまで 20 年以上にわたってトレーディング システムを開発してきましたが、私の専門分野は「断然」ブレイクアウト戦略です。 このシンプルながらも効果的な戦略は、常に最高の取引戦略の上位にランクインしており、基本的にあらゆる市場に適用できます。     特にビットコインのような変動の激しい市場では、真価を発揮します。   それで、この戦略はどのように機能するのでしょうか? ブレイクアウト戦略は、重要なサ
Expert. Automatic and manual trading. Ready-made trading system based on Elliott waves and Fibonacci retracement levels . It is simple and affordable. Display of the marking of Elliott waves (main or alternative option) on the chart. Construction of horizontal levels, support and resistance lines, a channel. Superposition of Fibonacci levels on waves 1, 3, 5, A Alert system (on-screen, E-Mail, Push notifications).    visual panel for opening orders in manual trading. visual panel for setting up
TS Hunter (Rev4) is a premium, 100% automated quantitative trading algorithm engineered exclusively for the US500 (S&P 500 Index) on the 5-Minute (M5) timeframe. Unlike standard commercial Expert Advisors that cause dangerous overtrading or fall into chaotic tick loops, TS Hunter utilizes a surgical trend-rebuild logic and strict structural filters to execute precise mathematical entries at the most opportune moments. PROVEN LIVE SIMULATION METRICS (5-YEAR STRESS TEST - REAL TICKS): • Profit Fac
このプロダクトを購入した人は以下も購入しています
MERAVITH SCANNERは、MetaTrader 5用のプロフェッショナルな金融市場インジケーターで、複数の分析ツールを一つの統合システムにまとめています。独自の出来高加重平均価格(VWAP)手法を使用してすべての計算を自動で行い、主観的な解釈を完全に排除します。 このインジケーターは、すべての資産クラス(FX、株式、指数、商品、暗号通貨)およびM1から月足までのすべての時間軸で動作します。基本原理は「価格は出来高に従う」というものです。MERAVITHは機関投資家の出来高が集中するポイントを特定し、その集中から数学的に正確な価格レベルを導き出します。予測や投機は行わず、計算のみを行います。 MERAVITH SCANNERを使用すると、28の主要FX通貨ペアをすべての時間軸でわずか2~3分でスキャンできます。また、任意の市場をスキャンすることも可能です。例えば、約100銘柄の株式を約10分でスキャンできます。 インジケーターは、消耗レベル、均衡線、偏差、統計レベル、およびターゲット予測を算出します。 チャート要素 Origin Point :すべての計算が始まる起点です。イン
ARICoin is a powerful trading companion designed to generate high-probability entry signals with dynamic TP/SL/DP levels based on volatility. Built-in performance tracking shows win/loss stats, PP1/PP2 hits, and success rates all updated live. Key Features: Buy/Sell signals with adaptive volatility bands Real-time TP/SL/DP levels based on ATR Built-in MA Filter with optional ATR/StdDev volatility Performance stats panel (Success, Profit/Loss, PP1/PP2) Alerts via popup, sound, push, or email Cust
AriX
Temirlan Kdyrkhan
1 (4)
AriX Indicator for MT5 A powerful trend-following and signal-evaluation tool AriX is a custom MT5 indicator that combines Moving Averages and ATR-based risk/reward logic to generate clear buy/sell signals. It visualizes dynamic SL/TP levels, evaluates past trade outcomes, and displays win/loss statistics in a clean on-chart panel. Key features include: Buy/Sell signals based on MA crossovers ATR-based SL/TP1/TP2/TP3 levels with visual lines and labels Signal outcome tracking with real-time stat
Volume Arrow Signal Product Description Volume Arrow Signal is a smart trading indicator designed to help traders identify potential buy and sell opportunities using price action, volume behavior, and directional arrow signals. The indicator places clear arrows directly on the chart, making it easy to spot possible market reversals, trend continuations, and entry opportunities without spending hours analyzing charts manually. Whether you are trading Gold (XAUUSD) , Forex pairs, Indices, or Crypt
AriFocus - Non-Repainting Buy/Sell Signals AriFocus - one clear signal. AriFocus marks buy and sell signals directly on the chart and suggests a stop-loss level for each one. Every signal is confirmed on bar close and never repaints. - Buy/sell arrows, confirmed on bar close - Suggested stop-loss level for every signal - Trend band and candle coloring to show direction at a glance - 10 ready-made presets, or your own settings (14 calculation methods) - Pop-up, push and email alerts with entr
一言でいうと このインジケーターは RSI と MACD という2人の専門家を1つにまとめたもの です。2つのチャートを別々に見て判断する代わりに、両方が同意したときだけ「買い」または「売り」の矢印を表示します。 矢印は再描画されません 。一度出現すれば、そのまま固定されます。 「コンボ」の意味 通常、トレーダーは RSI(値動きの勢い)と MACD(トレンドの方向)を別々に見ます。しかし両者が矛盾することも多いです。 このインジケーターでは、 両方が同時に同意したときのみシグナル を出します。これにより、多くの偽シグナルが排除されます。 画面で見えるもの 価格チャートとは別のインジケーターウィンドウ 青と赤の矢印 —— そのまま使えるシグナル 拡大表示された MACD ヒストグラム(見やすく強調されている) RSI と MACD のラインも表示されるが、注目すべきは矢印 こんな人におすすめ 初心者 —— 2つのインジケーターを別々に解釈し、矛盾に対処する必要がない 経験者 —— シグナルの高速フィルタリングと、再描画しないクリアなロジック 迷いたくない人 —— 「買い」「売り」「待て
note: this indicator is for METATRADER4, if you want the version for METATRADER5 this is the link:  https://www.mql5.com/it/market/product/108106 TRENDMAESTRO ver 2.5 TRENDMAESTRO recognizes a new TREND from the start, he never makes mistakes. The certainty of identifying a new TREND is priceless. DESCRIPTION TRENDMAESTRO identifies a new TREND in the bud, this indicator examines the volatility, volumes and momentum to identify the moment in which there is an explosion of one or more of these da
Trading Tendencial Trading Tendencial is a trend-following indicator for MetaTrader 5 designed to identify the current market direction and provide BUY and SELL signals based on trend confirmation. The indicator uses a combination of trend analysis, ATR-based dynamic bands, ADX, EMA filters and higher-timeframe confirmation to reduce false signals and identify stronger market movements. Main Features Trend direction identification BUY and SELL signals Higher Timeframe trend confirmation ADX tren
PrimeScalping is a powerful trading companion designed to generate high-probability entry signals with dynamic TP/SL/DP levels based on volatility. Built-in performance tracking shows win/loss stats, PP1/PP2 hits, and success rates — all updated live. Key Features: Buy/Sell signals with adaptive volatility bands Real-time TP/SL/DP levels based on ATR Built-in MA Filter with optional ATR/StdDev volatility Performance stats panel (Success, Profit/Loss, PP1/PP2) Alerts via popup, sound, push, or e
MasterTrend Indicator for MT5 A powerful trend-following and signal-evaluation tool MasterTrend   is a custom MT5 indicator that combines Moving Averages and ATR-based risk/reward logic to generate clear buy/sell signals. It visualizes dynamic SL/TP levels, evaluates past trade outcomes, and displays win/loss statistics in a clean on-chart panel. Key features include: Buy/Sell signals based on MA crossovers ATR-based SL/TP1/TP2/TP3 levels with visual lines and labels Signal outcome tracking wit
The Expert Advisor and the video are attached in the Discussion tab . The robot applies only one order and strictly follows the signals to evaluate the indicator efficiency. Pan PrizMA CD Phase is an option based on the Pan PrizMA indicator. Details (in Russian). Averaging by a quadric-quartic polynomial increases the smoothness of lines, adds momentum and rhythm. Extrapolation by the sinusoid function near a constant allows adjusting the delay or lead of signals. The value of the phase - wave s
Классификатор силы тренда. Показания на истории не меняет. Изменяется классификация только незакрытого бара. По идее подобен полной системе ASCTrend, сигнальный модуль которой, точнее его аппроксимация в несколько "урезанном" виде, есть в свободном доступе, а также в терминале как сигнальный индикатор SilverTrend . Точной копией системы ASCTrend не является. Работает на всех инструментах и всех временных диапазонах. Индикатор использует несколько некоррелируемых между собой алгоритмов для класси
FFx Universal Strength Meter PRO is more than a basic strength meter. Instead of limiting the calculation to price, it can be based on any of the 19 integrated strength modes + 9 timeframes. With the FFx USM, you are able to define any period for any combination of timeframes. For example, you can set the dashboard for the last 10 candles for M15-H1-H4… Full flexibility! Very easy to interpret... It gives a great idea about which currency is weak and which is strong, so you can find the best pai
The FFx Universal MTF alerter shows on a single chart all the timeframes (M1 to Monthly) with their own status for the chosen indicator. 9 indicators mode (MACD-RSI-Stochastic-MA-ADX-Ichimoku-Candles-CCI-PSAR). Each can be applied multiple times on the same chart with different settings. Very easy to interpret. Confirm your BUY entries when most of the timeframes are showing green color. And confirm your SELL entries when most of the timeframes are showing red color. 2 Alert Options : input to s
The FFx Watcher PRO is a dashboard displaying on a single chart the current direction of up to 15 standard indicators and up to 21 timeframes. It has 2 different modes: Watcher mode: Multi Indicators User is able to select up to 15 indicators to be displayed User is able to select up to 21 timeframes to be displayed Watcher mode: Multi Pairs User is able to select any number of pairs/symbols User is able to select up to 21 timeframes to be displayed This mode uses one of the standard indicators
FFx Patterns Alerter gives trade suggestions with Entry, Target 1, Target 2 and StopLoss .... for any of the selected patterns (PinBar, Engulfing, InsideBar, OutsideBar) Below are the different options available: Multiple instances can be applied on the same chart to monitor different patterns Entry suggestion - pips to be added over the break for the entry 3 different options to calculate the SL - by pips, by ATR multiplier or at the pattern High/Low 3 different options to calculate the 2 TPs -
MetaTrader 4 version available here : https://www.mql5.com/en/market/product/24881 FFx Basket Scanner is a global tool scanning all pairs and all timeframes over up to five indicators among the 16 available. You will clearly see which currencies to avoid trading and which ones to focus on. Once a currency goes into an extreme zone (e.g. 20/80%), you can trade the whole basket with great confidence. Another way to use it is to look at two currencies (weak vs strong) to find the best single pairs
MetaTrader 4 version available here: https://www.mql5.com/en/market/product/25793 FFx Pivot SR Suite PRO is a complete suite for support and resistance levels. Support and Resistance are the most used levels in all kinds of trading. Can be used to find reversal trend, to set targets and stop, etc. The indicator is fully flexible directly from the chart 4 periods to choose for the calculation: 4Hours, Daily, Weekly and Monthly 4 formulas to choose for the calculation: Classic, Camarilla, Fibonac
ClassicSBA
Umri Azkia Zulkarnaen
this indicator very simple and easy if you understand and agree with setup and rule basic teknical sba you can cek in link : please cek my youtube channel for detail chanel : an for detail info  contact me  basicly setup buy (long) for this indicator is Magenta- blue and green candle or magenta - green  and green candlestik and for setup sell (short) is Black - yellow - and red candle or black - red  and red candlestik
A scalping indicator based on mathematical patterns, which on average gives signals with relatively small SL, and also occasionally helps to catch big moves in the markets (more information in the video) This indicator has three main types of notifications: The first type warns of a possible/upcoming signal on the next bar The second type indicates the presence of a ready signal to enter the market/open a position The third type is for SL and TP levels - you will be notified every time price re
Recommended TimeFrame >= H1. 100% Non Repainted at any moment.  Use it carefully, only with Trend Direction. Trading Usage: 2 Variants: as Range System or as BreakOut System (Both Only With Trend Direction)::: (Always use StopLoss for minimise Risk); [1] as Range System: (Recommended) in UP TREND:  - BUY in Blue Line , then if price goes down by 50 points (on H1) open Second BUY.   Close in any Profit you wish: TrailingStop(45 points) or Close when Price touches upper Gold Line. in DOWN TREND
this indicator is a Spike detector indicator, it is specially designed to trade Boom 1000, Boom 500, Crash 1000 and Crash 500 We recommend using it on Deriv Boom and Crash indices only Its setting is intuitive, familiar, easy to use it has notification functions; audible notifications and push notifications. this tool is simple to use, easy to handle This update is based on different strategies for spikes
Limitless MT5 is a universal indicator suitable for every beginner and experienced trader. works on all currency pairs, cryptocurrencies, raw stocks Limitless MT5 - already configured and does not require additional configuration And now the main thing Why Limitless MT5? 1 complete lack of redrawing 2 two years of testing by the best specialists in trading 3 the accuracy of correct signals exceeds 80% 4 performed well in trading during news releases Trading rules 1 buy signal - the ap
QuantXSTocks Trading Range Indicator for MT5: INSTRUCTIONS TO USE OUR INDICATOR:- User needs to take trade on Arrow or after an Arrow CandleStick, You can achieve up-to 35-125 pips target by this Indicator. Best Timeframes for Stocks and Indices are M30 and H1: AMAZON M30 (50 pips) TESLA M30 (50 pips) APPLE M30 (50 pips) ADOBE M30 (50 pips) NASDAQ100 H1 (125 pips) The above are the approximate amount of pips you can achieve by this Indicator, Green arrow appears to be buy arrow while the Red ar
Trend and Signals MT5  indicator scans  30 trading Instruments (Forex, Metals and Indices).     It uses special algorithm on the  current market   based on   Pure Price Action   and display the overall trend and signal on the dashboard. When signals are produced the indicator sends alert and notification. Strategy for Signals This indicator uses the daily timeframe to determine the direction of the trend. The hourly timeframe is used to identify possible entries. Main trend and is determined by
This indicator is based on a mathematical formula and an ANN combined, designed to make a model(using previous prices) of the most recent market condition (any chart*) in order to use the model as a forecasting tool. *This indicator can operate on any chart/timeframe, but it's suggested you use multiple timeframes for each trade because this method relies solely on the time factor, you can not use this indicator to predict price volatility, but if it's fit correctly it will show you when the nex
This indicator is based on the crossing of two Moving Average with the RSI It is intended for scalpers Specially designed for Boom and Crash syhtetic indices from Binary.com/Deriv.com It is easy to use and intuitive. We recommend its use on M1 and is equipped with three types of notification Email alert Sound notification Push notification these parameters can be activated and deactivated.
IVISTscalp5
Vadym Zhukovskyi
5 (6)
[iVISTscalp5]:時間を通じた市場行動研究ラボ TLV Framework | Liquidity Activation Points ⸻ 概要 iVISTscalp5 は、VISTmany プロジェクトの一環として開発された、多層型のタイミングおよび価格構造インジケーターです。 このシステムは、Liquidity Activation Points(タイミング)を通じて、 動きが発生する時間 方向性 値動きの範囲 を予測します。 iVISTscalp5 インジケーターは、デフォルト設定のまま、あらゆる金融商品に使用できます。 ⸻ 実践的価値 iVISTscalp5 は、一般的なテクニカル指標として開発されたものではありません。 開発の中心的な理念は次の通りです。 あらゆる人が「時間」を通じて市場行動を研究できるようにすること。 ⸻ Time Language VISTmany (TLV) — プロジェクトの主要概念 t(p) t(p) は、タイミングが活性化する価格レベルです。 ⸻ p(p) p(p) は
Use with JUMP 25. However it can can with the volatility indices as well because it is a modified version. It is advisable to use create a healthy account management. Measure your risk and happy trading. Other experts to be loaded soon. These are modified in order to optimise profits. Ideal candidates are high risk, high returns individuals who hold trades at a maximum of 1 - 2 hours

This indicator is a scalping indicator intended solely for the Boom and Crash indices of the Deriv Limited market It supports Boom 500, Boom 1000, Crash 500 and Crash 1000 Not repaint and no bug The settings are intuitive and easy to use The product activation number is 20 The Time Frame used depends on the user If you are an aggressive scalper then just use M1 For long trades use M15 If you are conservative use M5 Please contact me for more details of its use
作者のその他のプロダクト
TickVolume Profile for MetaTrader 5 TickVolume Profile displays a rolling price profile built from the tick history available for the chart symbol. The histogram, Point of Control (POC), Value Area High (VAH) and Value Area Low (VAL) help you examine where activity is concentrated within a selected lookback. This is a free visual chart-analysis indicator, not an Expert Advisor, and it does not open or manage trades. Profile and key levels Rolling lookback: uses chart bars rather than a fixed tra
FREE
Major Market Structure is a technical analysis indicator for MetaTrader 5 designed to display confirmed market structure directly on the chart. The indicator focuses on significant swing points instead of marking every minor price fluctuation. It helps traders observe the relationship between major highs, major lows, structural breaks and potential reaction zones across different market conditions. Main features Displays confirmed Major High and Major Low points Identifies bullish and bearish Br


FREE
フィルタ:
レビューなし
レビューに返信