MarketProfileEngine
- Indicadores
- Versão: 1.1
- Ativações: 5

MarketProfile Engine
Market Profile analysis, value areas and session context for MetaTrader 5
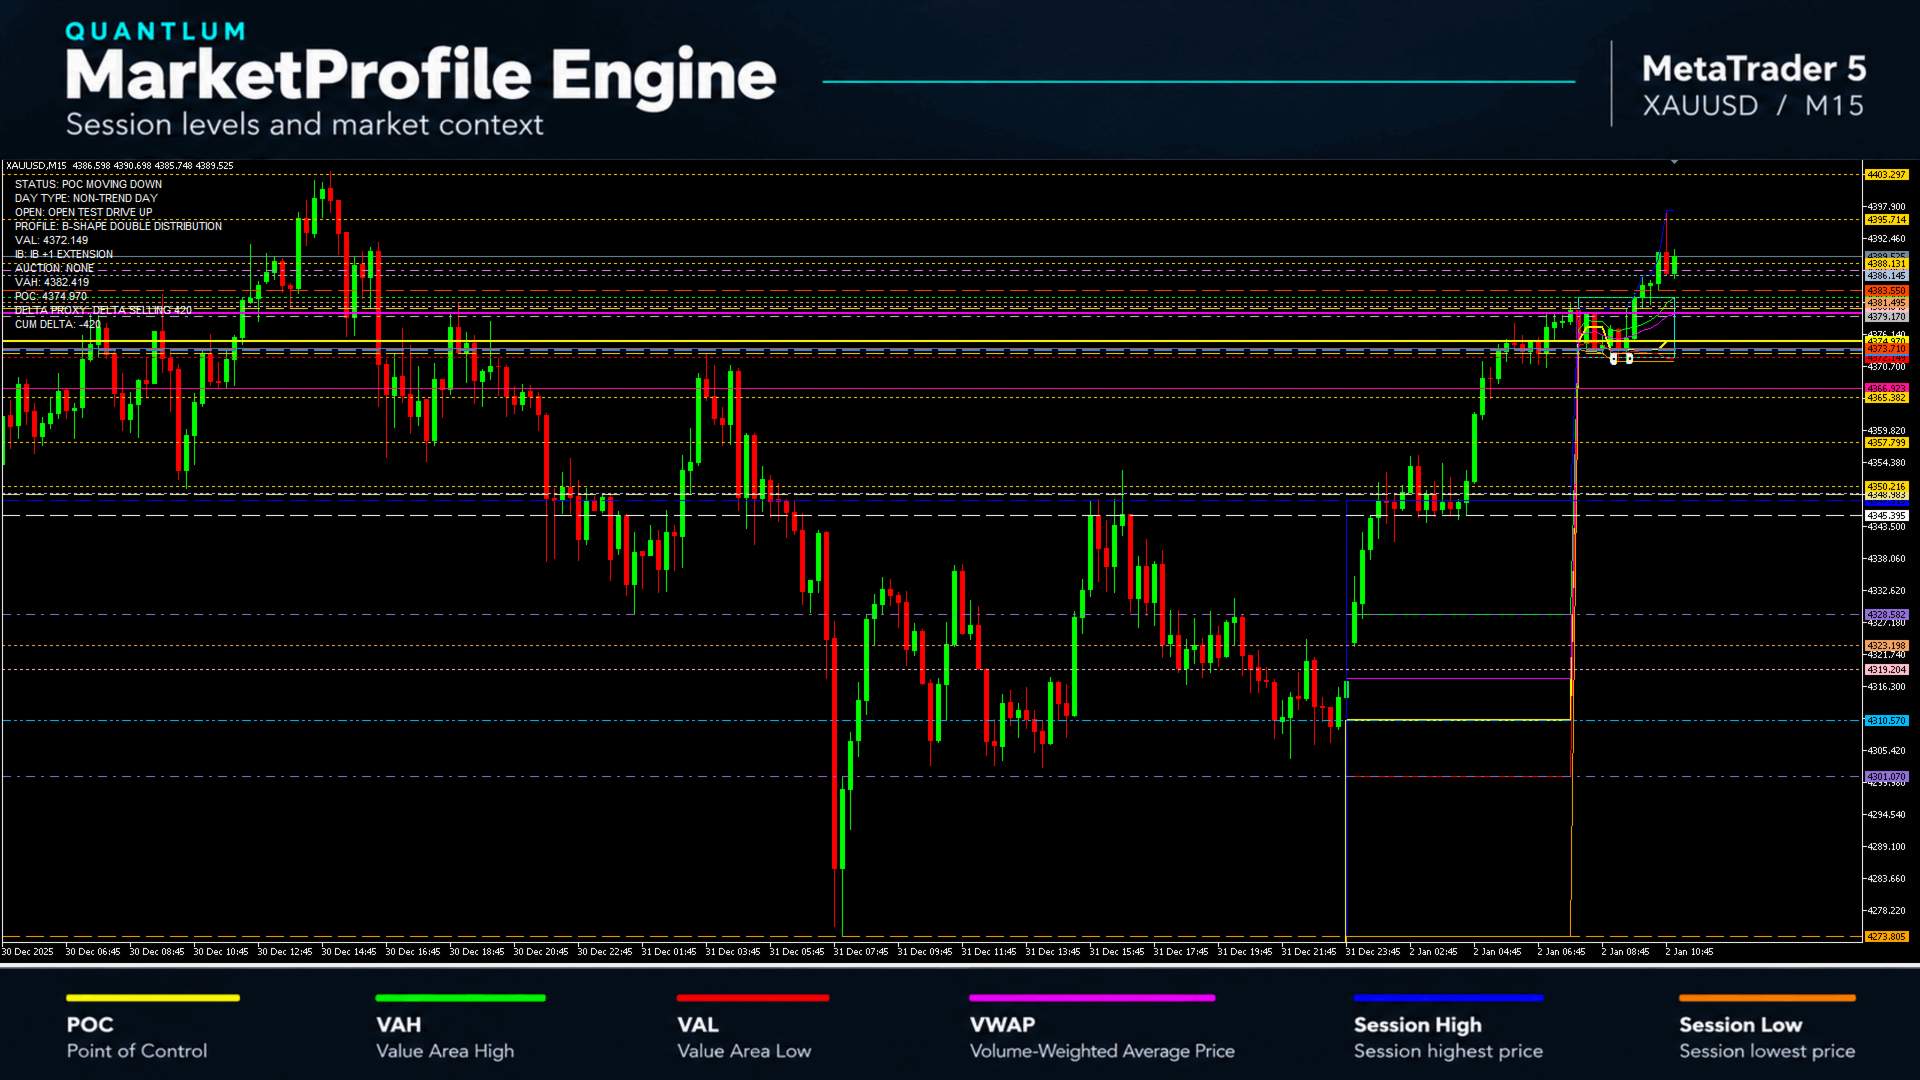
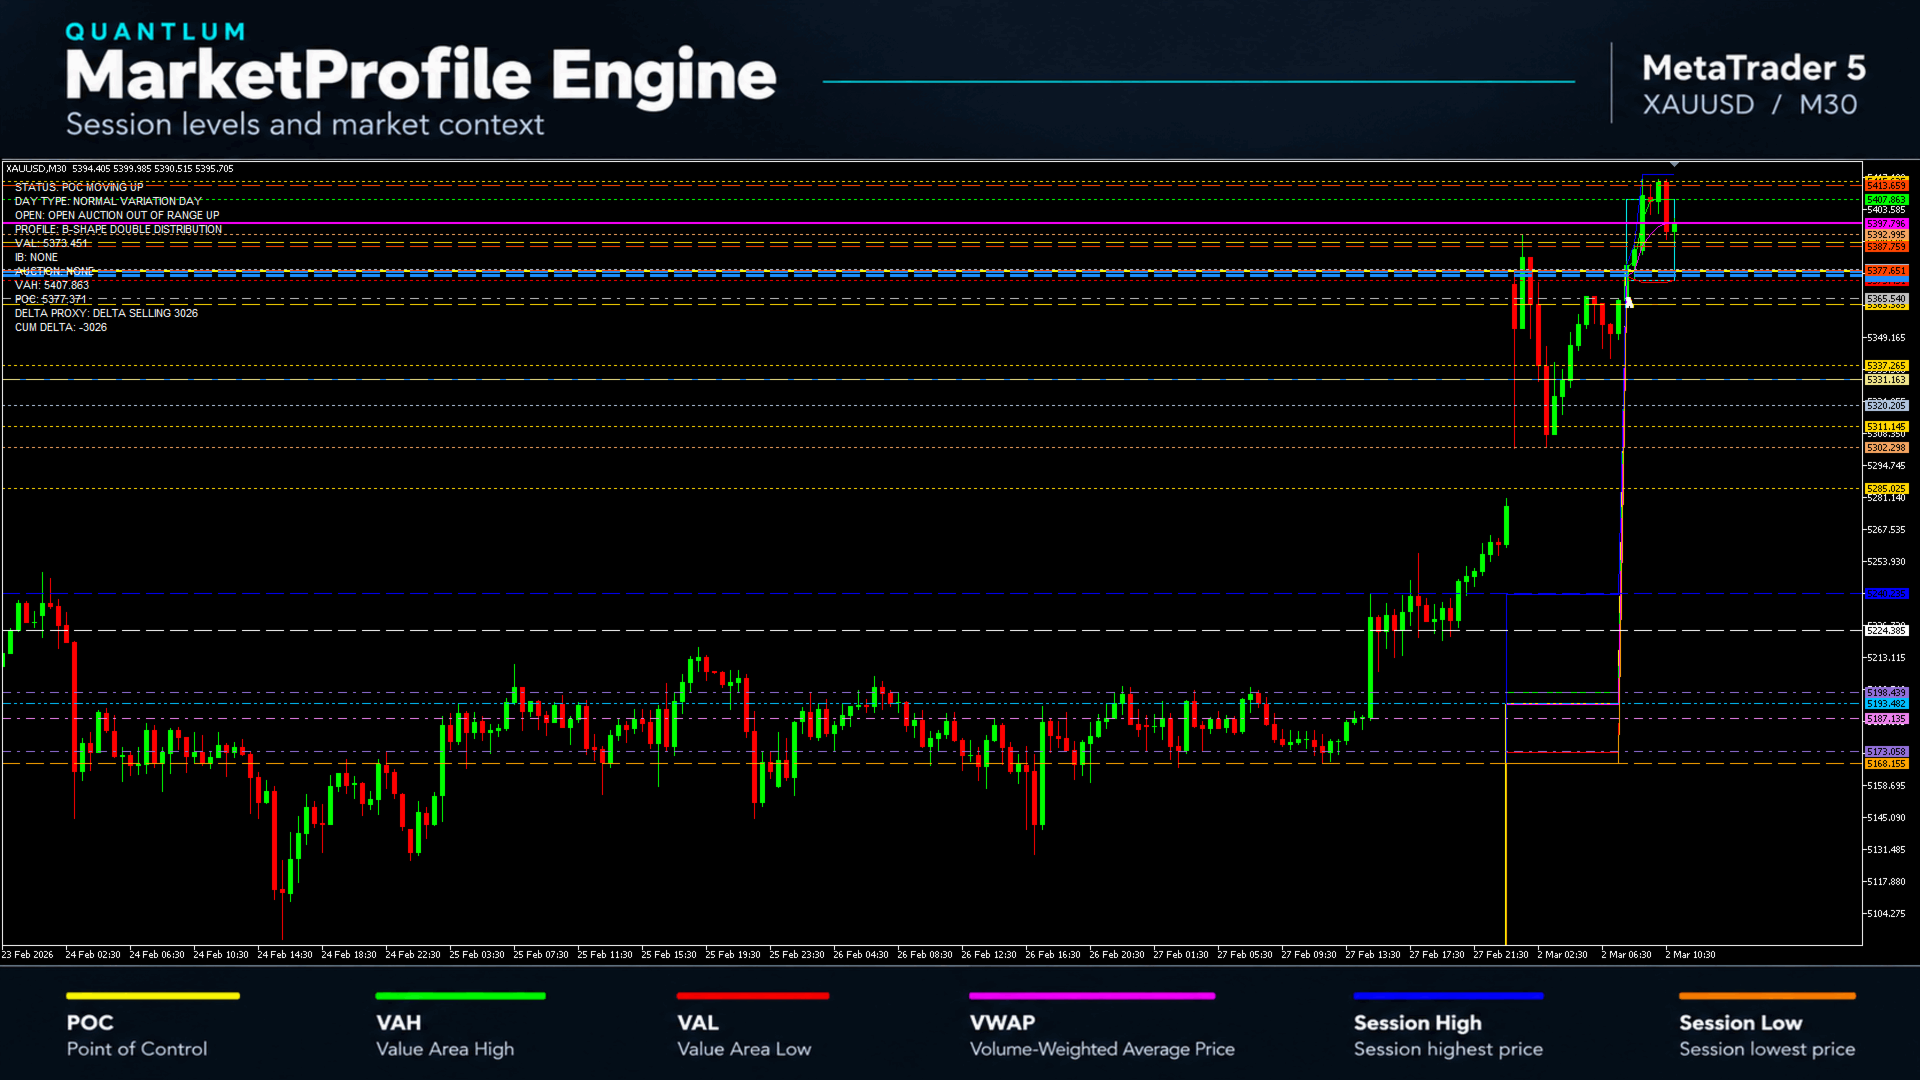
MarketProfile Engine is an advanced analysis indicator for MetaTrader 5 that brings Volume Profile, Time Price Opportunity (TPO) analysis and key market reference levels together on your chart.
It helps you examine where price is trading relative to value, follow changing bullish and bearish conditions, and study how the market responds around important levels. An integrated information panel adds context to the selected session, supporting a structured approach to chart analysis.
MarketProfile Engine is designed for traders who want to understand price movement within the broader session structure and use that information when developing their own trading scenarios.
Key features
-
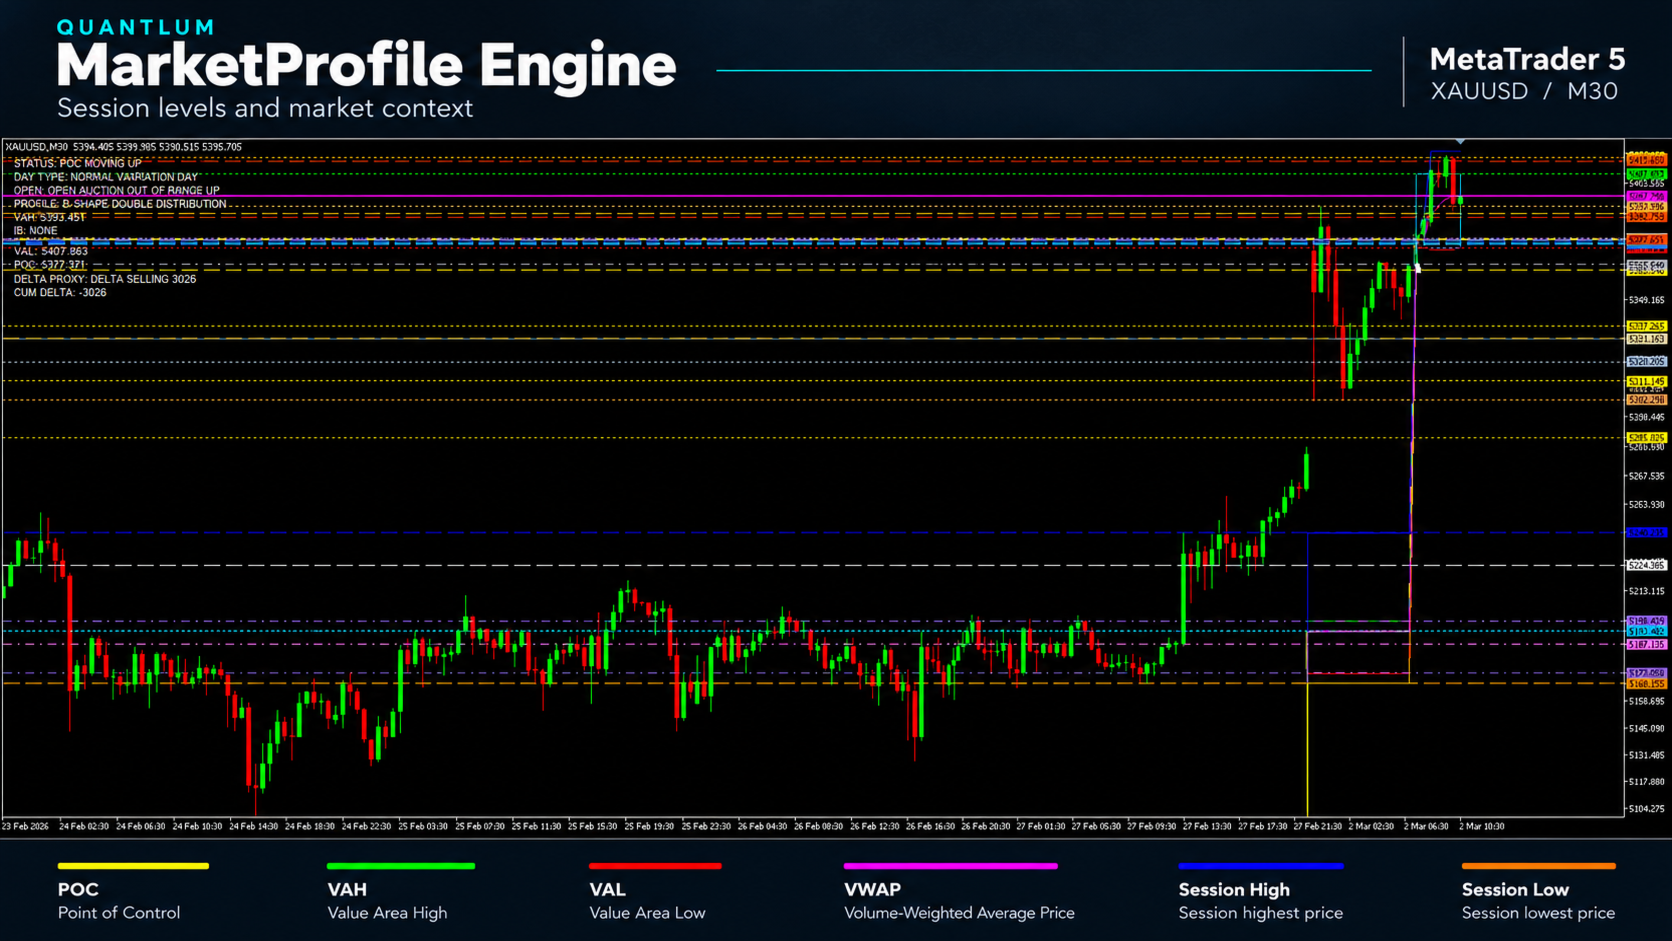
Volume and TPO profile views. Display profile information alongside Point of Control (POC), Value Area High (VAH), Value Area Low (VAL) and Volume Weighted Average Price (VWAP). TPO letters and a chronological matrix provide additional ways to examine the session.
-
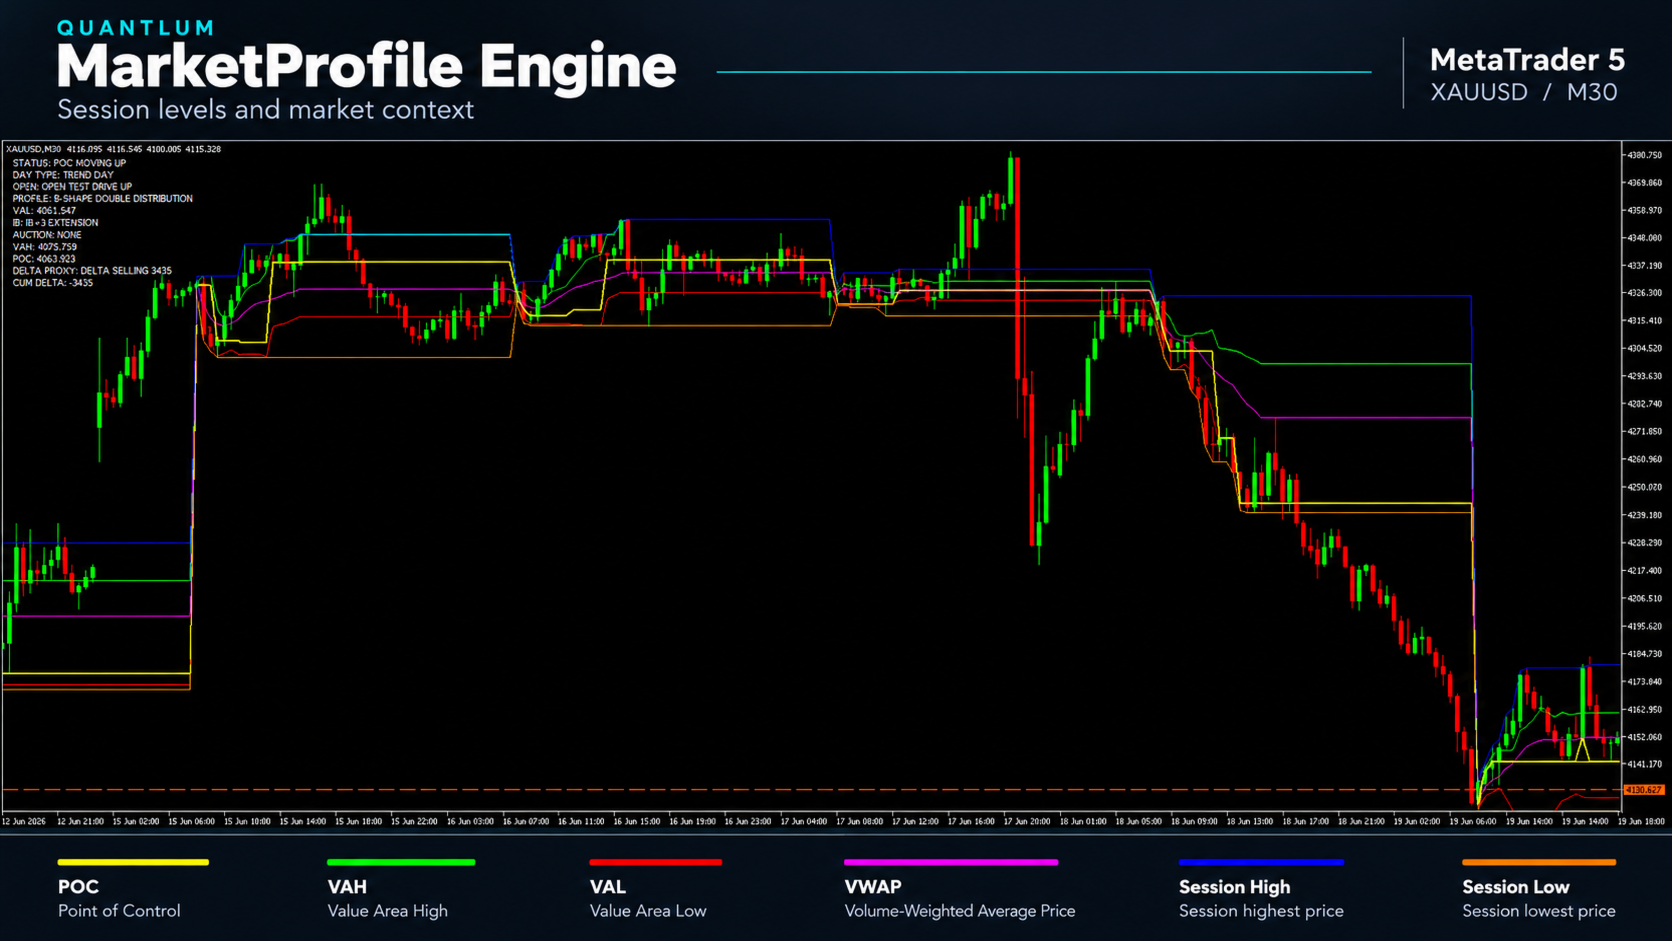
Initial Balance levels and extensions. Follow Initial Balance High and Low, together with three extension levels above and below the initial range, including MP-IB-3-HIGH and MP-IB-3-LOW. These levels provide reference points for observing range expansion and price reactions.
-
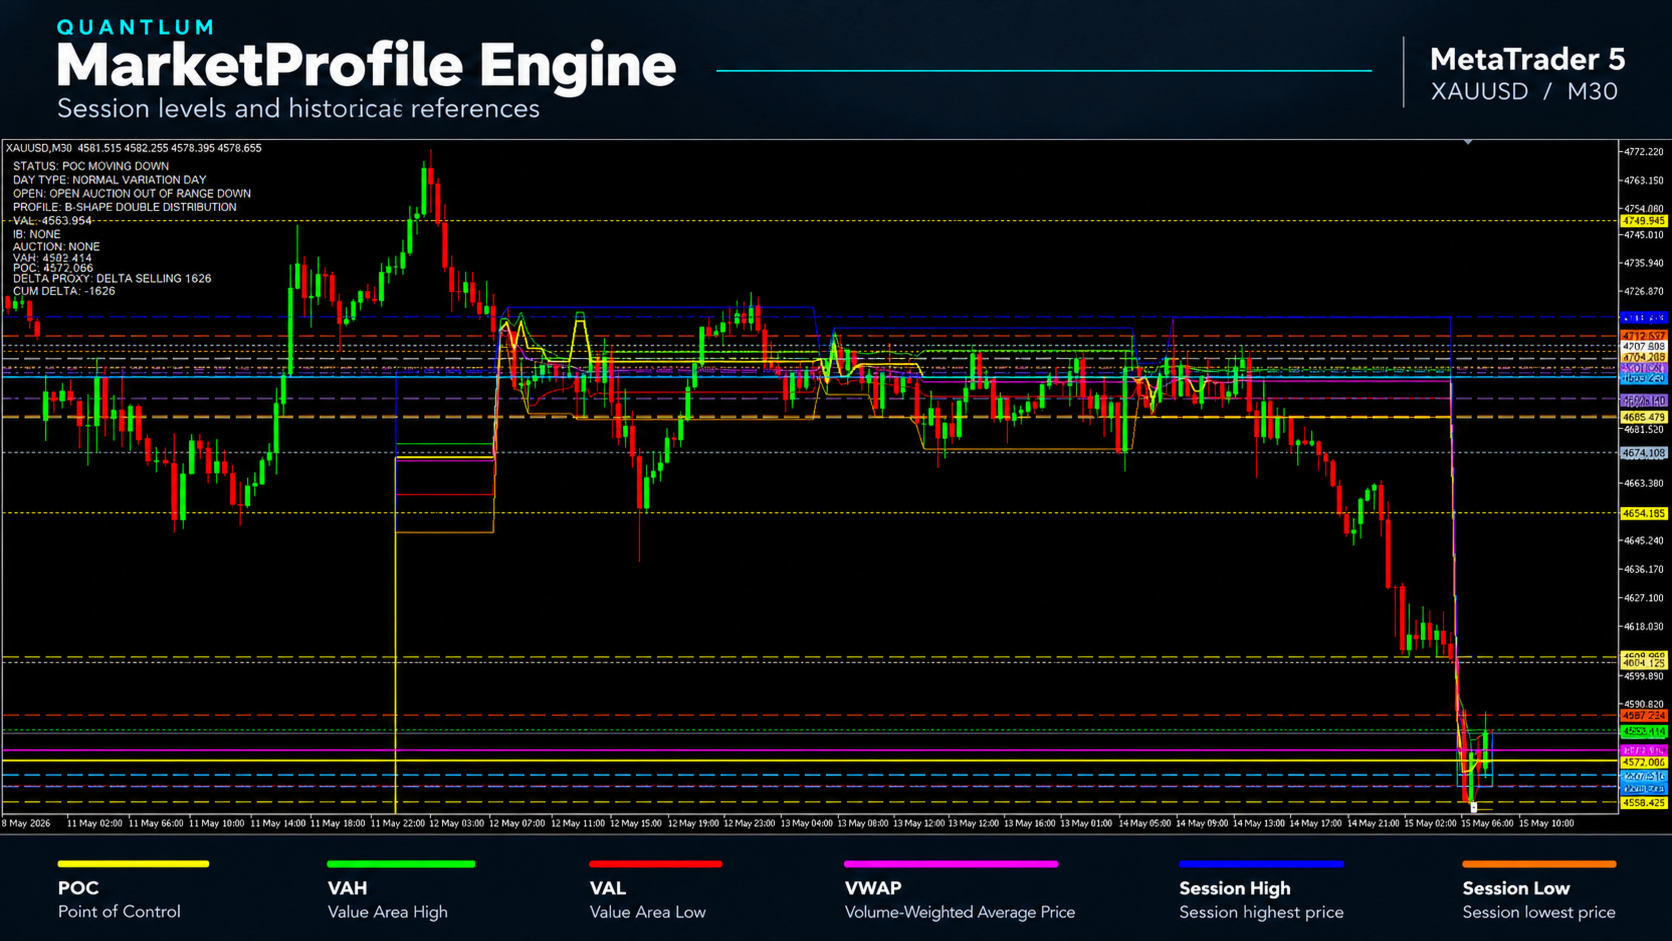
Historical and broader market references. View previous-session price levels, historical POC and value-area references, high and low volume nodes, and references across multiple sessions, including weekly and monthly levels.
-
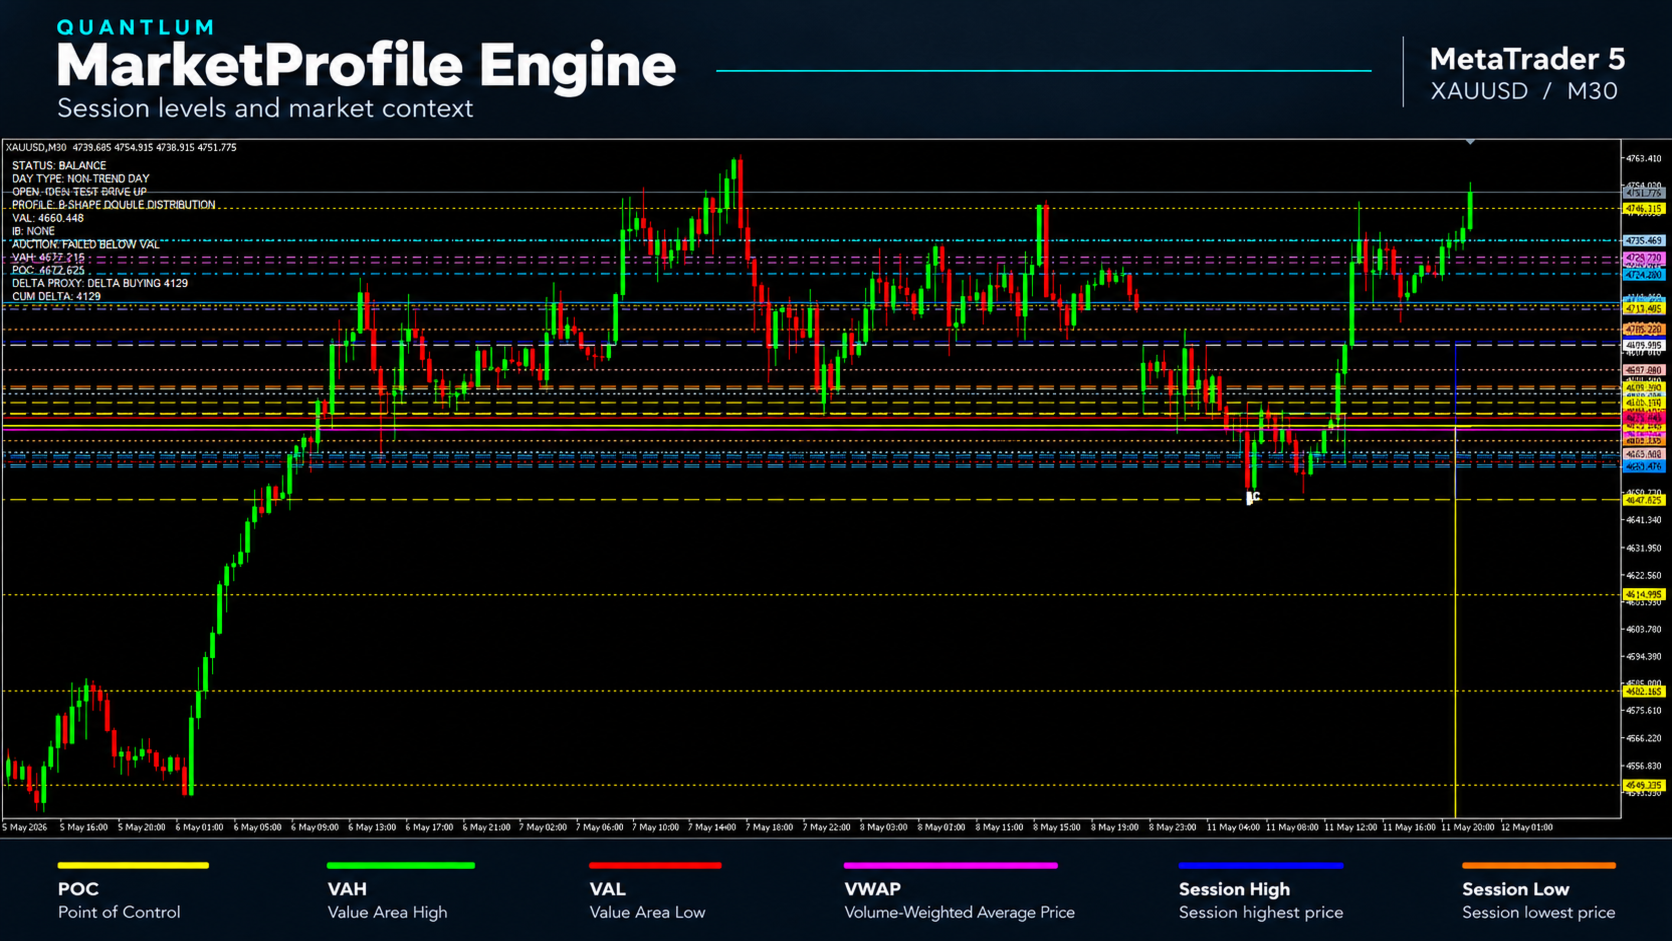
Session information panel. Review a structured summary of the selected session, including opening behavior, session structure, value-area conditions and directional context. Compact and full display modes let you choose the amount of information shown.
-
Flexible chart presentation. Adjust session settings, profile display options, colors, text and panel placement to suit your chart layout and analysis preferences.
Read price movement in context
MarketProfile Engine gives you reference levels for studying several types of market behavior.
During a directional move, you can follow how price progresses through the session’s value area and Initial Balance extensions. Around a breakout, you can examine whether price remains beyond a reference level or returns to the previous range. During a pullback, you can observe the reaction when price revisits an earlier level.
In more balanced conditions, the profile and value-area references help you examine how price is distributed within the session and where activity is concentrated.
This supports a consistent analysis process: identify the relevant area, observe the market’s response and assess the situation within the wider session context. Each level should be interpreted together with price behavior and your own trading rules.
Getting started
-
Attach MarketProfile Engine to a chart in MetaTrader 5.
-
Select the session you want to analyze and check the session time settings against your broker’s chart time.
-
Choose your preferred profile view, display options and information panel mode.
-
Review the displayed levels and session context before applying your own entry, exit and risk-management rules.
Sufficient historical data must be available for the selected symbol and analysis period.
Data and interpretation
The information displayed depends on the market data available from your broker. Volume and delta readings may include estimates. Developing session levels and panel readings can change as new market data becomes available.
MarketProfile Engine is an analytical indicator. It does not place or manage trades automatically.
Guidance and support
Further usage guidance and practical chart examples are planned to help users understand the displayed levels, session context and chart interpretation.
For setup questions and product support, please use the product’s Comments section or contact the author through MQL5.
Risk information
MarketProfile Engine supports market analysis and does not guarantee trading results. Historical chart examples illustrate past price behavior and do not establish future performance. Trading involves the risk of loss, and users remain responsible for their trading decisions and risk management.