AR Projection
- インディケータ
-
Milana Muslimova
 Hi, I'm Milana.
 - バージョン: 1.1
Average Range Projection (ADR / AWR / AMR) – Milana Trades
This indicator shows how far price can still move today, this week or this month, based on its average range.
THE IDEA
Every market has a normal size of a day. If the market usually moves 100 points a day and the low of the day is already in, the high of the day is likely to be about 100 points above that low. The indicator draws this for you.
WHAT MAKES IT DIFFERENT
Most ADR tools draw fixed levels from the open. This indicator uses the real low and the real high of the current period. The levels follow price and show how much room is left.
HOW IT WORKS
- Average range (AR) is the average of High minus Low of the last 14 completed candles. Only completed periods are used, so the value does not change during the period.
- AR High = low of the current period + AR.
- AR Low = high of the current period - AR.
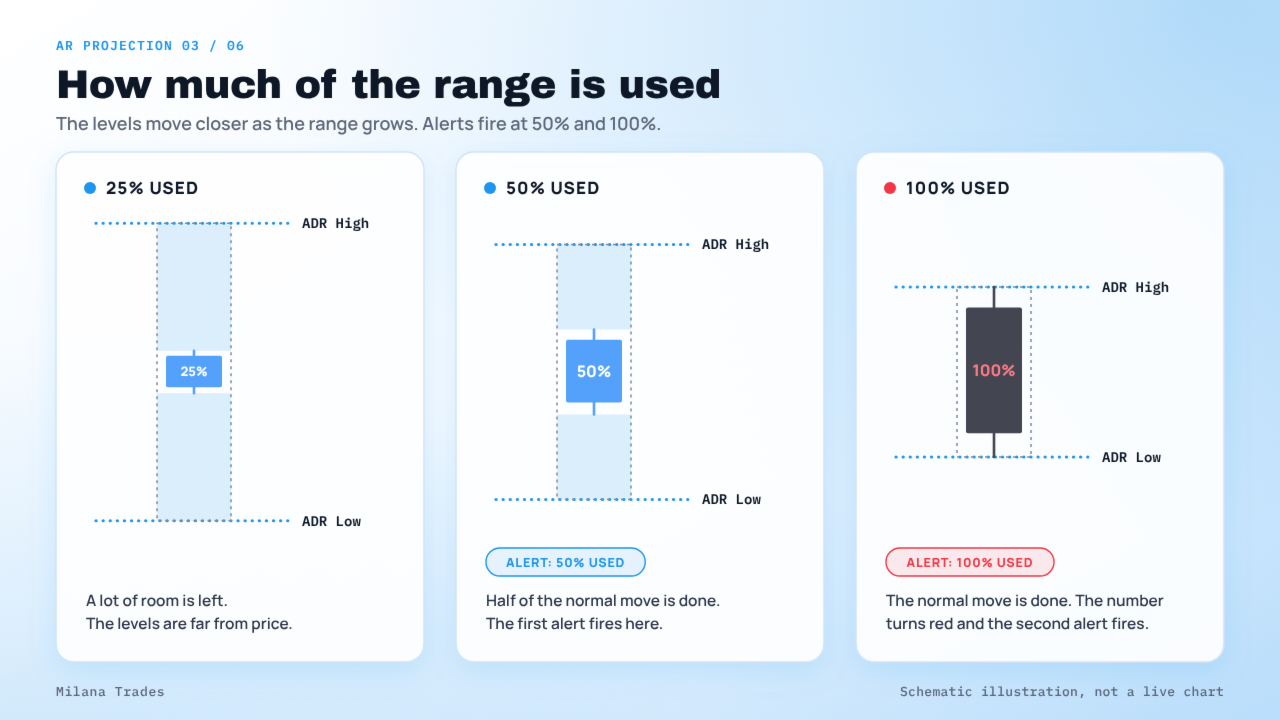
- AR used % = how much of the average range the period has already made.
WHAT YOU SEE ON THE CHART
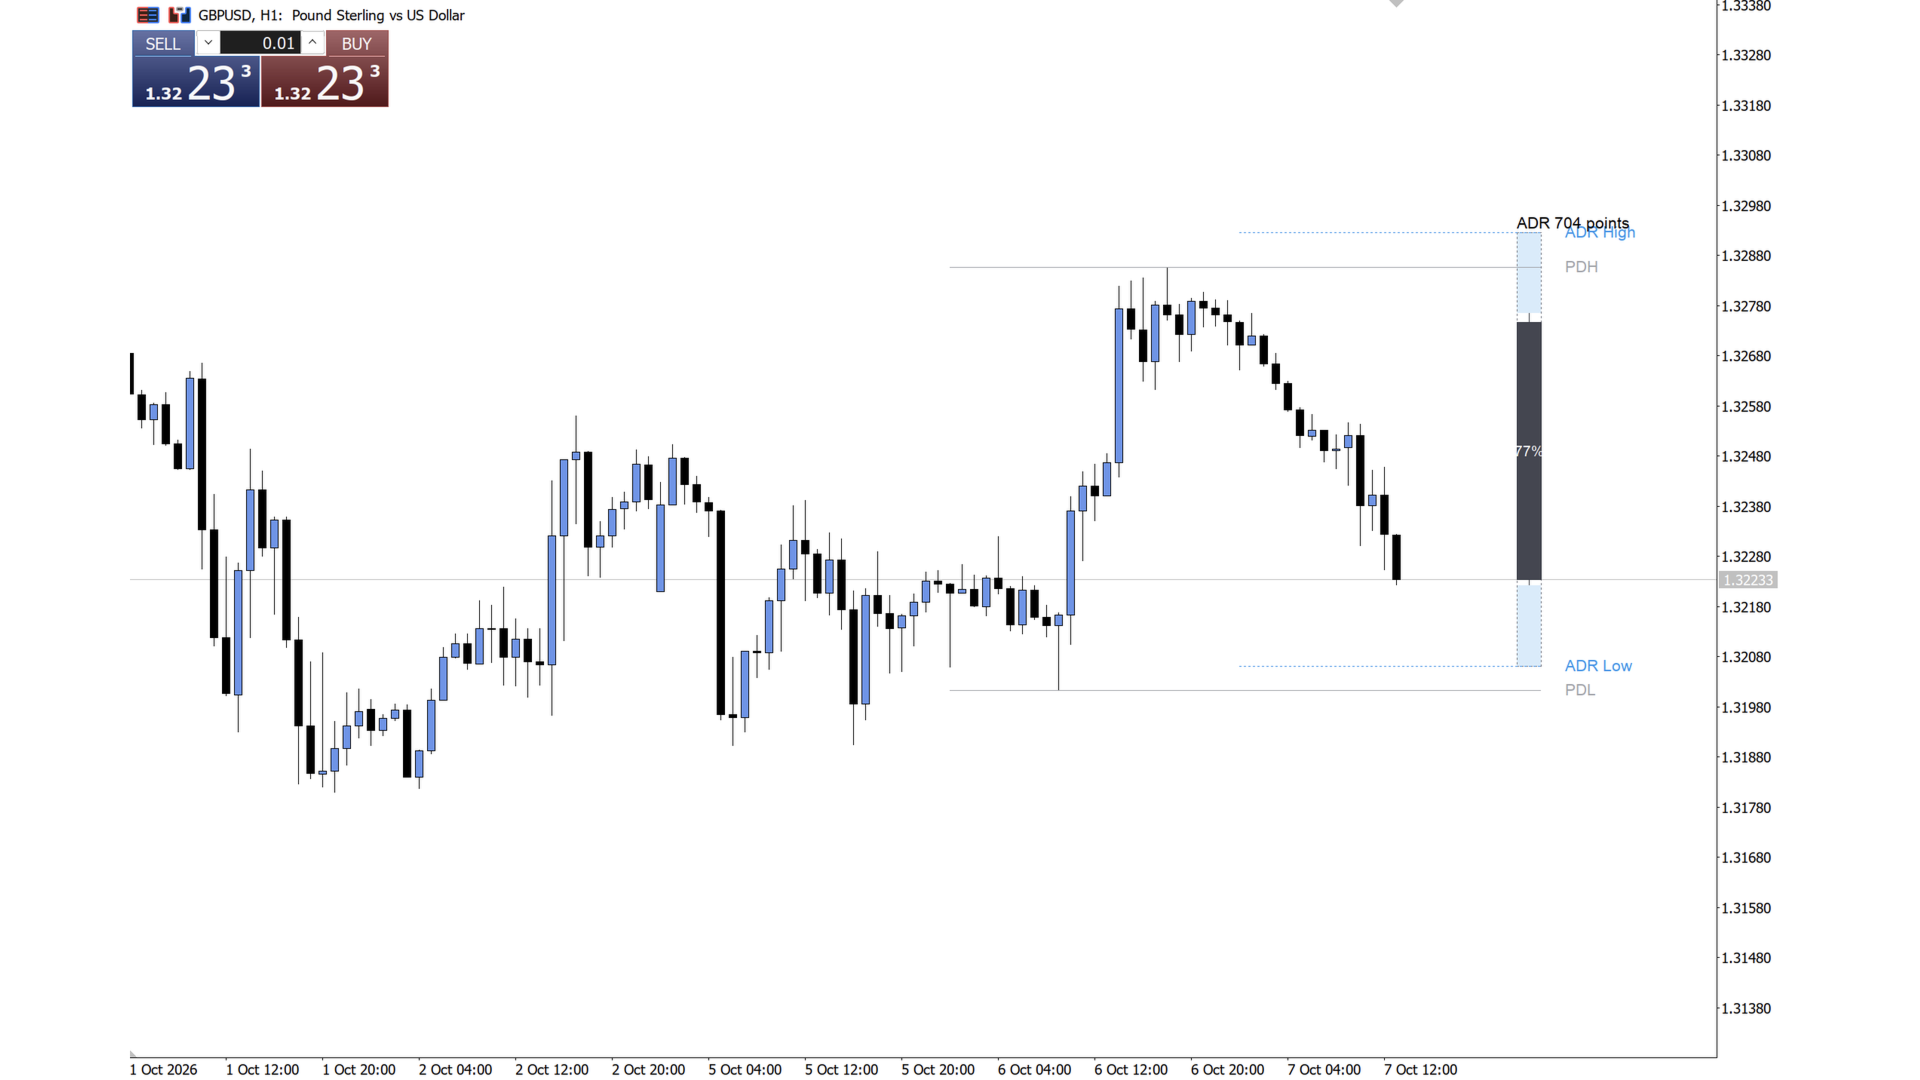
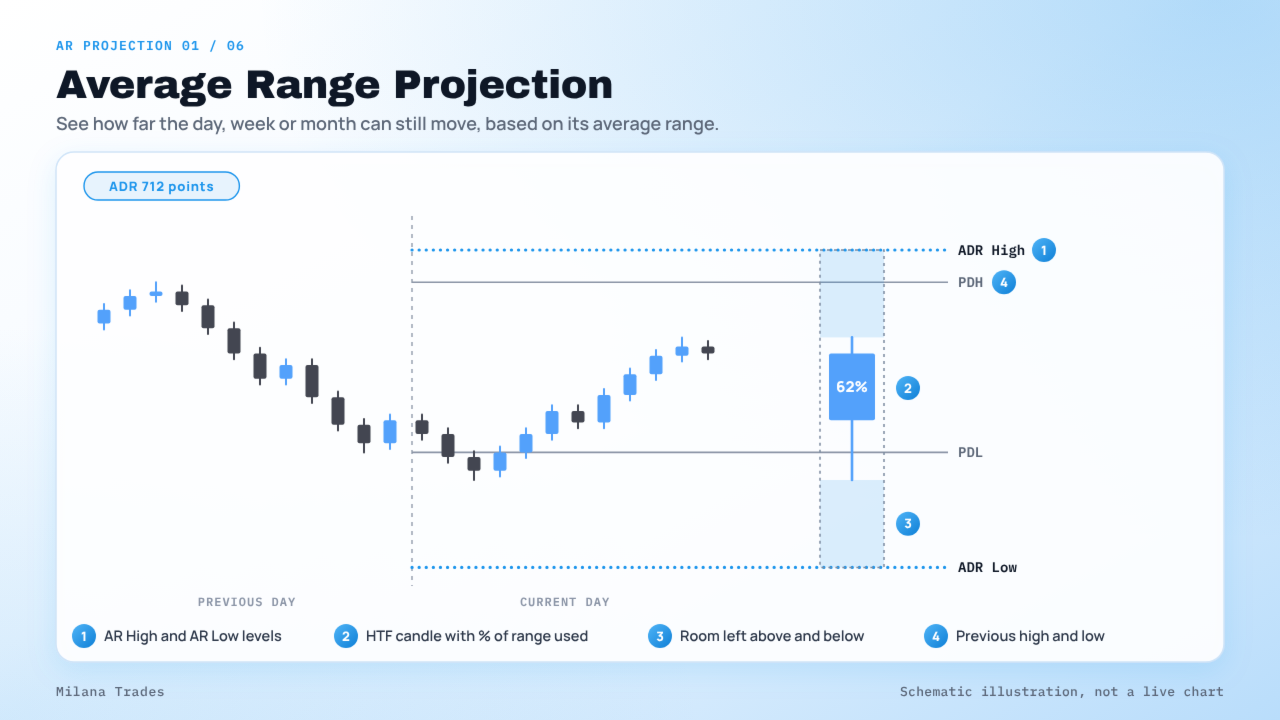
- AR High and AR Low levels. 50% levels are optional.
- The previous period high and low.
- Higher timeframe candle to the right of price, with the AR used % on each candle. At 100% and above the number turns red.
- A dotted projection frame around the current candle. Shaded zones show the room left above and below.
- A label with the current average range value.
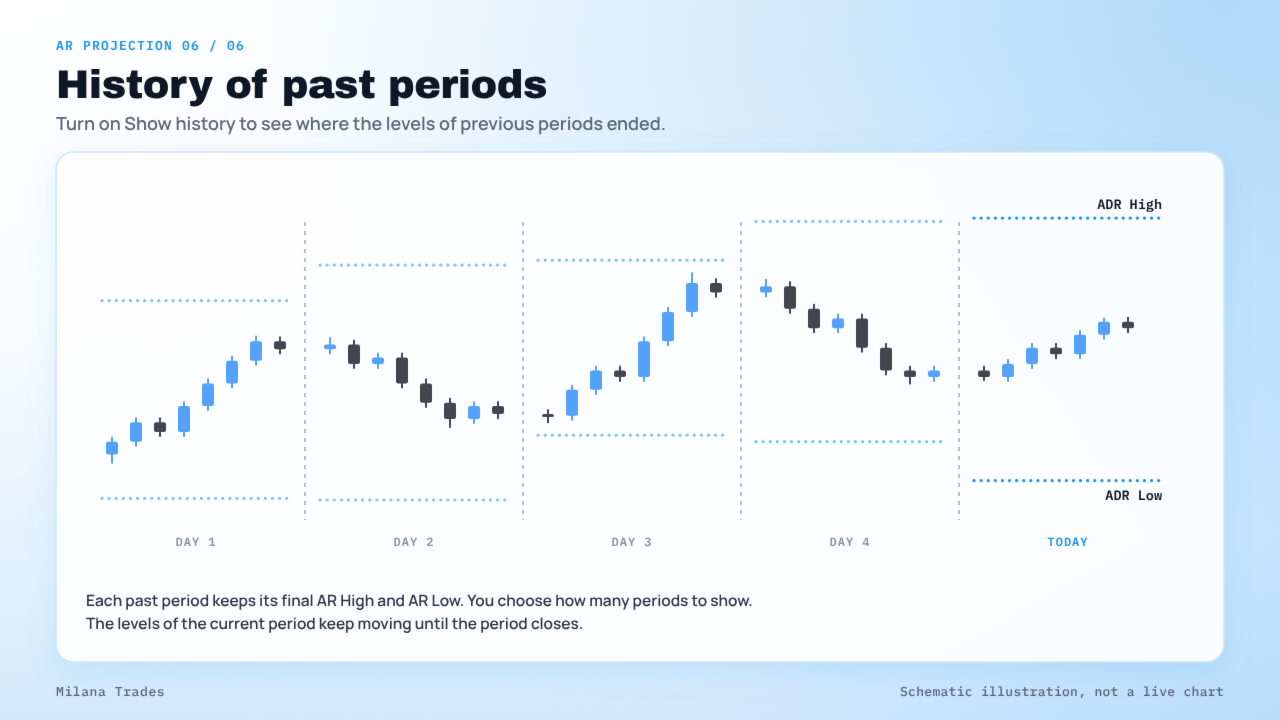
- History: the levels of past periods.
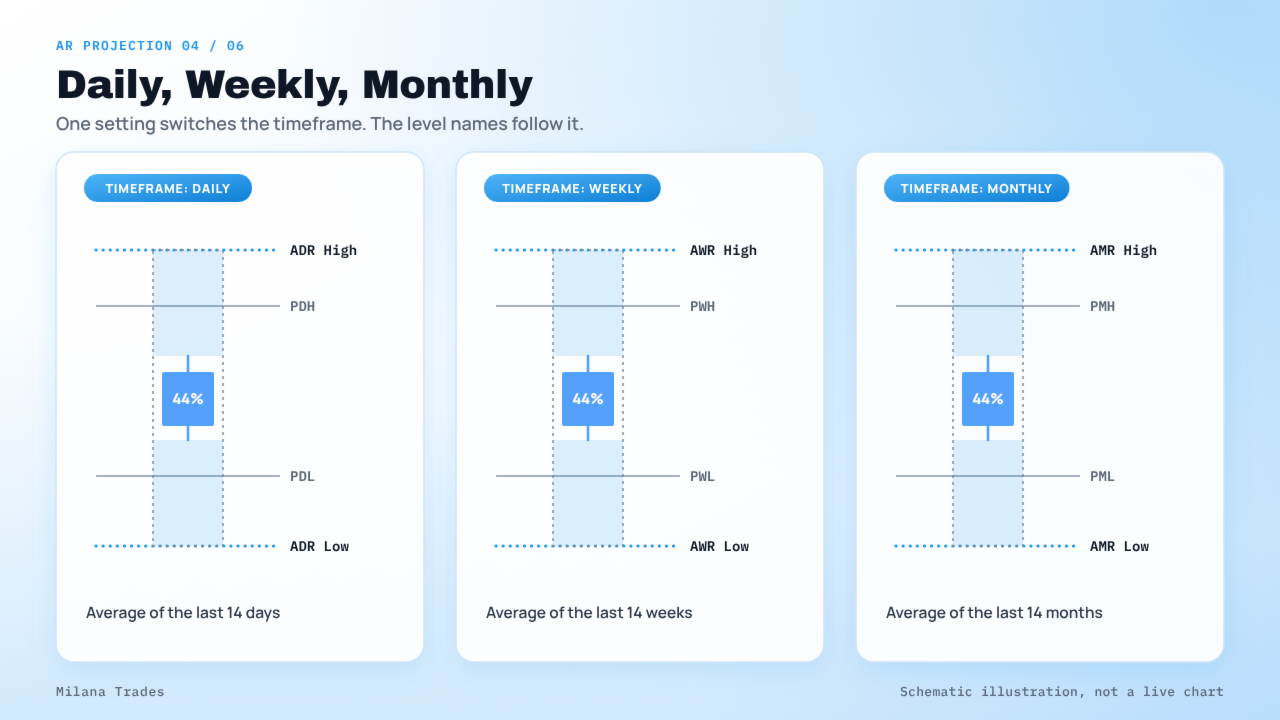
Level names follow the selected timeframe:
- Daily: ADR High, ADR Low, PDH, PDL
- Weekly: AWR High, AWR Low, PWH, PWL
- Monthly: AMR High, AMR Low, PMH, PML
HOW TO USE
- Around 100% the period has already made its normal move. Be careful when you expect more movement in the same direction.
- While the % is low, AR High and AR Low are realistic limits for the period. Check if your target fits inside them.
- Use the levels together with the previous high and low.
ALERTS
- 50% of the average range is used.
- 100% of the average range is used.
Pop-up alerts, and push notifications as an option.
SETTINGS
- Timeframe and number of periods for the average.
- View: candles with projection, or lines only.
- Show or hide: 50% levels, previous high and low, level names, % on candles, range label, history.
- Number of higher timeframe candles and distance from price.
- Colors, line style and line width.
NOTES
- Use a chart timeframe lower than the selected timeframe, for example M15 with Daily.
- The average range does not repaint. AR High and AR Low move during the period on purpose: they follow the current high and low.
- Days, weeks and months start by your broker's server time.
- The range value is shown in MT5 points.
- Colors adapt to a light or dark chart background.
- This is an analysis tool. It does not give trade signals and does not guarantee results.