Fibonacci Pips MT5

  • インディケータ
  • Sindhu Bairavim
    Sindhu Bairavim
    私は、信頼性の高い高品質なソフトウェアソリューションの構築において14年以上の経験を持つテクニカルアーキテクトです。私は、MQL5インジケーターおよびエキスパートアドバイザー(EA)の開発においても、同様の正確さ、構造、そして問題解決への姿勢を活かしています。私の焦点は、トレーダーが市場をより明確に読み解き、憶測を減らし、確信を持ってより情報に基づいた意思決定を行えるよう支援する、実用的な取引ツールの作成にあります。
  • バージョン: 1.0
  • アクティベーション: 20

Fibonacci Pips MT5

Instant Fibonacci Levels, Prices and Pip Distances

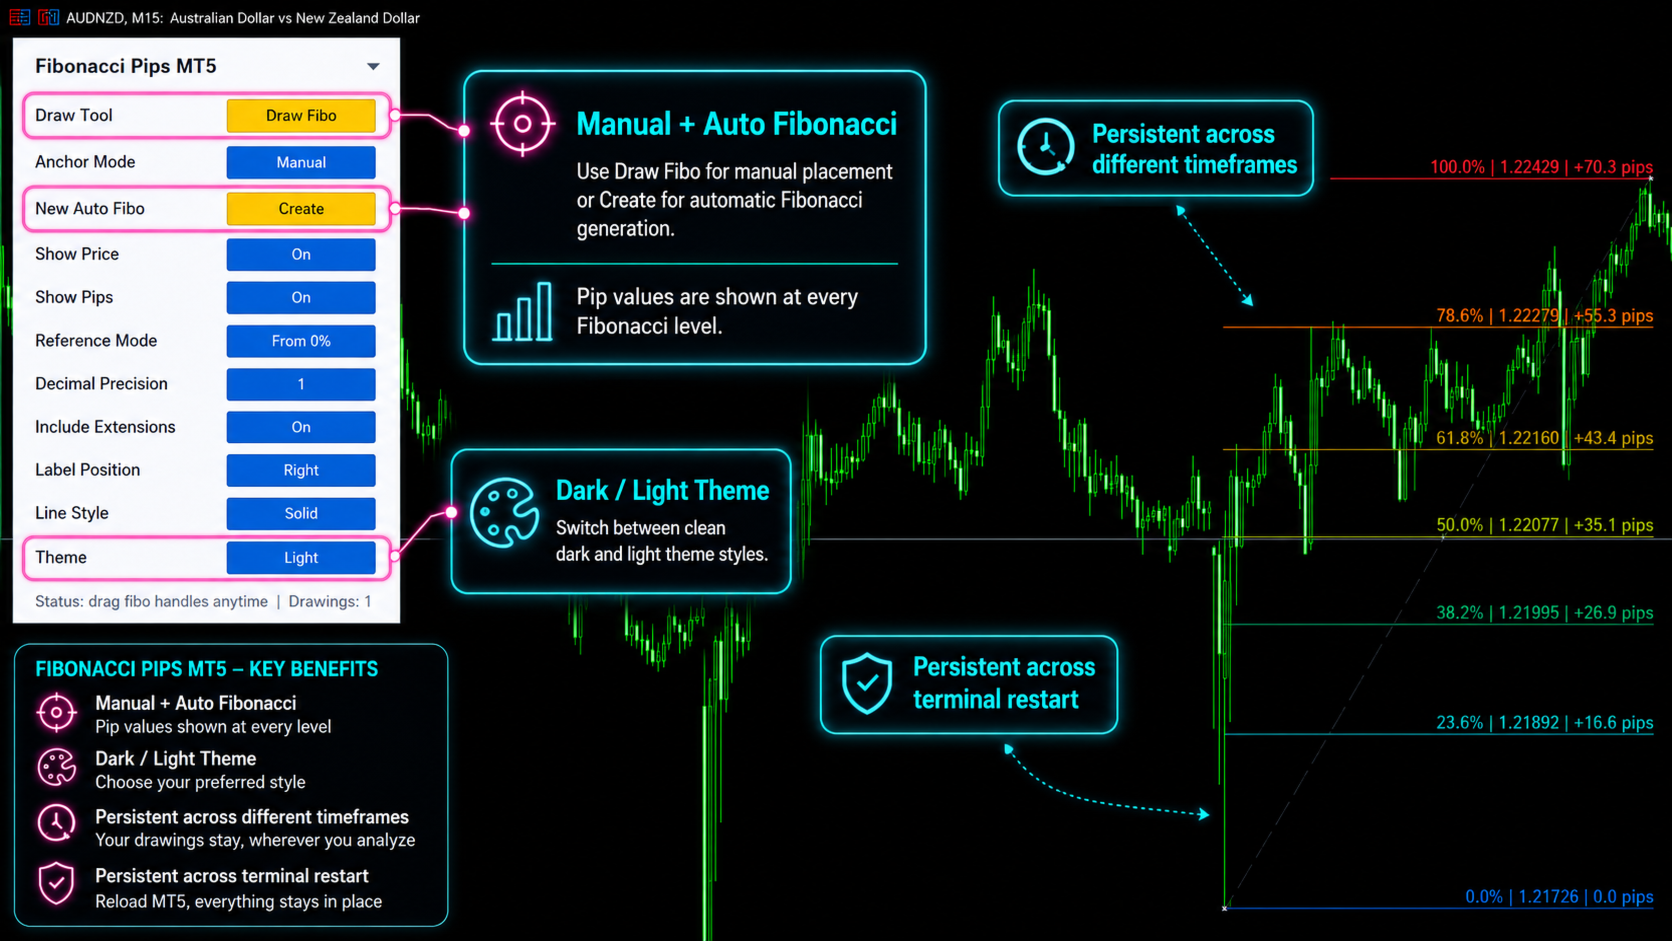
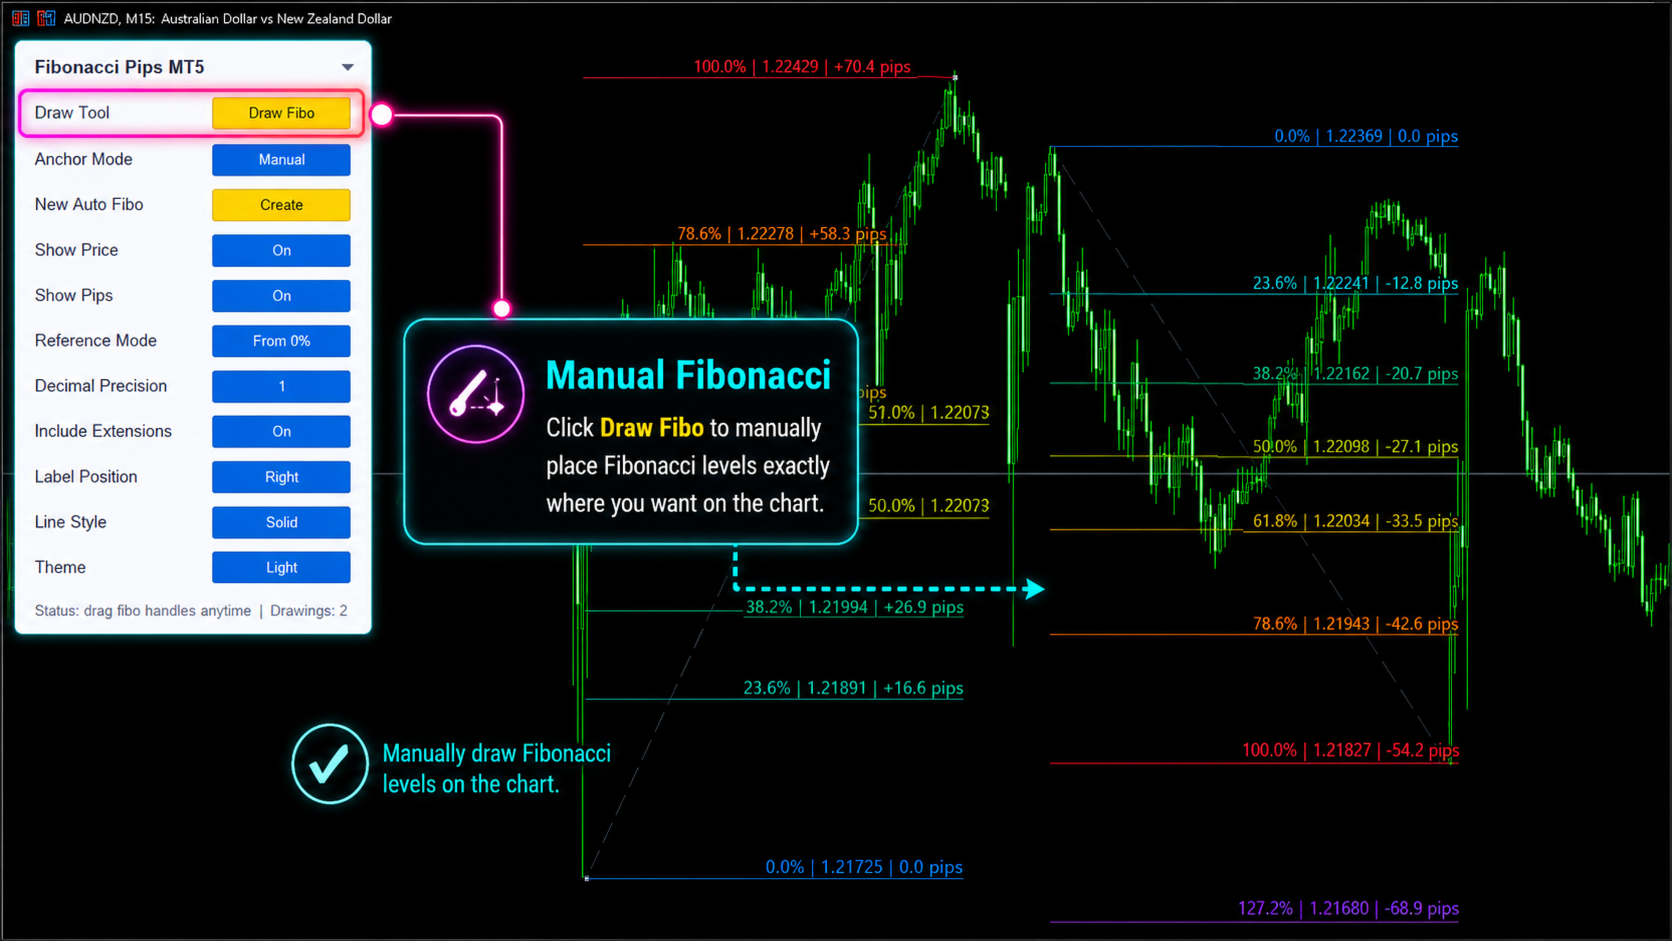
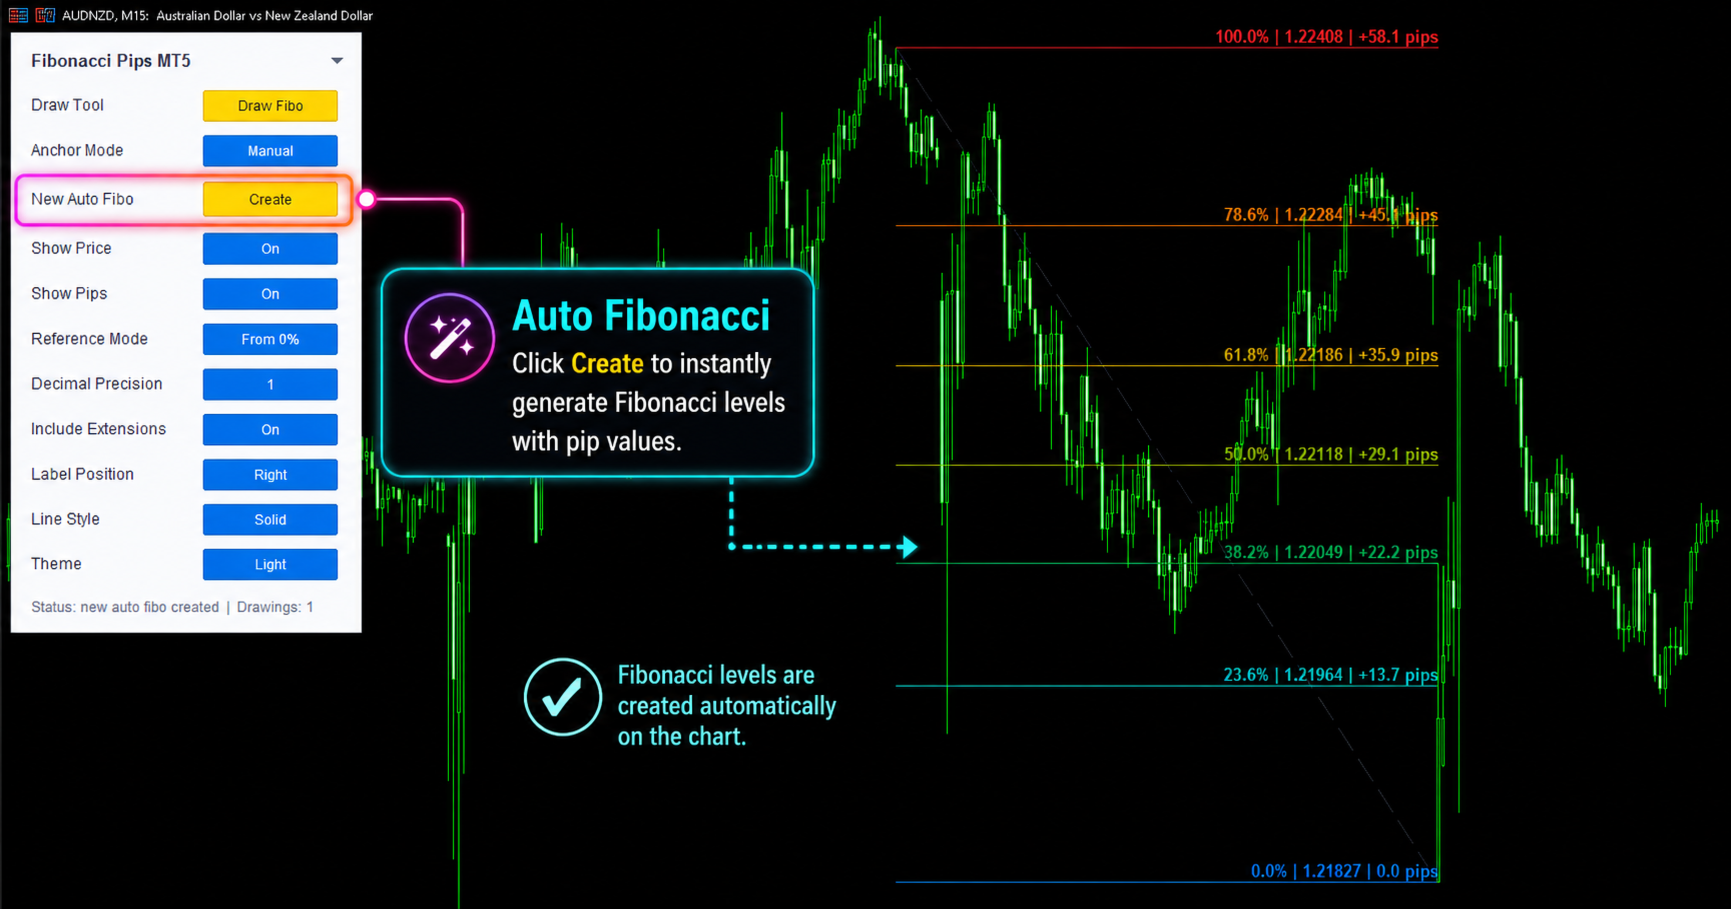
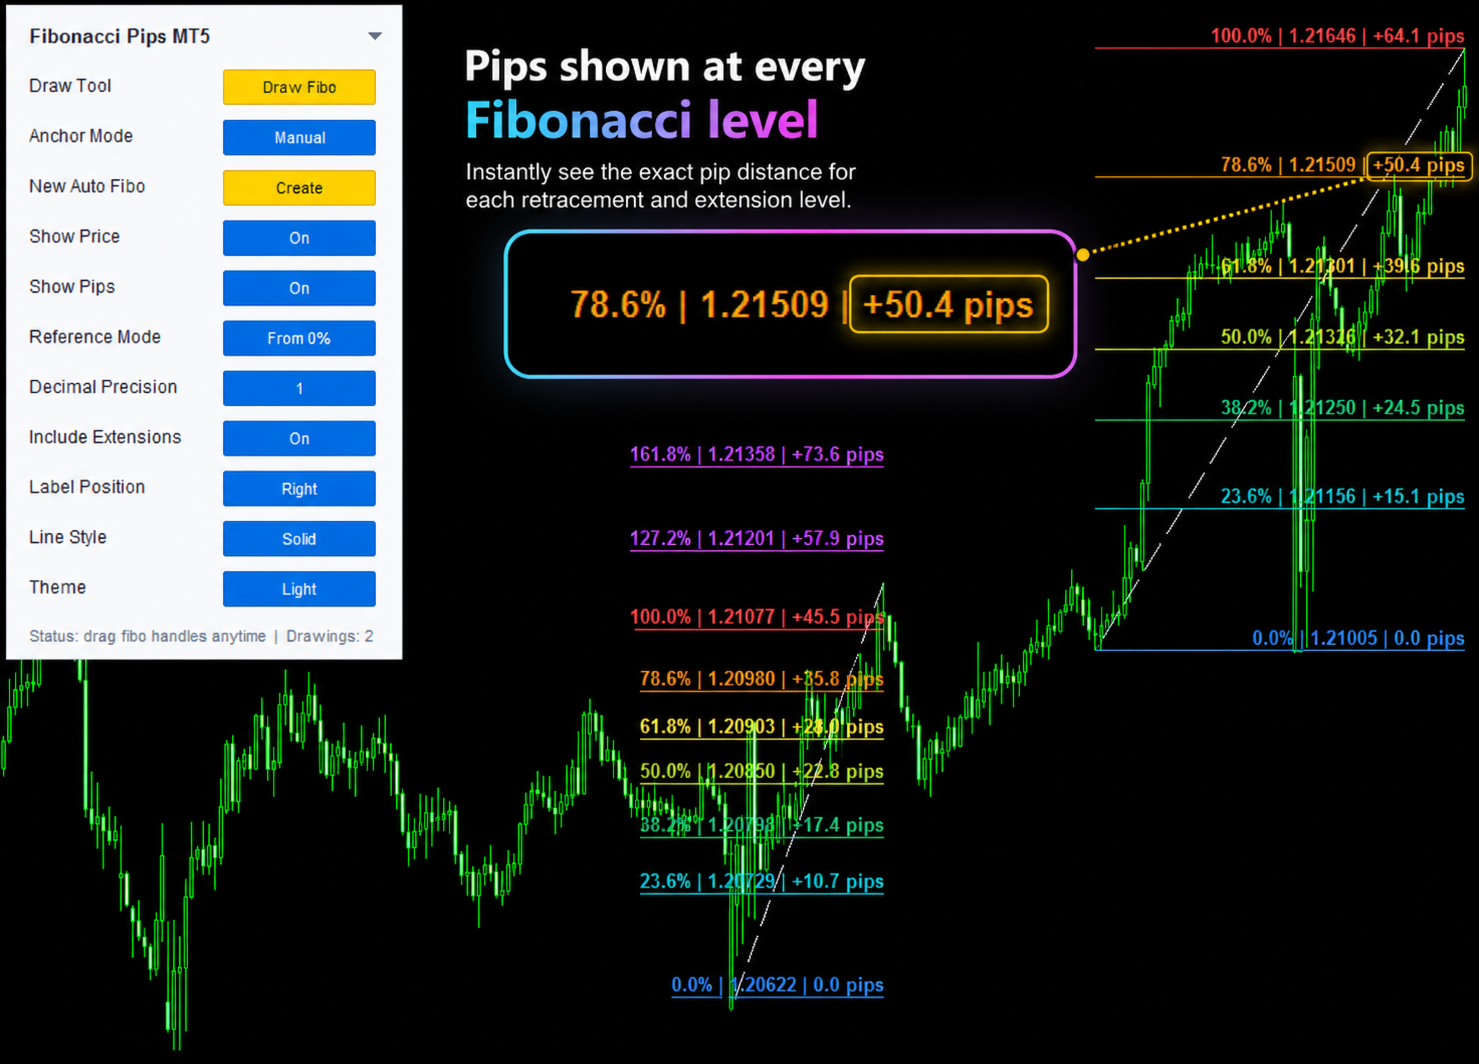
Fibonacci Pips MT5 is a practical Fibonacci measurement tool for MetaTrader 5. It displays each Fibonacci level together with its exact price and pip distance, helping traders plan pullbacks, profit targets and stop-loss levels without manual calculations.

Instead of seeing only percentages such as 38.2%, 50.0% or 61.8%, traders can immediately understand:

  • The Fibonacci level
  • The exact market price
  • The pip distance from the reference point

This turns traditional Fibonacci analysis into clear, usable trading information.

Solve Everyday Fibonacci Measurement Problems

Many traders know the level they want to use, but still need to calculate the exact distance manually.

Fibonacci Pips MT5 helps solve common issues such as:

  • Knowing the level but not the pip distance
  • Measuring targets manually
  • Pip confusion on Gold and JPY pairs
  • Different price formats across markets
  • Repeated crosshair measurements
  • Cluttered charts with too many objects

The indicator calculates and displays the information neatly on the chart.

See Every Level in Pip Language

For each selected Fibonacci level, the indicator can show:

Fibonacci Level Price Pip Distance
38.2% 1.08528 -57.4 pips
50.0% 1.08351 -75.1 pips
61.8% 1.08175 -92.7 pips
127.2% 1.07195 -190.7 pips

At a glance, traders can see where the level is located and how far price must move to reach it.

Faster Pullback Analysis

In an uptrend, traders often watch the 38.2%, 50.0% and 61.8% retracement zones.

With Fibonacci Pips MT5, these levels are shown together with their measured distance. This helps traders evaluate how deep a pullback may be and compare different retracement zones more clearly.

For example:

  • 38.2% retracement: 57.4 pips
  • 50.0% retracement: 75.1 pips
  • 61.8% retracement: 92.7 pips

Simple Take-Profit Planning

Common Fibonacci extension levels such as 127.2% and 161.8% are often used as potential target areas.

The indicator shows the pip distance to each target directly, helping traders judge whether the projected move is realistic for the selected symbol, timeframe and market condition.

Clearer Stop-Loss Planning

Fibonacci Pips MT5 can also support stop-loss planning.

By comparing an entry area with the displayed Fibonacci price levels and pip distances, traders can estimate risk more efficiently and review whether the planned trade offers a suitable risk-to-reward structure.

Built for Different Markets

Pip and price movement calculations can vary between instruments.

Fibonacci Pips MT5 is designed to support chart analysis on broker-supported markets such as:

  • Forex pairs
  • JPY pairs
  • Gold and metals
  • Indices
  • Crypto CFDs
  • Other MT5 trading symbols

This can reduce manual calculation errors when switching between instruments with different decimal formats.

Clean Chart Presentation

The indicator displays the important information neatly on the right side of the chart:

  • Fibonacci percentage
  • Exact price
  • Pip distance
  • Clear and organized labels
  • Reduced chart clutter
  • Faster manual analysis

Useful For

  • Fibonacci traders
  • Scalpers
  • Intraday traders
  • Swing traders
  • Price-action traders
  • Forex traders
  • Gold traders
  • Index traders
  • Crypto CFD traders
  • Manual traders

Real Trading Example

Suppose XAUUSD is moving strongly upward and Fibonacci is drawn from the swing low to the swing high.

The indicator may display:

Fibonacci Level Price Pip Distance
38.2% 2334.50 -82.0 pips
50.0% 2330.20 -125.0 pips
61.8% 2325.90 -168.0 pips
127.2% 2368.40 +257.0 pips
161.8% 2382.70 +400.0 pips

This gives the trader immediate clarity about pullback depth, target distance and the practicality of the planned risk-to-reward setup.

Important Notice

Fibonacci Pips MT5 is a measurement and trade-planning indicator.

It does not generate BUY or SELL signals and does not predict market direction. It is designed to support manual decision-making by making Fibonacci levels easier to understand and measure.

MT4 Version

Looking for MetaTrader 4? The MetaTrader 4 version of this indicator is available to download from here.

Stay Updated

Join the MQL5 Channel for product updates and discounts:
おすすめのプロダクト
Displays trends in current chart. You can display trends of multiple timeframes in one chart by inserting this indicator as often as you want. Key features: displays trend line by finding highs and lows counts number of high/low of current trend in different color (long/short) allows you to display multiple timeframe trends in one chart Settings: Indicator Name: if you want to show M5 and H1 on one chart add TITrend twice to your current chart and rename M5 to "TITrendM5" and H1 to "TITrendH1" C
確率インジケーター 説明 確率インジケーターは、過去のローソク足の分析に基づいて売買の機会を特定したいトレーダー向けのツールです。設定したローソク足の数を分析し、上昇 ( CALL ) または下降 ( PUT ) の確率を計算し、チャート上に矢印を表示してエントリーポイントを示します。 特徴 ローソク足分析 : 設定可能な数のローソク足を分析し、上昇と下降の確率を計算。 視覚的なシグナル : チャート上に色付きの矢印を表示し、買い (緑) と売り (赤) のシグナルを示す。 音声アラート : 売買シグナルに対して設定可能な音声アラートを発信。 通知機能 : モバイルデバイスやメールに通知を送信し、取引シグナルを知らせる。 確率ボックス : チャート上にリアルタイムの上昇・下降確率を表示。 入力パラメータ num_candles : 分析するローソク足の総数。 call_threshold : CALL シグナル (緑) の最小確率。 put_threshold : PUT シグナル (赤) の最小確率。 sound_alert : 音声アラートの有効化 ( true/false )。
Reversal Magnet Lines plots the closing price of each of the last N trading days (configurable from 15 to 180 days) as horizontal lines directly on the chart. These prior-day close levels frequently act as short-term support and resistance, where price either reverses or breaks through with momentum. Based on an analysis of 52 trading days on JPN225, price interacted with these levels in more than 3,000 recorded touches. On the M1 timeframe, price reversed in 49.8% of touches, broke through in
Ultimate Double Top & Bottom (Pro Volume Matrix) Stop trading retail breakouts. Start trading Institutional Traps. The   Ultimate Double Top & Bottom   is not a standard, lagging pattern scanner. It is a highly advanced, non-repainting structural engine equipped with a proprietary   3-Leg Volume Matrix . Designed exclusively for Smart Money Concepts (SMC) and order flow traders, this indicator mathematically dissects the tick volume inside M and W patterns to reveal true institutional intent:  
Volume Delta indicator that separates buy and sell volume per bar using the proportional method (close position within the bar range). Displays buy volume (white histogram), sell volume (red histogram), and a configurable moving average of total volume. Optional numeric labels show exact values on chart. Works on any symbol and timeframe with tick volume. Inputs: Period for MA, show numbers toggle, font size, number of bars with labels, buy/sell label colors.

The Impulse Heatmap Indicator is an advanced volume and price distribution tool designed to help traders visualize market momentum and locate critical areas of liquidity. By analyzing volume distribution across various price levels over a specified lookback period, this indicator paints a dynamic heatmap directly on your chart, bringing hidden market mechanics into plain sight. This tool is built for traders who want to move beyond standard price action and understand where the bulk of trading
Volume Trade Levels
Mahmoud Sabry Mohamed Youssef
The idea behind this indicator is very simple , First it contains 2 mechanisms to place your trades: 1- Enter the Pips you want to duplicate to price levels. 2- Automatically let the indicator specify the largest Buy / Sell Volume Candle and place duplicated levels based on the candle itself. How it works: 1- Enter the Pips you want to duplicate to price levels:    1- once the indicator is loaded you will need first to Specify the number of pips in the indicator Configuration window ,you can g
Rectangle Trading Custom is a powerful technical analysis tool designed for price action and range-based traders. It allows users to define consolidation zones and receive alerts when the price breaks out of these zones or approaches trendlines drawn on the chart. Rectangles and Trendlines will be extended into future with one click. Rectangle point size, name and prices will be displayed around rectangle. Key Features: Draw Trading Zones (Rectangle Zones) Users can manually draw rectangles to
VWAP バンド ビジュアル スタイル 1.0 金融市場指標は、トレーダーや投資家が金融市場で分析および意思決定を行うために使用する不可欠なツールです。 VWAP とボリンジャー バンドは、トレーダーが市場のトレンドと価格の変動性を測定するために使用する 2 つの人気のあるテクニカル分析ツールです。この製品では、2 つの指標を組み合わせて、市場の動向とボラティリティを包括的に分析する独自の製品を作成することを提案します。この製品は、データ主導の分析に基づいて情報に基づいた意思決定を行いたいトレーダーや投資家にとって理想的です。 発散戦略は、トレーダーが市場の潜在的なトレンド反転を特定するために使用する一般的なテクニカル分析手法です。この戦略は、価格の動きとテクニカル指標の間の相違を特定することに依存しています。このセクションでは、ビジュアル スタイルとボリンジャー バンドを使用した発散戦略について説明します。 たとえば、ビジュアル スタイルとボリンジャー バンドを使用した発散戦略は、トレーダーが市場での潜在的なトレンド反転を特定するために使用する一般的なテクニカル分析手法です。こ
Keltner Channels (ou   Canais de Keltner ) é mais um indicador de   volatilidade   utilizado pela   análise técnica. Também chamado de   envelope , esse canal foi criado por Chester Keltner para monitorar os seus investimentos no mercado futuro de café na década de 1960. Porém, com o passar do tempo, passou também a ser utilizado para outros ativos e, atualmente, é uma das ferramentas mais utilizadas pelos traders. Nesta versão customizada foram adicionados novas opções de método de média movel
Fibonacci Auto Levels Pro MT5 – リトレースメント、エクステンション、ピボットポイント Fibonacci Auto Levels Pro MT5 は、市場のスイングポイントを自動的に検出し、完全なフィボナッチ・リトレースメント、エクステンション、およびピボットポイントの構造をチャート上に描画する高度なテクニカル分析ツールです。 このインジケーターは、いくつかの独立したシステムを統合された単一の分析ツールに組み合わせています。 ピボットポイント (フィボナッチモード) ピボットポイントは、前期間の値幅に基づいて、潜在的なサポートおよびレジスタンスゾーンを特定するために使用されます。 このインジケーターは、前回の高値 (High)、安値 (Low)、終値 (Close) にフィボナッチ比率を適用して計算される フィボナッチ・ピボットポイント を使用します。 ピボットポイントの時間足は、手動で設定することも、以下のロジックを使用して自動で設定することもできます。 日中取引 ≤ 5 分 → 4 時間足 5–45 分 → 日足 45 分–4 時間 → 週足 日足
DRX Market Profile Master v4 — MetaTrader 5向け機関投資家レベルのMarket Profile Market ProfileおよびTime Price Opportunity(TPO)分析は、市場の本質的な構造を理解するための最も効果的な手法の一つです。 DRX Market Profile Master v4は、この手法をMetaTrader 5に完全に実装し、プロフェッショナルな取引プラットフォームに匹敵する機能を提供します。 このインジケーターは各セッションごとに、価格が受け入れられたゾーン(Value Area)、最も取引が集中した価格(Point of Control)、そして市場が迅速かつ一方向に通過したゾーン(Single Prints)を自動的に計算します。 これらの情報は、精度の高いエントリーおよびエグジット判断の基盤となります。   How does that work? セッションタイプと履歴表示 このインジケーターは、時間別、日次、週次、月次、およびカスタムの5種類のセッションタイプをサポートしています。最大20の履歴セ
一目で分析を強化! このインジケーターは、価格が最近反発または突破した重要なレベルを自動的に描画し、手動でラインを引くことなくサポートとレジスタンスのゾーンを表示します。チャートに適用するだけで、各期間の過去の高値・安値ラインが表示されます。 各ラインの意味 Previous Month High ‣ 前月高値:前の月の期間内で記録された最高価格。 Previous Month Low ‣ 前月安値:前の月の期間内で記録された最安価格。 Previous Week High ‣ 前週高値:前の週の期間内で記録された最高価格。 Previous Week Low ‣ 前週安値:前の週の期間内で記録された最安価格。 Previous Day High ‣ 前日高値:直前の取引日の最高価格。 Previous Day Low ‣ 前日安値:直前の取引日の最安価格。 なぜ使うのか? グラフを開いた瞬間に 反発 と 突破 を検出。 実績あるゾーンで 利確 と 損切り を設定。 SMC や ICT 戦略に必須、市場構造をベースにエントリーと決済を最適化。 スキャルピング 、 スイング
HarmonicVision Pro MetaTrader 5用 高度なハーモニックパターン投影エンジン 複数の時間足でハーモニックパターンを手動で識別することは、非常に時間がかかり、エラーが発生しやすい作業です。比率の計算を一つ間違えるだけで、トレードセットアップ全体が無効になり、チャンスを逃したり、誤ったエントリーにつながります。 HarmonicVision Proは、Gartley、Bat、Butterfly、Crab、Deep Crab、Shark、Cypher、Nen Star、5-0、AB=CD、3 Drivesなど15種類以上のハーモニックパターンをリアルタイムで自動検出、検証、投影します。マルチウェーブエンジンが異なるピボット長で最大6つのスキャナーを同時に実行し、スキャルピングからポジショントレードまで、1つのチャートで全てのスタイルをカバーします。 経験豊富なハーモニックトレーダーであっても、フィボナッチベースのパターントレードを始めたばかりであっても、HarmonicVision Proはカスタマイズ可能な投影と組み込みのトレード管理レベルによる、即座かつ正確な
Livro Visual
Eduardo Da Costa Custodio Santos
O LIVRO VISUAL é uma ferramenta que auxilia na identificação de escoras e renovação de ordens, para quem opera Tape Reading ou fluxo no gráfico é uma excelente ferramenta. Porem ele funciona somente em Mercados Centralizados ou com profundidade nível 2. É de fundamental importância você saber que ele não funciona em Mercado de FOREX. Porem pode ser utilizado no Mercado da B3.
Boom 600 Precision Spike Detector The Boom 600 Precision Spike Detector is your ultimate tool for trading the Boom 600 market with precision and confidence. Equipped with advanced features, this indicator helps you identify potential buy opportunities and reversals, making it an essential tool for traders aiming to capture spikes with minimal effort. Key Features: Non-Repainting Signals: Accurate, non-repainting signals that you can trust for reliable trading decisions. Audible Alerts: Stay on t
WT Vwap 5 Bands The WT Vwap Bands indicator is an indicator that combines price and volume, helping to show whether the price is within the "fair price", overbought or oversold. The indicator code was designed for performance and has already been tested in a real trading account. In addition to the visual inputs (color, thickness and line style), the user can define a% value that depends on the price. The default values work with the most distant band at 1% of the price and then dividing
The CV Fibonacci Indicator is a professional trading tool designed to automatically display important Fibonacci zones and potential market reaction areas. It helps traders identify support, resistance, retracement and extension levels with precision and clarity. Features: Automatic Fibonacci levels Accurate retracement & extension zones Clean and modern chart visualization Suitable for Forex, Gold, Indices, Crypto and Stocks Supports scalping, intraday and swing trading Disclaimer: This product
ULTRA Indicator V1 MT5 | Smart Money Concepts (SMC) + Order Block Supply & Demand Trading System Overview ULTRA Indicator V1 is a professional MetaTrader 5 (MT5) Smart Money Concepts (SMC) trading system designed to identify institutional-level market structure, liquidity zones, and high-probability reversal areas using Order Blocks and Supply & Demand analysis . This indicator integrates two powerful MQL5 Market tools: SMC Structure Markup Supply and Demand Order Blocks MT5 (OB) By combining s
Market Noise マーケットノイズは、価格チャート上の市場の局面を決定する指標であり、また、蓄積または分配局面が発生したときに、明確で滑らかなトレンドの動きとノイズの多い平坦な動きを区別します。 各フェーズは、独自のタイプの取引に適しています。トレンド追跡システムにはトレンド、積極的なシステムにはフラットです。 市場のノイズが始まったら、取引を終了することを決定できます。 同様に、またその逆も同様で、騒音が止んだらすぐに、積極的な取引システムをオフにする必要があります。 一方からもう一方に切り替えて、両方のタイプの取引戦略を取引することができます。 したがって、この指標は取引決定の分野で優れたアシスタントの役割を果たします。 すべての価格変動は、選択した期間の一般的な価格変動と、この期間内の価格変動の形でのノイズという 2 つの要素に分けることができます。 同時に、異なる期間の異なる市場では、ノイズ成分とトレンド成分の間の幅広い相互関係を示すことができます (図 1)。 価格変動のノイズレベルが高くなるほど、基礎的なトレンドの方向性と強さを識別することが難しくなります。 した
Product Name: Harmonic Confluence Pro Indicator Harmonic Confluence Pro is a scanner and signal indicator. It is designed to assist manual traders by detecting harmonic structures and applying price action and zone filters. The indicator calculates entry, stop loss, and take profit levels based on market structure, displaying them on the chart with arrows and labels. The indicator scans for over forty types of harmonic patterns. It includes classic structures like Gartley, Bat, Butterfly, Crab,
Here is a professional and compelling product description you can use directly for the MQL5 Market. It highlights the advanced mathematical logic under the hood while keeping it accessible for everyday traders. Znalgo Ai Trend: Advanced Dynamic Trend Tracker Znalgo Ai Trend is a professional-grade trend-following indicator engineered to track market momentum using a highly responsive, recursive ATR-stepping algorithm. Originally adapted from advanced quantitative TradingView models, this indica
This product is designed for the MT5 platform and offers two key features: VWAP (Volume Weighted Average Price) calculation and Volume Profile analysis. Advantages: VWAP Calculation: The product calculates the VWAP, which is a popular indicator used by traders to determine the average price of a security based on its trading volume. It helps identify potential buying or selling opportunities by comparing the current price to the average price weighted by volume. Volume Profile Analysis: The prod
An anchored Vwap With Arrows is an indicator that includes a moving average weighted by volume that allows you to plot on a bottom or a top. Usually banks and institutions measure an average price, this average price is a price range where they agree to make a trade. Using the logic of anchored vwap with arrows it is possible to understand that if the price breaks the vwap it means that someone with enough buying and selling power has lost control. You can use vwap anchored with arrows in any ti
Professional VWAP Trading System with Advanced Signal Detection Transform your trading with the most comprehensive VWAP indicator available for MetaTrader 5. Magic VWAP Key Levels Pro combines multiple timeframe analysis, intelligent signal detection, and professional-grade visualization to give you the edge in modern markets. CORE FEATURES: Multi-Timeframe VWAP Analysis Session, Weekly, and Monthly VWAP calculations Previous 10-day VWAP support/resistance Dynamic anchor periods (Session/Week/Mo
需給ボリュームゾーン — 機関投資家のサポート/レジスタンスレベルと買い/売り圧力 Supply Demand Volume は、価格構造、出来高分析、およびリアルタイムのボラティリティに基づいて、主要な需給ゾーンを自動的に検出するための高精度インジケーターです。正確なサポート/レジスタンス、オーダーフロー、Wyckoff理論、スマートマネーコンセプトに依存するトレーダーに最適です。 主な機能:   ゾーンの自動検出 – 過去の高値/安値とATRを利用し、機関投資家のボリュームが集中する重要なゾーンを識別します。 買い/売りボリューム分析 – リアルタイムで買いと売りの力関係を表示し、トレード方向を確認します。   ミッドラインと価格ラベル – カスタマイズ可能なカラーとラベルで中間ゾーンを明確化。   時間ベースのゾーン拡張 – ゾーンが将来まで自動的に延長され、再描画なしで有効性を維持します。 おすすめ対象: 反転トレーダー ブレイクアウトトレーダー 出来高/価格アクショントレーダー スキャルピング・デイトレーダー 買いの出来高が売りを上回る場合、価格は供給ゾーンを上抜
VibeFox Auto Fibonacci — OTEゾーンとタッチシグナルを備えた自動スイングリトレースメントグリッド VibeFox Auto Fibonacci は、フィボナッチ・リトレースメントのグリッドを自動で描画する MetaTrader 5 向けのリアルタイム・オーバーレイです。直近の重要な価格スイングを自動的に検出し、0% と 100% の水準をそのスイングに固定して、リトレースメント水準の全セット、最適トレード・エントリー(OTE)ゾーン、そして必要に応じて拡張ターゲットを、価格チャート上に直接描き出します。値動きのたびにフィボナッチ・ツールを手でドラッグする代わりに、常に最新のグリッドが表示され、価格が重要な水準へ戻った瞬間にアラートを受け取れます。すべての操作は、一つのモダンなインタラクティブパネルにまとめられています。 インジケーターの仕組み 本インジケーターは2つの段階で動作します。まず、フラクタルのピボットで駆動される ZigZag エンジンによってスイング構造を構築します。あるバーが両側の Depth 本ぶんのウィンドウにおける厳密な最大値であればピボッ
UR ボリュームトレンド   UR VolumeTrend は、出来高の継続的な傾向を示す最も明確な出来高インジケーターです。 UR TrendExhaustion などの他のインジケーターと完全に連携して、ローカルのトップとボトムを示します。 パラメータは 2 つだけに制限されています。値が高いほど、トレンドが長く表示されます。 極端な勾配は、潜在的な反転を捉えるためにボリュームが枯渇する可能性を示しています。 2 本の線 - 出来高の傾向と平均です。 最大の利点: 簡単で、すべてのアセットに合わせて調整できます。 ツールの最新情報を入手できる特別な電報チャットがあり、何か不足していると感じた場合はリクエストを送信することもできます! UR VolumeTrend を選ぶ理由 トレンドを捉えるには出来高が鍵となることは誰もが認めるところです。 このオシレーターは、1 つの使いやすいインジケーターに圧縮されたすべてのボリューム ツールの合計です。 見やすい方法で正/負のボリュームを示します。 背後にあるインターフェイスは、ボリュームが過去に比べて使い果たされている可能性があ
WT Vwap Bands
Ricardo Almeida Branco
The WT Vwap Bands indicator is an indicator that combines price and volume, helping to show whether the price is within the "fair price", overbought or oversold. The indicator code was designed for performance and has already been tested in a real trading account. In addition to the visual inputs (color, thickness and line style), the user can define a% value that depends on the price. The default values work with the most distant band at 1% of the price and then dividing this distance in
Market Fractal Analysis, Fractal Swing, Market Flow Fractal Cycles looks for Similar Patterns in the Market that repeat themselves because of the Market Fractal Nature. These patterns are displayed with help of Graphical Objects and Alerts can be received on their arrival. Read the   Blog   for full information. Features:- Auto Detection of Patterns Customization for Color and Line Styles Alerts, Emails & Push Notifications
このプロダクトを購入した人は以下も購入しています
この製品は 2026 年の市場向けに更新され、最新の MT5 ビルドに最適化されています。 価格更新のお知らせ: Smart Trend Trading System は現在 $99 で提供されています。 次の 30 件の購入 後、価格は $199 に上がります。 特別オファー: Smart Trend Trading System を購入後、私にプライベートメッセージを送ることで、 Smart Universal EA を無料 で受け取り、Smart Trend のシグナルを自動売買に変えることができます。 Smart Trend Trading System は、リペイントなし、再描画なし、遅延なしの完全なトレーディングシステムです。よりクリーンなシグナル、より明確なトレンド方向、そしてより整理された取引方法を求めるトレーダー向けに作られています。   [User Manual]   ,  [PDF]  ,   [Installation manual]   and  [Online course] このシステムは、トレンド検出、反転ゾーン、Smart Cloud、トレーリングス
Trend Sniper X
Sarvarbek Abduvoxobov
5 (10)
Trend Sniper X は、MetaTrader 5 用のマルチタイムフレーム・トレンドフォロー・インジケーターです。トレーダーがトレンドの方向性と反転ポイントを明確かつ正確に特定できるよう支援します。 価格情報: 現在の価格はキャンペーン価格であり、今後のアップデートや新機能のリリースに伴い変更される可能性があります。 Code2Profit チャンネル マルチタイムフレーム分析で市場をマスターしよう! 技術仕様 プラットフォーム MetaTrader 5 インジケータータイプ マルチタイムフレーム・トレンドインジケーター 操作タイムフレーム あらゆるチャートタイムフレームに対応。個別に選択可能な上位タイムフレーム (M1–MN1) を搭載 主要銘柄 FX、ゴールド (XAUUSD)、およびその他のCFD 推奨口座 あらゆる口座タイプに対応 視覚化 色分けされたトレンドローソク足 (買い/売り/弱気/変化) + 買い/売り矢印 追加モジュール セッション市場ボックス (シドニー、東京、ロンドン、ニューヨーク) 主な機能 マルチタイムフレーム・トレンド分析: 上位タイムフレームの
Welcome to ENTRY IN THE ZONE AND SMC MULTI TIMEFRAME Entry In The Zone and SMC Multi Timeframe is a real-time market analysis tool based on Smart Money Concepts (SMC), designed to analyze market structure, price direction, and key trading zones. It supports both Single-Timeframe Analysis and Multi-Timeframe Analysis, providing a clearer view of the overall market structure across multiple timeframes, with real-time BUY / SELL signals that do not repaint. It is designed to help filter trading opp
時折、私自身もこのシステムを使って取引を行っています。 実口座での私の手動による「BOMBER」トレードをぜひご評価ください - LIVE SIGNAL このインジケーターを購入された方には、以下の特典を 無料 で提供しています: 各トレードを自動で管理し、ストップロスとテイクプロフィットを設定し、戦略ルールに基づいてポジションを決済する補助ツール 「Bomber Utility」 様々な銘柄に合わせたインジケーターの設定ファイル(セットファイル) 「最小リスク」、「バランスリスク」、「待機戦略」 の3つのモードで使用できる Bomber Utility 用の設定ファイル このトレーディング戦略をすぐに導入・設定・開始できる ステップバイステップのビデオマニュアル ご注意: 上記の特典を受け取るには、MQL5のプライベートメッセージシステムを通じて販売者にご連絡ください。 オリジナルのカスタムインジケーター 「Divergence Bomber(ダイバージェンス・ボンバー)」 をご紹介します。これは、MACDのダイバージェンス(乖離)戦略に基づいた 「オールインワン」型のトレーディン
Neuro Poseidon is a new indicator by Daria Rezueva. It combines precise trading signals with adaptive TP/SL levels - creating best possible trades as a result! Message me and get  Neuro Poseidon Assistant  as a gift to automize your trading process! What makes it stand out? 1. Proven profitability on all assets and timeframes 2. Only confirmed BUY and SELL signals present on the chart 3. Adaptive TP & SL levels generated by the software for each trade 4. Easy to understand - suitable for al
SuperScalp Pro
Van Minh Nguyen
4.61 (31)
SuperScalp Pro – プロフェッショナル多層コンフルエンス・スキャルピングシステム SuperScalp Pro は、複数のコンフルエンスを組み合わせたプロフェッショナル向けスキャルピングシステムです。より高い確率のトレードチャンスを見つけられるよう設計されており、明確なエントリー確認、ATRに基づくStop LossとTake Profit、さらにXAUUSD、BTCUSD、主要なFX通貨ペアに対応した柔軟なシグナルフィルター機能を提供します。 完全なドキュメントは製品ブログにあります: [User Guide] SuperScalp Pro Auto Trader EA による自動売買が利用可能です: [Auto Trader] SuperScalp Pro のトレードロジックを基に開発されたゴールド自動スキャルピングEA: [SuperScalp Gold] SuperScalp Pro は、Supertrend、VWAP、EMA、RSI、ADX、出来高分析、ボリンジャーバンド、MACDダイバージェンスを組み合わせ、低品質なトレードセットアップをフィルタリングし
伝説が帰ってきました:Entry Points Pro 10。 MQL5 Marketのトップ3に3年間入り続けた伝説的インジケーターの再始動です。 2つのバージョンで合計589件の高評価レビュー、毎日数千人のトレーダーが実際のトレードに使用し、デモのダウンロードは31,000件以上   MT4+MT5 。 私はこの5年間に寄せられたレビューをすべて読み、約束を並べる代わりに、その答えをバージョン10に組み込みました。1999年から相場に携わり、 誠実さ、自らの評判、そして顧客を大切にする 作者による製品です。 Entry Points Proのエントリーシグナルは、リペイント(再描画)を一切行いません。 そして今回初めて、これは作者の言葉ではなく検証可能な事実になりました。確定シグナルはローソク足の終値確定後にのみ表示され、自動テストで リペイントはゼロ と確認されています(EURUSD、XAUUSD、BTCUSDで2,486,568回の不変条件チェック、違反0件)。検証方法は公開されており、ストラテジーテスターでご自身で再現できます。 ご購入後は、必ずすぐにダイレクトメッセージでご
まず正直に言いましょう。 どんなインジケーターも、それ単体であなたを利益化させることはできません。もしそう言う人がいるなら、それは夢を売っているだけです。完璧な売買シグナル(矢印)を表示するインジケーターは、いくらでも“完璧に見せる”ことができます。正しい過去の区間を拡大して、勝ちトレードだけを切り取ればいいだけです。私たちはそれをしません。 SMC Intraday Formula はツールです。 市場構造を読み取り、最も高い確率の価格ゾーンを特定し、今この瞬間のスマートマネーの痕跡をシンプルな言葉で正確に示します。最終判断はあなたが行います。トレードを実行するのもあなたです。しかし今は「希望」ではなく「精度」でエントリーできます。 私たちはこのインジケーターを、ゴールド(XAUUSD)および主要FX通貨ペアで約3年間、日々のスキャルピングに使用してきました。M1、M5、M15、M30の主要ツールです。これは未来を予測しようとするのではなく、今まさに形成されている高確率セットアップを示し、その理由を説明します。 他のすべてのインジケーターと何が違うのか? ほとんどのトレーディングイ
GoldenX Entryは、MT5向けのインジケーターであり、適応型Smart Entry Trendアルゴリズム、シグナルスコアリングシステム、マーケットレジーム検出機能、およびボラティリティフィルターを備えています。各シグナルには、計算されたエントリーレベル、3つのテイクプロフィット(TP1、TP2、TP3)、およびストップロスレベルが含まれます。本インジケーターは、異なる市場環境に適応するために設計された複数の分析レイヤー上に構築されており、マルチレイヤー分析システムと内蔵オプティマイザーおよび統計トラッキングシステムを組み合わせています。リスク・リワード(RR)指標および過去のトレード履歴に基づく定量分析を提供します。 使い始めは簡単です — 選択した時間足でオプティマイザーを実行し、そのままチャート上でインジケーターを使用します。 コア機能 GoldenX Entryは、シグナルエンジンとトレード管理機能、そして過去統計トラッキングを1つのチャートに統合しています: - 内蔵オプティマイザー: オプティマイザーはチャート上でワンクリックで実行できます。200通りのパラメー
SUPERHEROインジケーターは、「オールインワン」方式に基づいて設計された多通貨対応の取引システムです。このインジケーターは市場を独自に分析し、取引の開始および終了のタイミングに関するシグナルを提供します。ストップロス注文とテイクプロフィット注文を使用します。R:R比率は1:1です。 私は時折、このシステムのシグナルに基づいて自ら取引を行いますが、その結果は以下の通りです— ライブシグナル このシステムはスマートフォンにプッシュ通知を送信できるため、PCに縛られることなく「外出先」からでも取引を行うことができます。自己勘定取引を行う企業に最適です。 すべてのお客様への特典: このインジケーターをご購入いただいたすべてのお客様に、私から特別なユーティリティをプレゼントいたします。その内容は以下の通りです: 自動的にストップロス注文とテイクプロフィット注文を発注します 価格が目標水準に達すると、自動的に取引を決済します 指値注文による取引に対応しています 平均化取引モードに対応しています この優れた、しかも非常に便利なユーティリティをプレゼントとして受け取りたい場合は、SUPERHER
UZFX {SSS} スキャルピング・スマートシグナル v4.0 MT5は、変動の激しい市場において正確かつリアルタイムのシグナルを求めるスキャルパー、デイトレーダー、スイングトレーダー向けに設計された、リペイントのない高性能な取引インジケーターです。(UZFX-LABS)によって開発されたこのインジケーターは、価格行動分析、トレンド確認、スマートフィルタリングを組み合わせることで、すべての通貨ペアおよび時間軸において、高確率の売買シグナル、警告シグナル、トレンド継続の機会を生成します。 トレードの判断に迷うのはもうやめましょう。明確さ、正確さ、そして規律ある市場執行を求めるトレーダーのために設計された、体系的なシグナルシステムに従い始めましょう。 私のおすすめ* 最適な時間足:15分足以上。 {H1} が私のお気に入りです。そして、その成果は驚異的です…!! 主な機能の更新 • 自動売買シグナル検出 • 高度な反転認識ロジック • 市場反転の可能性に先立つ早期警告シグナル • トレンド継続確認シグナル • エントリー、ストップロス、TP1、TP2、TP3レベルを備えた組み込み型
M1 SNIPER は使いやすいトレーディングインジケーターシステムです。M1時間足向けに設計された矢印インジケーターです。M1時間足でのスキャルピングのためのスタンドアロンシステムとして、また既存のトレーディングシステムの一部としても使用できます。このトレーディングシステムはM1時間足での取引に特化して設計されていますが、他の時間足でも使用できます。元々、この手法はXAUUSDとBTCUSDの取引用に設計しましたが、他の市場においても役立つと考えています。 インジケーターのシグナルは、トレンドの方向と逆方向に取引できます。インジケーターのシグナルを利用して両方向に取引するのに役立つ特別な取引テクニックをご紹介します。この手法は、特別な動的なサポートとレジスタンスの価格帯を利用することに基づいています。 ご購入後、M1 SNIPER矢印インジケーターをすぐにダウンロードできます。さらに、M1 SNIPERツールのすべてのユーザーに、以下のスクリーンショットに表示されているApollo Dynamic SRインジケーターを無料で提供しています。この2つのインジケーターを組み合わせることで
この製品は 2026 年の市場向けに更新され、最新の MT5 ビルドに最適化されています。 価格更新のお知らせ: Atomic Analyst は現在 $99 で提供されています。 次の 30 件の購入 後、価格は $199 に上がります。 特別オファー: Atomic Analyst を購入後、私にプライベートメッセージを送ることで、 Smart Universal EA を無料 で受け取り、Atomic Analyst のシグナルを自動売買に変えることができます。 Atomic Analyst は、リペイントなし、再描画なし、遅延なしの Price Action トレーディングインジケーターで、手動取引、シグナルの明確化、EA 自動化のために設計されています。 User manual: settings, inputs and strategy.   &   User Manual PDF . 価格行動、強さ、モメンタム、マルチタイムフレーム方向、高度なフィルターを分析し、トレーダーがノイズを減らし、弱いセットアップを避け、より構造化された取引判断を行えるようにします。 このイ
Zoryk Gold
Reda El Koutbane
5 (6)
割引は 24 時間後に終了します — 次の価格は$ 69 ZORYK — MetaTrader 5専用 XAUUSDシグナル・トレードプランニングシステム このような経験はありませんか。 ゴールドを分析し、エントリーを待ち、ようやくポジションを持った直後に価格が逆方向へ動く。 早すぎる決済をしてしまったり、Stop Lossを動かしたり、数秒迷っている間にチャンスを逃したりする。 その後、相場は自分が最初に予想していた方向へ進み、目標へ到達する。 問題は常に方向判断ではありません。 本当の問題は、明確な計画がなかったことです。 どこでエントリーすべきか。 どこでトレードの前提が無効になるのか。 近い利益を確保すべきか、より大きな値動きを待つべきか。 現在のsetupが本当に強いのか、それとも無理にトレードを探しているだけなのか。 ゴールドは非常に速く動きます。 正しい分析でも、明確なプランがなければ数秒で悪い判断に変わることがあります。 ZORYKは、その問題を解決するために開発されました。 ZORYKとは ZORYKは、MetaTrader 5とXAU
Gann Made Easy   は、ミスター・ギャンの理論を使用した取引の最良の原則に基づいた、プロフェッショナルで使いやすい外国為替取引システムです。 W・D・ガン。このインジケーターは、ストップロスとテイクプロフィットレベルを含む正確な買いと売りのシグナルを提供します。 PUSH通知を利用して外出先でも取引可能です。 ご購入後、取引方法の説明と優れた追加インジケーターを無料で入手するには、私にご連絡ください! おそらく、ギャンの取引手法についてはすでに何度も聞いたことがあるでしょう。通常、ギャンの理論は初心者のトレーダーだけでなく、すでにある程度の取引経験がある人にとっても非常に複雑なものです。なぜなら、ギャンの取引手法は理論的にはそれほど簡単に適用できるものではないからです。私はその知識を磨き、最良の原則を私の外国為替インジケーターに組み込むために数年を費やしました。 このインジケーターは非常に簡単に適用できます。必要なのは、それをチャートに添付し、簡単な取引推奨事項に従うだけです。このインジケーターは常に市場分析の仕事を行い、取引の機会を探します。適切なエントリーポイントを検
SR Liquidity は、市場の流動性が集中し、価格が最も強く反応する「隠れたゾーン」を可視化するために設計されたトレーディング指標です。こうした流動性の高いエリアは強力なサポート(支持)およびレジスタンス(抵抗)レベルとして機能し、市場が反転する可能性が最も高いポイントを明確に示してくれます。 単なる一般的なサポートラインやレジスタンスラインを描画するのではなく、「SR Liquidity」は実際の価格変動を分析し、売りと買いの圧力が集中するゾーンを特定します。これらは、市場の真の動きを牽引する「流動性のプール(溜まり場)」そのものです。それらをチャート上に直接可視化することで、価格が実際に反応する前に、その動きを予測することが可能になります。つまり、このインジケーターは価格の方向性が変わる可能性を予測するのです。生のプライスアクションを、市場の重要な水準(転換点となり得るポイント)を示す、明確で実用的なロードマップへと変換してくれます。 このインジケーターは、FX、株価指数、貴金属、仮想通貨など、あらゆる銘柄や時間足で使用可能です。 ご購入後、取引手順や無料の優れた追加インジケ
トレンドキャッチャーインジケーター トレンドキャッチャーインジケーターは、開発者独自の適応型トレンド分析指標を組み合わせることで、市場価格の動きを分析します。短期的なノイズを除去し、根底にあるモメンタムの強さ、ボラティリティの拡大、価格構造の挙動に焦点を当てることで、真の市場方向性を特定します。また、移動平均線、RSI、ボラティリティフィルターなどの平滑化およびトレンドフィルタリング機能を備えたカスタマイズ指標も使用します。 実際の運用状況のモニタリングやその他の製品については、こちらをご覧ください: https://www.mql5.com/en/users/mechanic/seller ご注意ください。私はTelegramでEAや設定を販売していません。詐欺です。すべての設定はブログで無料で公開しています。 重要!ご購入後すぐにご連絡ください。手順とボーナスをお送りします!
Crystal Heikin Ashi Signals - Professional Trend & Signal Detection Indicator Advanced Heikin Ashi Visualization with Intelligent Signal System for Manual & Automated Trading Final Price: $149 ---------> Price goes up $10 after every 10 sales . Limited slots available — act fast . Overview Crystal Heikin Ashi Signals is a professional-grade MetaTrader 5 indicator that combines pure Heikin Ashi candle visualization with an advanced momentum-shift detection system. Designed for both manual traders
Power Candles V3 - 自己最適化型強弱インジケーター Power Candles V3は 、通貨や銘柄の強さを、適用されたすべてのチャート上で実行可能なトレードプランに変換します。単にローソク足を色分けするだけでなく、バックグラウンドでリアルタイムの自動最適化を実行し、目の前の銘柄に対して最適なストップロス、テイクプロフィット、およびシグナルの閾値を提示します。ワンクリックで実取引に適用でき、エントリーポイント、ストップロス、テイクプロフィットのラインが正確な価格位置にチャート上に表示され、方向性を示すアラートがリアルタイムで発動します。 このツールは、Stein Investmentsのエコシステムの一部です。  18種類以上のツールをすべて閲覧し、AIを活用したセットアップの推奨事項を入手し、  https://stein.investments でコミュニティに参加しましょう クローズしたバーごとに3,000回以上のトレードシミュレーション。9つの強さの状態。2つの戦略を並行してテスト。勝率の高い設定をワンクリックで適用。 なぜこれが必要なのか ほとんどの強
M1 Quantum MT5
Hamed Dehgani
4.27 (11)
M1 Quantum を使用したライブトレードシグナル : シグナル (取引は 自動的に Quantum Trade Assistant によって実行され、この製品に 無料 で含まれています。) 最新ニュース: バージョン1.64がリリースされました。現在、すべての取引で、関連するサポート/レジスタンスゾーンの後ろにStop Lossが設定されます。今回のバージョンでは、EAのパフォーマンスを向上させるためにSmart Close機能も改善されました。 8月9日から、ライブシグナルはバージョン1.64で稼働しています。 価格プラン: 現在価格: $169 (早期購入者向けオファー) 次回予定価格: $189 予定小売価格: $299 開発者からのお知らせ: ご購入後、 最新の推奨設定ファイル(Set File) 、運用アドバイス、および他の M1 Quantum ユーザーと交流できる VIPサポートグループ への招待をご希望の場合は、お気軽にご連絡ください。 よくある質問 - 設定ファイル - インストールガイド M1 Quantum は、M1専用のプロフェッショナルトレーディング
この製品は 2026 年の市場向けに更新され、最新の MT5 ビルドに最適化されています。 価格更新のお知らせ: Smart Price Action Concepts は現在 $200 で提供されています。 次の 30 件の購入 後、価格は $299 に上がります。 特別オファー: 購入後、私にプライベートメッセージを送ることで、 無料ボーナス + ギフト を受け取ることができます。 まず、このトレーディングツールはリペイントなし、再描画なし、遅延なしのインジケーターであり、プロフェッショナルな取引に最適であることを強調しておきます。 [Online course] ,   [User Manual]  ,  [How to Install]  ,   [PDF] Smart Price Action Concepts Indicator は、初心者から経験豊富なトレーダーまで使える非常に強力なツールです。20 種類以上の便利なインジケーターを 1 つにまとめ、Inner Circle Trader Analysis や Smart Money Concepts Trading S
AXIOM MATRIX MT5 ローンチ価格:$99 Axiom Matrix はローンチ価格 $99 でご利用いただけます。 最初の30件の購入後、価格は $199 に上がります。 ご購入後、手順のご案内と限定ギフトボーナスの受け取りのために、直接DMをお送りください。 Axiom Matrix は、MetaTrader 5 用のプロフェッショナルなマルチシンボル・マルチタイムフレーム市場スキャナー兼意思決定ダッシュボードです。 Market Watch をスキャンし、複数の時間足を分析し、複数のエビデンスエンジンを読み取り、最も強いチャンスを比較し、1つのクリーンなマトリックスダッシュボード内で最適な BUY、SELL、WAIT、またはブロック状態を表示します。 私が Axiom Matrix を作った理由は、市場スキャンという重い作業を代わりに行ってくれる1つのツールが欲しかったからです。 RSI だけを確認したくありませんでした。 次に MACD だけ。 次に移動平均線。 次に出来高。 次にボラティリティ。 次にサポートとレジスタンス。 そして、1つのトレードアイデアを作るた
Smc Pro ToolKit
Talal N Z Aljarusha
5 (8)
SMC PRO TOOLKIT — SMART MONEY ANALYSIS & STRUCTURED TRADE PLANNING SMC Pro ToolKit is a professional Smart Money Concepts analysis workspace for MetaTrader 5. It combines market structure, multi-timeframe analysis, institutional price zones, setup evaluation, confirmation tools, volume context, alerts, and risk planning inside one organized chart environment. One workspace. Multiple layers of confirmation. One structured trading plan. OPEN COMPLETE USER GUIDE MULTI-CONDITION SETUP ENGINE At
FX Trend NG:次世代マルチマーケット・トレンドインテリジェンス 概要 FX Trend NG は、複数の時間足に対応したプロフェッショナル向けトレンド分析およびマーケット監視ツールです。 市場全体の構造を数秒で把握することができます。 複数のチャートを切り替える必要はありません。どの銘柄がトレンド中なのか、どこでモメンタムが弱まっているのか、そしてどの時間足で強い整合性があるのかを瞬時に確認できます。 ローンチ特別オファー – FX Trend NG を $30(6ヶ月) または $80 永久ライセンス でご利用いただけます。 すでに Stein Investments のユーザーですか? -> メッセージを送信 して、プライベートグループへアクセスしてください。 セットアップや詳細情報が必要ですか? -> Stein Investments 公式ページ をご覧ください。 1. FX Trend NG が他と異なる理由 3ステート・トレンドロジック ― Buy と Sell だけではない • 多くのインジケーターは Buy または Sell の2状態のみを表示します。
BTMM State Engine Pro by G-Labs — Beat The Market Maker indicator for MetaTrader 5. Asian session range, London and New York kill zones, level progression (L1/L2/L3), peak formation detection (PFH/PFL), entry signals, and a multi-pair scanner from one chart. Stop scanning charts one pair at a time. The State Engine tracks the BTMM daily cycle automatically — Asian box, room boundaries, level blocks, peak formations, and filtered entries — while the scanner dashboard shows level, peak status, d
Reversion King Indicator
Eugen-alexandru Zibileanu
5 (6)
新たな王者が登場 - インジケーター + 注文管理表示(TP1 + TP2 + TP3)+ オプションのTelegramシグナル送信機能付き(無料) (完全なトレード&シグナルシステム) ゴールド向け最高のEA: Gold Slayer このインジケーターには、高度な戦略、カスタマイズ可能な注文管理システム、そしてエンベロープ拡張を組み合わせた平均回帰システムが搭載されています。さらに、RSIなど複数のインテリジェントな確認フィルターによって、高確率の反転エントリーをBUY・SELLシグナルとして検出します。 単にトレードを学ぶだけでなく、複数ポジションを効果的に管理し、過去に利益を出しているオープンポジションで損失トレードをカバーする方法も学べます。 M5向けに構築・最適化されており、流動性が高くシグナルの精度が安定しているBTCUSDとXAUUSDで優れたパフォーマンスを発揮します。 このインジケーターは、ATRを基に自動計算されたエントリー、ストップロス、テイクプロフィットレベルを備えた明確なLong・Shortシグナルを提供するため、リスク管理が最初から組み込まれています。 マ
Market Structure Order Block Dashboard MT5 は、市場構造と主要な価格反応ゾーンをチャート上で直接読み取りたいトレーダー向けに設計された MT5 インジケーターです。BOS、ChoCH、オーダーブロック、Fair Value Gap (FVG)、流動性、Kill Zones、Volume Profile、そして素早い分析のためのコンパクトなダッシュボードを組み合わせています。 本インジケーターは、市場構造、ICT、Smart Money の概念を意思決定の枠組みとして使用するトレーダーを対象としています。トレンド継続、反転の可能性、価格の不均衡、流動性ターゲット、注目ゾーンをより構造的に特定する助けとなります。 購入者向けの付属リソース 購入後、MQL5 のプライベートメッセージにてご依頼いただくと、完全な PDF ユーザーガイドとパラメータ設定のヒントを提供いたします。MQL5 のプライベートメッセージによる直接的な技術サポート。 バージョン 1.20 では 2 つの重要な追加機能があります: Pending BOS / Pending Cho
The Oracle Pro
Ottaviano De Cicco
5 (1)
The Oracle Pro:MT5向け合成マルチタイムフレーム・バイアスエンジン ️ サマー・ローンチ・オファー — The Oracle Pro を 199 USD で(早期購入者向け)。価格は普及に応じて上昇します。最終価格 399 USD。 The Oracle Pro は、要求の高いプロのトレーダーのために作られた MetaTrader 5 向けのプレミアム・マルチタイムフレーム バイアスエンジン です。ひとつの問いに規律をもって答えます。すなわち、各タイムフレームの現在の方向バイアスは何か、その強さはどれほどか、そしてタイムフレーム同士はどれだけ一致しているか。すべては確定足のみで計算され、リペイントはありません。 The Oracle Pro はマルチファクター・コンセンサス・システムです。独自のインジケーターと最適化されたアルゴリズムを単一の高度なコンセンサス・ベクトルに統合し、それを単一のインジケーター・インスタンス内で現在足と上位足のスタックにわたって読み取ります。複数のチャートにばらばらのツールを積み重ねる代わりに、です。 これは Oracle コンセンサス手法
FX Power: 通貨の強弱を分析して、より賢い取引を実現 概要 FX Power は主要通貨と金の実際の強弱をあらゆる市場状況で理解するための必須ツールです。強い通貨を買い、弱い通貨を売ることで、 FX Power は取引の意思決定を簡素化し、高い確率の取引機会を見出します。トレンドを追従する場合でも、極端なデルタ値を使用して反転を予測する場合でも、このツールはあなたの取引スタイルに完全に適応します。ただ取引するだけではなく、 FX Power で賢く取引をしましょう。 1. なぜ FX Power がトレーダーにとって非常に有益なのか 通貨と金のリアルタイム強弱分析 • FX Power は主要通貨と金の相対的な強弱を計算し、マーケットダイナミクスに関する明確な洞察を提供します。 • どの資産がリードしているか、または後れを取っているかを監視して、取引するペアを賢く選びましょう。 マルチタイムフレームの包括的なビュー • 短期、中期、長期のタイムフレームで通貨と金の強弱を追跡し、マーケットトレンドに基づいて取引戦略を調整できます。 • スキャルピングからスイングトレード
通貨強さウィザードは、取引を成功させるためのオールインワン ソリューションを提供する非常に強力な指標です。このインジケーターは、複数の時間枠のすべての通貨のデータを使用して、このまたはその外国為替ペアのパワーを計算します。このデータは、使いやすい通貨インデックスと通貨パワーラインの形式で表され、特定の通貨のパワーを確認するために使用できます。 必要なのは、取引したいチャートにインジケーターを接続することだけです。インジケーターは、取引する通貨の実際の強さを示します。このインジケーターは、トレンドに合わせて取引するときに有利に利用できる売買高の圧力の極値も示します。このインジケーターには、フィボナッチに基づく可能なターゲットも表示されます。 このインジケーターは、PUSH 通知を含むあらゆるタイプのアラートを提供します。 購入後ご連絡下さい。私の取引のヒントをあなたと共有し、素晴らしいボーナスインジケーターを無料で提供します! 幸せで有益な取引をお祈りします。
作者のその他のプロダクト
Ninja X3 MT5 EA A selective automated USDJPY trading system designed for traders who prefer controlled trade frequency rather than constant market exposure. Ninja X3 MT5 is an Expert Advisor developed specifically for USDJPY on the H1 timeframe. The strategy focuses on identifying structured market opportunities using dynamic support and resistance, trend direction and price confirmation before allowing an entry. The objective is not to generate trades continuously. Instead, Ninja X3 waits for s
Peak Pips MT4 Zero-Repainting Trend Signals, Peak-Pips Tracking and Multi-Timeframe Scanning Peak Pips MT4 is a powerful trend-analysis indicator designed to help traders identify fresh BUY and SELL opportunities for scalping, intraday and swing trading, all from one chart. Backed by 23 years of testing with Dukascopy 100% tick data, the indicator combines a protected signal algorithm, confirmed zero-repainting signals, live peak-pips tracking and a built-in multi-timeframe scanner in one trader
Peak Pips MT5 Zero-Repainting Trend Signals, Peak-Pips Tracking and Multi-Timeframe Scanning Peak Pips MT5 is a powerful trend-analysis indicator designed to help traders identify fresh BUY and SELL opportunities for scalping, intraday and swing trading, all from one chart. Backed by 23 years of testing with Dukascopy 100% tick data, the indicator combines a protected signal algorithm, confirmed zero-repainting signals, live peak-pips tracking and a built-in multi-timeframe scanner in one trader
Live Risk Dashboard MT4 EA Monitor your account risk clearly and trade within your limits Live Risk Dashboard MT4 EA is a practical account-monitoring utility for MetaTrader 4. It displays your most important trading and risk information directly on the chart, helping remove the "math anxiety" of managing open positions. Instead of repeatedly checking different MT4 windows or manually calculating floating profit, drawdown usage, and remaining limits, you can view everything in one clean, compact
FREE
Live Risk Dashboard MT5 EA Monitor your account risk clearly and trade within your limits Live Risk Dashboard MT5 EA is a practical account-monitoring utility for MetaTrader 5. It displays your most important trading and risk information directly on the chart, helping remove the "math anxiety" of managing open positions. Instead of repeatedly checking different MT5 windows or manually calculating floating profit, drawdown usage, and remaining limits, you can view everything in one clean, compact
FREE
Wyckoff Phase Matrix Pro MT5 Wyckoff Phase Analysis, Trade Levels and Performance Statistics in One Dashboard Wyckoff Phase Matrix Pro MT5 is a structured market-analysis indicator that brings Wyckoff phase reading, setup bias, Entry/TP/SL levels, win-rate data, statistics and an equity curve into one clean MetaTrader 5 dashboard. It is designed to help traders understand current market structure more clearly, reduce chart-reading confusion and plan trades with defined levels instead of relying
Wyckoff Phase Matrix Pro MT4 Wyckoff Phase Analysis, Trade Levels and Performance Statistics in One Dashboard Wyckoff Phase Matrix Pro MT4 is a structured market-analysis indicator that brings Wyckoff phase reading, setup bias, Entry/TP/SL levels, win-rate data, statistics and an equity curve into one clean MetaTrader 5 dashboard. It is designed to help traders understand current market structure more clearly, reduce chart-reading confusion and plan trades with defined levels instead of relying
Fibonacci Pips MT4 Instant Fibonacci Levels, Prices and Pip Distances Fibonacci Pips MT4 is a practical Fibonacci measurement tool for MetaTrader 4. It displays each Fibonacci level together with its exact price and pip distance, helping traders plan pullbacks, profit targets and stop-loss levels without manual calculations. Instead of seeing only percentages such as 38.2%, 50.0% or 61.8%, traders can immediately understand: The Fibonacci level The exact market price The pip distance from the re
Session Clock MT4 Know Which Forex Session Is Active – Without Manual Time Calculations Session Clock MT4 is a clean trading-time dashboard for MetaTrader 4. It displays the four major Forex market sessions – Sydney, Tokyo, London, and New York – together with their opening times, closing times, live status, and the countdown to the next session. Forex market activity changes throughout the day. Some periods are quiet, while others bring faster price movement and higher volatility. Session Clock
Ninja X3 MT4 EA A selective automated USDJPY trading system designed for traders who prefer controlled trade frequency rather than constant market exposure. Ninja X3 MT4 is an Expert Advisor developed specifically for USDJPY on the H1 timeframe. The strategy focuses on identifying structured market opportunities using dynamic support and resistance, trend direction and price confirmation before allowing an entry. The objective is not to generate trades continuously. Instead, Ninja X3 waits for s
Session Clock MT5 Know Which Forex Session Is Active – Without Manual Time Calculations Session Clock MT5 is a clean trading-time dashboard for MetaTrader 5. It displays the four major Forex market sessions–Sydney, Tokyo, London, and New York – together with their opening times, closing times, live status, and the countdown to the next session. Forex market activity changes throughout the day. Some periods are quiet, while others bring faster price movement and higher volatility. Session Clock M
Avatar Fibo MT5 EA Special Launch Offer: Only 9 copies left at 39 USD. Once this limit is reached, the price will increase to 89 USD. Avatar Fibo MT5 is an Expert Advisor developed specifically for XAUUSD on the M15 timeframe . Fibonacci retracement is widely used in trading, but the difficult part is deciding which retracement zone, confirmation method, and market condition should actually qualify as an entry. Three independent Fibonacci retracement strategies combined into one automated Gold t
フィルタ:
レビューなし
レビューに返信