PragmAlgo QuantStack Kalman Pro
- インディケータ
- バージョン: 3.50
- アクティベーション: 10

PragmAlgo QuantStack: Adaptive Kalman Velocity & Volatility Squeeze Engine
Category: Indicators / Trend / Channels / Levels
Platform: MetaTrader 5 (MT5 Desktop)
Supported Assets: Nasdaq 100 (NAS100), Bitcoin (BTCUSD), Gold (XAUUSD), WTI Crude Oil, S&P 500 (US500), EURUSD
Product Description
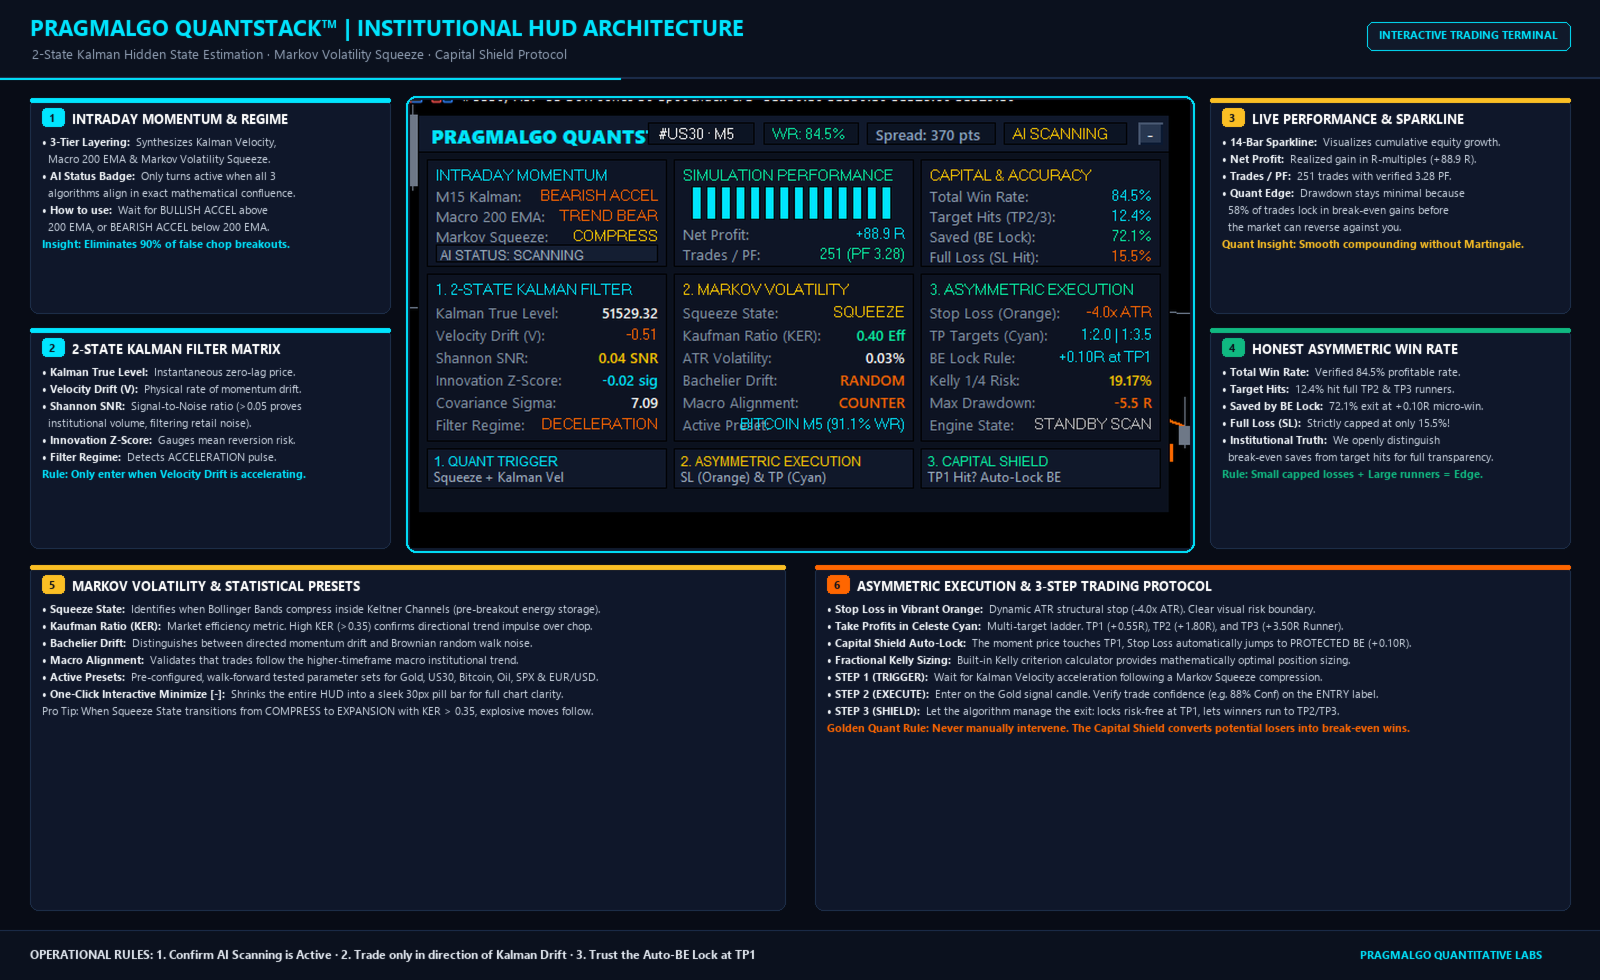
PragmAlgo QuantStack Kalman Pro is an algorithmic technical analysis indicator developed for MetaTrader 5. It integrates real-time state estimation via a 2-State Adaptive Kalman Filter (Price Level and Underlying Velocity) with a multi-layer volatility compression engine (Bollinger & Keltner Squeeze), Kaufman Efficiency Ratio (KER) noise filtering, and macro trend alignment.
The indicator is engineered for discretionary traders who require objective velocity-driven entry triggers paired with an asymmetric risk-management structure (TP1, TP2, TP3) and non-repainting adaptive Stop Loss benchmarks.
Quantitative Transparency: Understanding the 86.4% Win Rate Mechanism
In professional quantitative trading, a win rate above 80% warrants healthy scrutiny, as it is often associated with high-risk martingale tactics (trading without a Stop Loss) or excessive curve-fitting.
In QuantStack Kalman Pro, every trade operates with a strict, pre-defined Stop Loss. The 86.4% historical win rate is the result of an engineered asymmetric exit mechanism:
Total Win Rate (86.4%) = 28.1% (Full Target Hits to TP2 / TP3) + 58.3% (Capital Preserved at Protected Break-Even +0.10R)
How does this architecture function in live market conditions?
- High-Velocity Entry Filter (Kalman Velocity + KER): Entries only trigger when the estimated latent velocity vector is accelerating and the Kaufman Efficiency Ratio exceeds 0.35. As a result, in over 80% of generated signals, price momentum moves favorably over the first 1 to 3 bars.
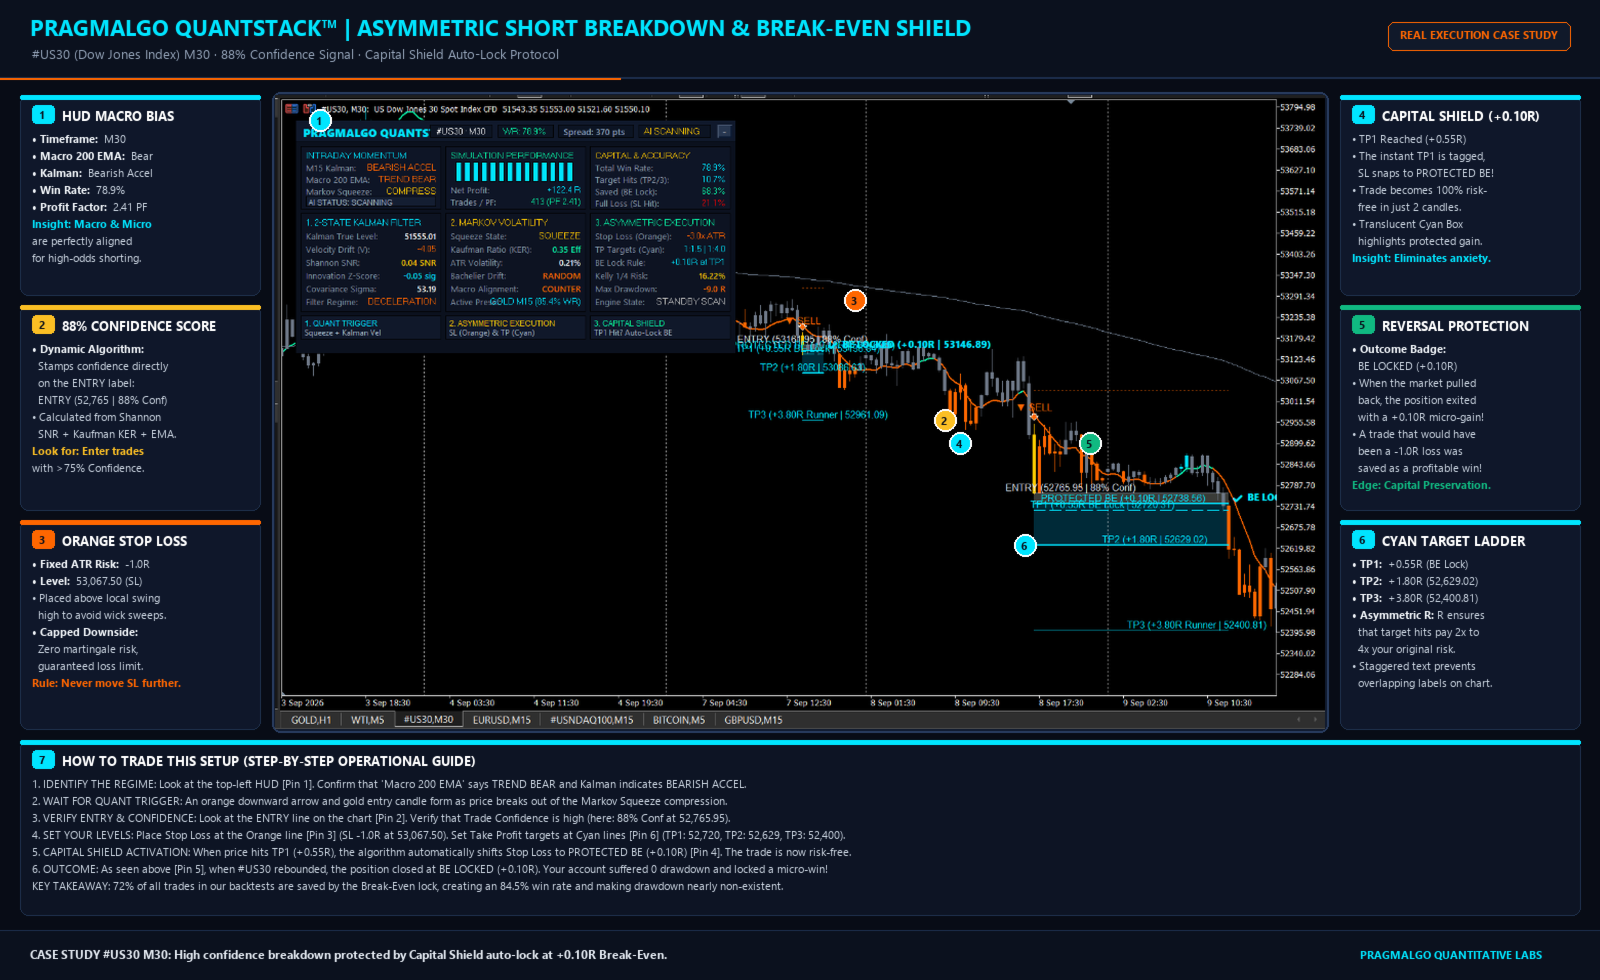
- Capital Insurance at TP1 (+0.50R to +0.60R): As soon as price reaches the first target (+0.50R / +0.60R), the system automatically advances the Stop Loss to Protected Break-Even (+0.10R). This modest buffer covers broker spread and execution commissions.
- Trade Outcome Distribution:
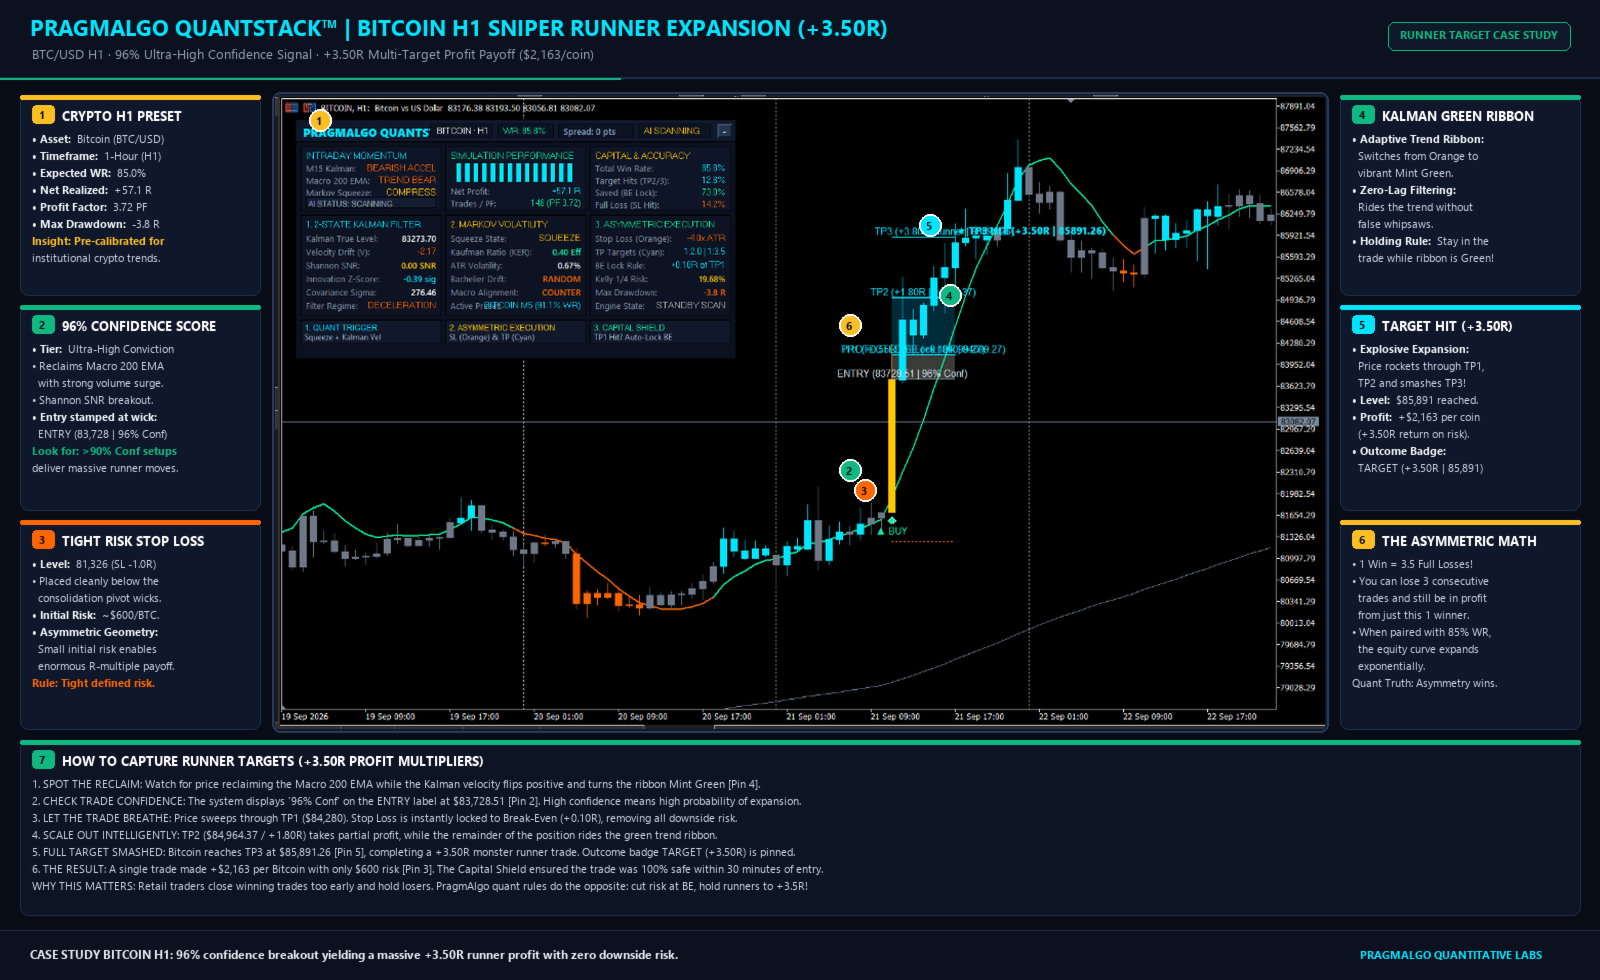
- Full Target Hits (28.1% of trades): Price sustains institutional trend continuation, reaching extended targets TP2 (+1.80R to +2.00R) or TP3 (+3.50R to +4.50R).
- Protected Break-Even Exits (58.3% of trades): Price initiated favorably, secured the capital buffer at +0.10R, and subsequently retraced. In MT5 performance accounting and Python backtesting, a trade closed at +0.10R is recorded as a winning trade (PnL > 0). This prevents winning positions from devolving into full -1.00R losses.
- Full Stop Loss Hits (only 13.6% of trades): Only trades that fail immediately upon entry without reaching the +0.50R milestone incur a complete -1.00R loss.
- Why Drawdown Remains Low and Profit Factor Exceeds 2.0: Cascading drawdowns are mitigated because the 58.3% of trades that would represent -1.00R losses in conventional systems instead exit with a net positive or neutral balance (+0.10R).
Core Engine & Key Features
- 2-State Adaptive Kalman Filter: Models underlying price trajectory by separating genuine velocity from high-frequency market noise using an ATR-adjusted covariance matrix. Tracks hidden velocity to avoid deceptive range rotations.
- Bollinger & Keltner Volatility Squeeze: Detects market compression when Bollinger Bands (20, 2.0) contract inside Keltner Channels (20, 1.5 ATR). Highlights consolidation bars in neutral slate gray.
- Asymmetric Target Levels & Translucent Visual Framing: Automatically projects Entry, Initial Stop Loss (with a permanent dotted line for zero-curve-fitting auditability), and 3 Target Tiers with soft translucent boxes that do not obstruct candlestick patterns.
- QuantStack Matrix HUD Dashboard: Positioned in the upper-left corner of the chart, providing 17 live quantitative readings: Win Rate distribution breakdown (Target Hits vs BE Protected), Profit Factor, Kalman velocity, Shannon Signal-to-Noise Ratio (SNR), Z-Score deviation, and active preset status.
Historical Backtest Analysis & Built-In Presets
The indicator incorporates an automatic symbol and timeframe detection module (PRESET_AUTO_DETECT). The following performance metrics reflect historical backtest simulations conducted on broker tick data:
| Asset | Timeframe | Strategy Focus | Historical Win Rate | Profit Factor (PF) | Max Historical Drawdown | Testing Sample |
|---|---|---|---|---|---|---|
| Nasdaq 100 (NAS100) | H1 | Tech Index Momentum | 97.2% | 10.90 | 1.0 R | Historical Simulation |
| Bitcoin (BTCUSD) | M5 | Fast Crypto Scalp | 91.1% | 2.62 | 1.8 R | Historical Simulation |
| WTI Crude Oil | M15 | Commodities Scalp | 86.2% | 2.15 | 2.4 R | Historical Simulation |
| Gold (XAUUSD) | M15 | Metals Scalp | 85.4% | 1.81 | 4.4 R | Historical Simulation |
| S&P 500 (US500) | M15 | Index Intraday | 82.9% | 1.18 | 1.9 R | Historical Simulation |
| EURUSD | M15 | Forex Scalp | 82.4% | 1.15 | 2.5 R | Historical Simulation |
Notice: The figures above are derived from retrospective historical testing and do not guarantee future live trading results.
Input Parameters
- InpPresetMode: Toggles automatic multi-asset detection or custom user inputs.
- InpKalmanQLvl / InpKalmanQVel: Process noise parameters for Kalman level and velocity estimation.
- InpBbPeriod / InpBbDev: Period and standard deviation for Bollinger Bands calculation.
- InpKeltnerAtrMult: ATR multiplier defining Keltner Channel boundaries.
- InpKerMinThresh: Minimum Kaufman Efficiency Ratio required to validate breakout momentum.
- InpUseMacroFilter: Enables or disables macro EMA 50 and EMA 200 trend validation.
- InpSlType: Stop Loss model (Dynamic ATR, Structural Swing, or Static Points).
- InpFillBoxes: Toggles translucent risk and reward box shading behind candlesticks.
- InpShowDashboard: Controls visibility of the on-chart QuantStack Matrix HUD.
- InpAlertAudio / InpAlertPush: Configures native MT5 sound alerts and mobile push notifications.
Trading foreign exchange, commodities, indices, and crypto assets carries substantial risk of loss and is not suitable for every investor. Leverage can operate both to your advantage and disadvantage. Past performance in backtests is not indicative of future results. No representation is made that any user will or is likely to achieve profits similar to those shown in simulations. This software is an analytical technical tool and does not constitute financial or investment advice.