Account PnL Board

Account PnL Board is a MetaTrader 5 indicator that turns your deal history into a readable performance report drawn directly on the chart.

Instead of a single balance figure you get one row per day, week, month or year with realised P&L, P&L percentage, lots traded, deal count and period-end balance, plus floating risk split into winners and losers, a deposit and withdrawal ledger and a full closed-trade log.

It is a single indicator file. No dynamic libraries, no external services, no sub-window and no indicator buffers, so it does not affect the chart data window or the template.

Period table
- Day, week, month and year aggregation, weeks start on Monday
- Realised P&L = DEAL_PROFIT + DEAL_SWAP + DEAL_COMMISSION, BUY and SELL deals only
- P&L percentage measured against the balance at the start of each period
- Lots closed, closing-deal count and period-end balance
- A total row across all periods, with the current period pinned on top

Open risk
- Floating P&L separated into positive and negative parts, as values and as a percentage of balance
- Optional treatment of the entry commission already paid on open positions

Chart
- Balance curve drawn as a line or as per-period bars
- Style selected automatically, line for the day view and bars for the other periods, or forced per tab
- Five grid levels with right-aligned labels

Ledgers
- Cash: every deposit and withdrawal together with the balance after each operation
- Trades: time, symbol, side, lots, open price, close price and P&L

Interface
- Four languages, English, Chinese, Japanese and Korean, switchable live from the title bar
- Per-language font selection so CJK text never renders as missing glyphs
- Draggable panel, collapsible to a 24 px title strip, dockable to any chart corner
- Interface scale from 0.5 to 3.0 with automatic shrink-to-fit on small charts
- 18 configurable colours and panel opacity from 0 to 255
- Scrollable detail rows, drag the thumb or click the track to page

Input parameters
InpTitle, title text, empty means the localised title plus version.
InpLanguage, startup language, Chinese, English, Japanese or Korean.
InpUIScale, overall interface scale, 0.5 to 3.0.
InpFont, font name, falls back to Arial when unavailable.
InpAutoFont, automatically use a font with Hangul glyphs in Korean mode.
InpBold, bold text.
InpCorner, panel docking corner.
InpX and InpY, pixel margins from the docking corner.
InpRefreshSec, refresh interval in seconds.
InpAllowDrag, allow moving the panel by its title bar.
InpAlpha, panel opacity, 0 to 255.
InpClr inputs, 18 colour settings covering the panel, borders, tabs, headers, totals, profit, loss, axis, curve, separators, row highlight, up and down bars and the scrollbar.
InpCountEntryComm, include the entry commission already paid on open positions in the floating P&L.
InpMaxRows, maximum number of detail rows, 0 means unlimited.

Calculation notes
Realised P&L per period is the sum of DEAL_PROFIT, DEAL_SWAP and DEAL_COMMISSION over BUY and SELL deals closed inside the period. DEAL_TYPE_BALANCE deals are excluded and reported separately as cash.
P&L percentage per period is the period P&L divided by the balance immediately before the period first deal. Using the opening balance keeps periods comparable after deposits or withdrawals.
The balance column shows the account balance after the last deal of the period.
Floating profit and floating loss are the positive and negative parts of POSITION_PROFIT plus POSITION_SWAP over open positions. With InpCountEntryComm enabled the commission already paid on those positions is subtracted, because POSITION_COMMISSION is deprecated in MQL5 and returns 0.
The total row shows the period count, the summed P&L, the P&L as a percentage of the total deposited, the summed lots and deals, and the current balance and floating figures.

Requirements
MetaTrader 5 terminal and MetaEditor. Any symbol. The panel reads the account own deal history, so it reflects whatever history depth the broker provides. No dynamic libraries, no network access and no external services.

Installation
1. Place AccountPnLBoard.mq5 in the MQL5\Indicators folder of the terminal data directory.
2. Compile it in MetaEditor.
3. In the Navigator open Indicators and drag AccountPnLBoard onto a chart.

Limitations
Mouse wheel scrolling is not available, because MQL5 mouse events do not carry wheel deltas. Use the scrollbar thumb or click the track to page.
The report reflects the account visible deal history, so it is bounded by the history depth provided by the broker.
Very long histories increase the first build time, later rebuilds are throttled and cached.

Disclaimer
Educational tool for reviewing your own trading history. It does not provide signals and makes no performance claims. Trading leveraged products carries a high risk of loss.
おすすめのプロダクト
DRX SPREAD MONITOR は、ブローカーのスプレッドをリアルタイムで可視化・分析するために設計されたプロフェッショナルなユーティリティです。ニュースイベント、ロールオーバー、または流動性の低いセッション中のスプレッド拡大によって引き起こされる隠れたコストを特定するのに役立ちます。 このツールは、約定品質を確保し、取引コストが統計的に高すぎる場合のトレードを回避する必要があるスキャルパーやゴールドトレーダーにとって不可欠です。 主な機能 リアルタイムヒストグラム: 別のウィンドウにスプレッド履歴を表示し、通常、高、極端なレベルを色分けします。 動的移動平均(MA): 平均スプレッドの傾向を計算し、一時的なスパイクと構造的なスプレッドの増加を区別するのに役立ちます。 視覚的「イコライザー」モード: チャートを乱雑にすることなく、市場の流動性状況に関する即時フィードバックを提供する独自のバーチャート表示です。 ライブデータパネル: チャート上のコンパクトなダッシュボードで以下を表示します: 現在のスプレッド 平均スプレッド(時間ベース) 最小/最大記録 音声警告システム: スプレ
FREE
TerminalBridge Account Analytics is an on-chart account statistics indicator for MetaTrader 5. It organizes closed trading activity into day, week, month, quarter and year views. Account-wide records include all symbols by default. Main features - Live floating profit or loss - Recorded daily maximum floating loss - Floating-loss percentage, occurrence time and data status - Today, All, Last 1 Month, Last 3 Months and Custom history ranges - Built-in calendar for custom date selection - Filt
FREE
Volume Spike Levels identifies candles with unusually high volume relative to their recent average, preserves their High-Low ranges, and monitors subsequent price confirmation. It is designed for discretionary chart analysis on Forex, metals, indices, cryptocurrencies, and other instruments supported by MetaTrader 5. The indicator displays configurable range boxes or horizontal levels, BUY/SELL confirmations, and a separate price-inversion event when a previously confirmed volume range is overco
FREE
Spread & Swap Monitor — Real-Time Trading Cost & Rollover Fee Tracker for MT5 Never enter a trade blind to broker spreads and overnight financing fees. Spread & Swap Monitor provides an elegant, non-intrusive on-chart HUD that continuously tracks live spread volatility against a rolling average and calculates real swap costs directly converted into your account currency. KEY FEATURES - Real-Time Spread Tracking: Displays live spread in both pips and raw points. - Dynamic Volatility Alert: Spr
FREE
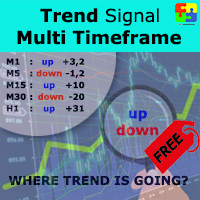
Free version. Only works on EURUSD Do you want to always know in a quick glance where price is going? Are you tired of looking back and forth between different timeframes to understand that? This indicator might just be what you were looking for. Trend Signal Multitimeframe shows you if the current price is higher or lower than N. candles ago, on the various timeframes. It also displays how many pips higher or lower current price is compared to N. candles ago. Number N. is customizable The data
FREE
CRT + Daily Bias – Milana Trades A clean tool for Candle Range Theory (CRT). It marks the CRT range on your chart and shows the daily and weekly bias in one small table. WHAT IS CRT One candle sets a range: its high and its low. The next candle takes out one side of that range and closes back inside. This is the sweep. After the sweep, the opposite side of the range becomes the target. WHAT THE INDICATOR DRAWS - CRT H and CRT L – the high and low of the range candle. - 0.5 – the middle of th
FREE
SessionBands draws the three major sessions directly on your chart: - **Tokyo, London and New York boxes** for the last N days (default 5), each spanning its session's actual high–low range - sessions are defined in **server time**, with every start and end hour adjustable in the settings - each box carries its session's **name label** and a distinct color, blended against your chart background at an adjustable opacity - today's active session box grows with the session in progress - a corner r
FREE
This is a usefull utility for monitoring spread and also for recording informations to a file. (Files will be placed into "Common\Files\Spread Monitor"). There is the possibility to let the indicator calculate high/low into the past thanks to downloading ticks. (It's a slow and approsimate thing! The best way to use it is to attach to a chart and let it recording spread in real time). There is also a buffer with the average of spread in latest X periods. Easy and effective.
FREE
Simple. Informative. Instantly Visible on Your Chart. Alwinson Active Trades Info  is a lightweight indicator that displays a summary of currently open positions directly on the chart. It removes the need to switch to the Terminal window to check which symbols are active and what volume is involved. An MT4 version of this indicator is also available among my products. Key Features: Lists all symbols that currently have open positions in the trading account. Shows the dominant position type (BUY
FREE
Main purpose:   "Pin Bars"   is designed to automatically detect pin bars on financial market charts. A pin bar is a candle with a characteristic body and a long tail, which can signal a trend reversal or correction. How it works:   The indicator analyzes each candle on the chart, determining the size of the body, tail and nose of the candle. When a pin bar corresponding to predefined parameters is detected, the indicator marks it on the chart with an up or down arrow, depending on the directi
FREE
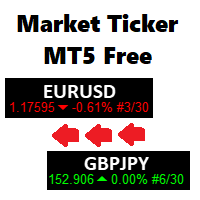
Market Ticker Free MT5
John Louis Fernando Diamante
5 (1)
A scrolling Market Ticker that displays price changes from all symbols in the Market Watch list. Provides an easy snapshot of symbol prices, and keeps scrolling automatically while you trade and analyse the chart. Options include: - MTF, eg choose to show price changes of the daily chart, or the hourly - use the live candle or the recently completed - font and background coloring
FREE
What It Shows Candle Clock Desk puts four lines on the chart. The first is the time left until the current bar closes. The next three answer a question the clock alone cannot: is this bar unusually busy, or unusually quiet, right now. Bar closes in - the countdown, in minutes and seconds So far - volume this bar has accumulated since it opened Usual here - what this symbol had accumulated by this same minute, in the past Pace - the first divided by the second The Pace Line Pace of 1.00 means the
FREE
アジア・ロンドン・ニューヨークの 3 大セッションに対応した Opening Range Breakout (ORB) ツール。オープン時刻は完全に編集可能です。 • 各セッション:最初の N 分間のボックス(長さは自由に設定)、24 時間先まで延長される高値・安値エッジ、ミッドライン。 • ライブ更新:オープニングレンジの形成中、ボックスがリアルタイムで拡大。 • 「AS ORB M5」のようなセッションラベルで、どのレンジを見ているか常に明確。 • ボックスとその延長エッジのタッチアラート——ブレイクアウト後のリテストを逃さない(デフォルトはオフ)。 • 各セッションは個別にオン/オフでき、それぞれ独自の色を設定可能。 チャート上のコントロールパネル:設定ウィンドウ付きのドラッグ可能パネル——11 のインターフェース言語、ダーク/ライトテーマ、18 色のカラーパレット、30~300% のパネルスケール。すべての設定は自動保存されます。 万一、問題やバグを見つけられた場合は、ぜひご連絡ください。迅速に修正いたします。また、レビューを残していただけるととても嬉しいです。皆様のフィードバ
FREE
The Big Swinger Its Free For Only 7 Days After That You Will Have To Pay 50 to 100$ (You Have Only 7 Days) Overview The Big Swinger is a technical trading indicator designed to help traders identify potential buying and selling opportunities through clearly displayed chart signals. It evaluates predefined market conditions and highlights potential trade setups directly on the chart, helping traders observe possible market turning points without manually monitoring every price movement. Key Fea
Know which market is open. Know when the next strong news hits. Never trade blind into a news spike again. LTS Sessions & News is the market-timing indicator from LTS — Legacy Trading System . It draws the Asia, London and New York sessions on your chart, shows three clocks (broker server, GMT and your local time) and reads the next high-impact news straight from the MT5 economic calendar, with countdowns and alerts. No external website, no DLL, no setup. EVERYTHING ON ONE CHART Asia session
FREE
The euro index on your chart, built live from your own broker's five euro pairs. When EURUSD falls you cannot tell from EURUSD alone whether the euro is weak or the dollar is strong. An index answers it. Put this under any chart and you are looking at the euro on its own terms, measured against the pound, the yen, the franc and the krona as well as the dollar. It uses the New York Board of Trade Euro Currency Index formula. EUR/USD 31.55% EUR/GBP 30.56% EUR/JPY 18.91% EUR/CHF 11.13% EUR/SEK 7.85
FREE
EquiSentra Risk Desk Short description An MT5 risk dashboard for prop and personal accounts. Review SL/TP scenarios for open positions and pending orders, monitor configured loss limits and profit targets, and receive selectable mobile push notifications. Product description See your portfolio exposure, remaining loss allowance and profit target in one chart panel. EquiSentra Risk Desk is a MetaTrader 5 indicator designed for traders who manage prop accounts or want a clearer view of account ris
FREE
Our offer also includes a free panel — Indicator Panel — which allows you to show or hide indicators created by BOToBRACIA ->  MT4  /   MT5 Our offer also includes a version for MetaTrader 4 ->  https://www.mql5.com/en/market/product/179248?source=Site+Market+Product+Page#description Indicator Panel   is a tool designed to manage the visibility of technical analysis objects generated by our indicators. Instead of enabling/disabling individual indicators or manually removing chart objects, a si
FREE
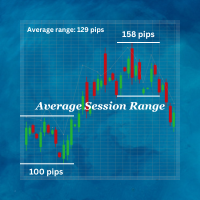
Average Session Range: Calculate and Average the Sessions High-Low Range of Specific Time Sessions Over Multiple Days. The Session Average Range is a sophisticated and precise tool designed to calculate the volatility of specific time sessions within the trading day. By meticulously analyzing the range between the high and low prices of a defined trading session over multiple days, this tool provides traders with a clear and actionable average range. **Note:** When the trading platform is closed
FREE
Moving Spread
Jose Maria Molina Sanchez
Moving Spread – リアルタイム市場コストモニター 平均スプレッドをリアルタイムで監視し、高コスト期間の取引を回避します。 このインジケーターの機能 Moving Spread は、時間の経過とともに市場の 平均スプレッド(ポイント単位) を測定し、その変化を示します。これは、エントリー時のコストが高すぎる場合を把握するのに不可欠なツールです。このような状況では、取引開始前から利益が損なわれる可能性があります。 なぜこれが重要ですか? スプレッドが高いということは、市場への出入りに多くの費用がかかることを意味します。このインジケーターは、こうした瞬間を特定し、コストが高すぎるときに取引を避けるのに役立ちます。 動作方法 現在のスプレッドを別ウィンドウに表示 します。赤いラインが平均値を表しています。 スプレッドが設定されたしきい値(例:> 0)を超えると、 自動アラート を表示します。 スキャルパーおよびデイトレーダーに最適 です。これにより、「ブリーディング」(継続的な損失)による隠れた損失を回避できます。 実際の例 添付画像のように、資産や時間
FREE
Gold Position Size Calculator (XAUUSD) - a free risk-based lot size calculator built specifically for gold traders. Enter your account balance, risk percentage, entry price and stop-loss price. The calculator instantly shows the correct lot size, risk amount, stop distance, risk/reward ratio and potential profit - so every gold trade risks exactly what you allow, never more. Features: Built for Gold (XAUUSD), works on any forex pair Auto-detects contract size from the symbol specification (no ma
FREE
Apex Point is a trend-following indicator for MetaTrader 5, transforming complex market data into signals for traders. It displays blue dots for uptrends, red dots for downtrends, and yellow crosses at potential reversals, helping users identify momentum shifts quickly. Key features include a confirmation system requiring multiple bars (default: 3) to validate changes, reducing false signals; dynamic ATR-based offsets for adaptive trailing, with instant ratcheting in the trend direction and smo
FREE
移動平均の形ではなく、相場の実際の回転を測る二本の線。Vortex Indicator MTFは上向きと下向きの渦運動を窓の上で合計し、それぞれを真の値幅で割り、できあがった二本の交差からシグナルを取ります。つまり足そのものから測った方向の変化です。中に再帰はまったくないので、どの足からの継続も作りの上で厳密に一致します。無料です。試用期間なし、機能制限なし、上位版への誘導なし。 窓の上で三つの合計を取ります。この足の高値から一本前の安値までの距離、すなわち上向きの渦運動、この足の安値から一本前の高値までの距離、すなわち下向きの渦運動、そして真の値幅です。前の二つをそれぞれ三つ目で割るとVIプラスとVIマイナスが得られます。どちらも一の周りを揺れ、その交差がシグナルです。 この移植版に再帰は一切ありません。二本の線は、入力の高値、安値、終値に対する窓の純粋な関数なので、どの足からの継続も近似ではなく作りの上で厳密に一致します。強度水準は交差を等級1ではなく2にするだけで、渦の強まりと衰えを独立したイベントとして印します。何も除外せず、交差はすべて公開されます。 チャート上の表示 専用ウ
FREE
PFG Risk Meter The PFG Risk Meter is a free companion indicator for the PropFirmGuardian EA Suite . It displays real-time daily and total drawdown as visual gauge panels on your chart, giving you instant visual feedback on your prop firm rule status. Features Live daily drawdown gauge Live total drawdown gauge Color-coded warning and danger zones Works on any symbol and timeframe Designed to run alongside the PropFirmGuardian EA Requirements This indicator is part of the PropFirmGuardian EA Suit
FREE
This indicator displays the spread with extra options Simple and easy to use and fully customisable: View as Pips or Pipettes Chart symbol can be hidden Text display can be changed Change colour and text styles Add or hide a decimal point Spacing options between inputs Default screen positions Screen position inputs Pro version includes: Drag and drop box on the screen Add an alert when the spread is too high Alert colours for text and text box changeable How to use 1. Simply use the default
FREE
Percent Change Dashboard Percent Change Dashboard は、MetaTrader 5 向けに開発されたコンパクトで使いやすい情報表示インジケーターです。複数の時間足における金融商品の価格変化率(%)をリアルタイムで表示し、市場の勢い(モメンタム)を素早く把握することができます。 手動で計算したり、複数の時間足を切り替えたりすることなく、市場の方向性や強さを一目で確認したいトレーダーのために設計されています。 ️ 主な機能 1時間変化率 (%) — 短期的な市場の動きを表示 日次変化率 (%) — 当日の価格変動を確認 週次変化率 (%) — 中期的なトレンド分析をサポート 月次変化率 (%) — より広い視点で市場を把握 メリット 市場の強さと方向性を瞬時に把握 トレンドフォローやモメンタム戦略に最適 自動計算により分析時間を短縮 FX、株価指数、貴金属、暗号資産など幅広い銘柄に対応 チャートを見やすく保つシンプルなインターフェース こんなトレーダーにおすすめ スキャルピングやデイトレードを行うトレ
FREE
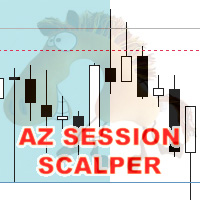
AZ session scalper A small but useful session indicator, designed primarily for scalping. Enable the session you plan to trade, watch the reaction of the M5/M15 candlesticks to the level of the previous trading session, and enter. We always look at the reaction of the current session to the previous one. For example, if you trade the Americas, enable the European session, and watch how one session takes away liquidity from another. Important: adjust the time to your broker's time zone in the i
FREE
Magic Number Stats は、口座で動いている各EAの実際の成績を表示するインジケーターです。 1つの口座で複数のEAを動かすと、口座の履歴には全EAの取引が混ざります。このインジケーターはマジックナンバーで取引を分け、EAごとに1行で表示するので、どのEAが利益を出し、どのEAが損失を出しているかがひと目で分かります。 マジックナンバーごと(手動の取引は「Manual」)に次の項目を表示します。 Trades:決済済みポジションの数 Win%:手数料・スワップ込みで利益になったポジションの割合 Net:口座通貨での損益 PF:プロフィットファクター(総利益÷総損失) AvgWin / AvgLoss:勝ちポジション・負けポジションの平均損益 MaxDD:そのEAの決済ベースの最大ドローダウン AvgHold:平均保有時間 TOTAL の行に口座全体の合計を表示します。利益の行は緑、損失の行は赤で表示し、最初の取引の注文コメントをマジックナンバーの横に表示するので、どのEAかすぐ分かります。 計算はポジション単位で、エントリー・一部決済・決済のすべての約定を手数料・スワップ
FREE
Market State Reader Panel is the free version of Market State Reader. It reads the chart the way a price action trader does and writes the result on the chart in plain words: is this a trend or a trading range, who is in control (bulls or bears), did the last breakout follow through or fail, where is the gap, is there a measured-move target, and what is worth looking for on the next bar. It works on closed bars only, so nothing repaints. It was built for intraday index trading (DAX, US500, Nasda
FREE
本インジケーターは、 Force Index(フォース・インデックス) ——各バーの価格変動にその出来高を掛け合わせた値——を、適応型の標準偏差バンドの中に描画します。価格だけでは「相場が動いた」ことしか分かりませんが、Force Index はそれを動かすためにどれだけの力がかかったのかを示します。 薄商いでの大きな値動きと、大商いでの小さな値動きは、ローソク足が似て見えても全く別の出来事です。Force Index は両者を一つの値にまとめることで区別し、バンドはその値をその銘柄自身の直近の挙動という文脈の中に位置づけます。 動作原理 各バーについて、生の Force Index は現在の終値と前の終値との差に、そのバーの出来高を掛けた値です。高く引ければ正、安く引ければ負となり、その大きさは取引量に応じて変化します。既定ではティックボリュームを使用し、ブローカーが実出来高を提供している場合は自動的にそちらが使用されます。 この生の系列は、選択した期間と平均化手法によって平滑化されます。ここで平滑化は決定的に重要です。平滑化されていない Force Index は非常にノイズが多く
FREE
このプロダクトを購入した人は以下も購入しています
Trend Sniper X
Sarvarbek Abduvoxobov
4.86 (44)
Trend Sniper X は、トレードの方向性と潜在的な反転ポイントを明確かつ正確に特定するのに役立つ、MetaTrader 5 用のマルチタイムフレーム・トレンドフォロー指標です。 MT4用: https://www.mql5.com/en/market/product/193245 価格情報: 現在の価格はプロモーション価格であり、今後のアップデートや新機能のリリースに伴い変更される場合があります。 ボーナス特典: このインジケーター用の無料自動売買アシスタントEAを入手するには、購入後に an 著者(開発者)へメッセージをお送りください。 Code2Profit チャンネル マルチタイムフレーム分析で相場をマスターしよう! Trend Sniper X で勝率を最大化する方法:重要なルールとセッションのコツ 技術仕様 プラットフォーム MetaTrader 5 インジケータータイプ マルチタイムフレーム・トレンドインジケーター 操作タイムフレーム あらゆるチャートタイムフレームに対応。個別に選択可能な上位タイムフレーム (M1–MN1) を搭載 主要銘柄 FX、ゴールド (X
新たな王者が登場 - インジケーター + 注文管理表示(TP1 + TP2 + TP3)+ オプションのTelegramシグナル送信機能付き(無料) (完全なトレード&シグナルシステム) ゴールド向け最高のEA: Gold Slayer このインジケーターには、高度な戦略、カスタマイズ可能な注文管理システム、そしてエンベロープ拡張を組み合わせた平均回帰システムが搭載されています。さらに、RSIなど複数のインテリジェントな確認フィルターによって、高確率の反転エントリーをBUY・SELLシグナルとして検出します。 単にトレードを学ぶだけでなく、複数ポジションを効果的に管理し、過去に利益を出しているオープンポジションで損失トレードをカバーする方法も学べます。 M5向けに構築・最適化されており、流動性が高くシグナルの精度が安定しているBTCUSDとXAUUSDで優れたパフォーマンスを発揮します。 このインジケーターは、ATRを基に自動計算されたエントリー、ストップロス、テイクプロフィットレベルを備えた明確なLong・Shortシグナルを提供するため、リスク管理が最初から組み込まれています。 マ
Smart Trend Trading System — MetaTrader 5 ご購入後、MQL5で私にメッセージをお送りいただくと、Smart Universal Expert Advisorを無料で受け取れるほか、オンライン講座、PDFマニュアル、非公開グループへのアクセスもご利用いただけます。 STTSは、トレンドの方向、エントリー・決済シグナル、反転ゾーン、重要な価格水準をチャート上にまとめて表示します。システムを参考に手動で取引することも、別の対応EAを接続し、ご自身で選んだ設定に基づいて自動売買することもできます。 ひとつのシステム、4つのトレードアプローチ STTSのトレードアプローチは、大きく4つのカテゴリーに分かれています。 • スキャルピング — 短期的なシグナルや相場の動きを捉えます。 • トレンドトレード — 方向性を評価し、トレンド内の機会を探します。 • 反転トレード — 反転の可能性があるゾーンや方向の変化を見つけます。 • 出来高トレード — 出来高に基づく情報を使い、市場の活発さを評価します。 エントリー・決済の矢印、トレンド情報、サポート・
Zoryk Gold
Reda El Koutbane
4.78 (18)
割引は 24 時間後に終了します — 次の価格は$ 69 ZORYK — MetaTrader 5専用 XAUUSDシグナル・トレードプランニングシステム このような経験はありませんか。 ゴールドを分析し、エントリーを待ち、ようやくポジションを持った直後に価格が逆方向へ動く。 早すぎる決済をしてしまったり、Stop Lossを動かしたり、数秒迷っている間にチャンスを逃したりする。 その後、相場は自分が最初に予想していた方向へ進み、目標へ到達する。 問題は常に方向判断ではありません。 本当の問題は、明確な計画がなかったことです。 どこでエントリーすべきか。 どこでトレードの前提が無効になるのか。 近い利益を確保すべきか、より大きな値動きを待つべきか。 現在のsetupが本当に強いのか、それとも無理にトレードを探しているだけなのか。 ゴールドは非常に速く動きます。 正しい分析でも、明確なプランがなければ数秒で悪い判断に変わることがあります。 ZORYKは、その問題を解決するために開発されました。 ZORYKとは ZORYKは、MetaTrader 5とXAU
Entry Points Proは、注文を出す前に、どこでエントリーし、どこにストップを置き、どのロットで取引するかを示します。 価格 現在 149 USD、この価格での販売は残り1本です。その後は 199 USD に値上がりし、最終価格は 349 USD です。 私は相場のトレードで収入を得ており、それを公開しています。だから、このインジケーターを誰にでも売る必要はありません。自分の頭で考えるトレーダーのためのツールであり、魔法のボタンではありません。 矢印はローソク足の確定時に表示され、リペイントしません。設定は2つ:あなたの資金と1回のトレードあたりのリスクです。 お支払い前にご確認ください:無料デモはMT5のストラテジーテスターで動作し、2分で済みます。ご購入後は、私が個人的に設定をお手伝いします。 2019年、私はこのインジケーターの実力を世界中に示しました。そのシグナルに従って手動で、リアル口座で、公開の場でトレードしたのです。口座はMyfxbookでモニタリングされ、私はこの実験の経過をFacebookで詳しく発信していました。結果:4か月で10,000ドルが941,4
あなたのトレード優位性を視界に入れよう! M5 Sniper は MeanFX による新しいインジケーターです。 正確なトレードシグナル と 適応型TP/SLレベル を組み合わせることで、結果として可能な限り最高の統計的トレードを実現します! 5回購入されるごとに価格が上昇し、次の価格は69$です 購入後に私にメッセージを送っていただければ、ヒント/ガイドとボーナスEAをお受け取りいただけます 何が他と違うのでしょうか? Gold XAUUSDにおける 実証済みの統計的パフォーマンス ( ほぼすべてのアセットで機能します 。一貫した結果が得られないまま何でも扱おうとするのではなく、1つの時間足をマスターすることに重点を置いています) 1日あたり1~8回のトレード を各シンボルで実行し、高い勝率と、すべての統計的優位性をこちら側に持つことができます チャート上には 確認済みの BUYおよびSELLシグナルのみを表示 適応型TPおよびSLレベル を各トレードごとにインジケーターが生成 平均Winrate 75%+ 平均 Signal Ratio 最低1.1+ アラーム と通知を 携帯電話
SuperScalp Pro
Van Minh Nguyen
4.54 (37)
SuperScalp Pro - Professional Multi-Layer Confluence Scalping System SuperScalp Proは、複数の高度な確認フィルターを追加することで、従来のSupertrendを強化したスキャルピング向けインジケーターです。誤ったシグナルを大幅に減らしながら、成功する可能性がより高いBuy/Sellの取引機会を見つけるのに役立ちます。 BuyとSellの矢印がチャート上に明確に表示され、ATRに基づくStop LossとTake Profitのレベルもリアルタイムで自動計算されます。 ご購入後、MQL5で私にメッセージを送っていただくと、SuperScalp Pro Auto Trader EAを無料で受け取れるほか、ユーザーガイドとプライベートグループへのアクセスもご利用いただけます。 推奨設定ファイルをダウンロード: [Set File] 詳細なドキュメントは製品ブログでご覧いただけます: [User Guide] 最新情報を受け取るには公式チャンネルにご参加ください: [Official Channel] Sup
Gold Trend Coach MT5
Cristhian Alexander Gaibor Cuasquer
4.2 (10)
Gold Trend Coach は MetaTrader 5 用のゴールド(XAUUSD)トレンドインジケーターです。ローソク足の確定時に確認される売買シグナル(リペイントなし)、ストップロスと3つのテイクプロフィット、エントリーから TP3 まで導くコーチ、マルチタイムフレームパネル、スマホと Telegram へのアラートを備えています。ロンドン・ニューヨーク時間の M1・M5 スキャルピングと M15 デイトレード向けです。 ボーナス:Gold Trend Coach 用の自動売買 EA を無料でお渡しします。 購入後にメッセージをいただければ、インジケーターのシグナルを自動で売買する EA と、すべてのシグナル、エントリー、ストップ、到達したターゲットを Telegram のチャット、グループ、チャンネルに送る Telegram Alert Bridge を、set ファイルと設定ガイド付きでお送りします。 発売価格 $39 は最初の 20 本限定で、すでに完売しました。現在の価格は 40 本まで $45、その後 $59。予定している最終価格は $79 です。 ゴールドのイン
GoldenX Entry MT5
VividMind Digital Solutions
5 (17)
GoldenX Entryは、MT5向けのインジケーターであり、適応型Smart Entry Trendアルゴリズム、シグナルスコアリングシステム、マーケットレジーム検出機能、およびボラティリティフィルターを備えています。各シグナルには、計算されたエントリーレベル、3つのテイクプロフィット(TP1、TP2、TP3)、およびストップロスレベルが含まれます。本インジケーターは、異なる市場環境に適応するために設計された複数の分析レイヤー上に構築されており、マルチレイヤー分析システムと内蔵オプティマイザーおよび統計トラッキングシステムを組み合わせています。リスク・リワード(RR)指標および過去のトレード履歴に基づく定量分析を提供します。 使い始めは簡単です — 選択した時間足でオプティマイザーを実行し、そのままチャート上でインジケーターを使用します。 コア機能 GoldenX Entryは、シグナルエンジンとトレード管理機能、そして過去統計トラッキングを1つのチャートに統合しています: - 内蔵オプティマイザー: オプティマイザーはチャート上でワンクリックで実行できます。200通りのパラメー
SMC Intraday Formula
VividMind Digital Solutions
5 (26)
まず正直に言いましょう。 どんなインジケーターも、それ単体であなたを利益化させることはできません。もしそう言う人がいるなら、それは夢を売っているだけです。完璧な売買シグナル(矢印)を表示するインジケーターは、いくらでも“完璧に見せる”ことができます。正しい過去の区間を拡大して、勝ちトレードだけを切り取ればいいだけです。私たちはそれをしません。 SMC Intraday Formula はツールです。 市場構造を読み取り、最も高い確率の価格ゾーンを特定し、今この瞬間のスマートマネーの痕跡をシンプルな言葉で正確に示します。最終判断はあなたが行います。トレードを実行するのもあなたです。しかし今は「希望」ではなく「精度」でエントリーできます。 私たちはこのインジケーターを、ゴールド(XAUUSD)および主要FX通貨ペアで約3年間、日々のスキャルピングに使用してきました。M1、M5、M15、M30の主要ツールです。これは未来を予測しようとするのではなく、今まさに形成されている高確率セットアップを示し、その理由を説明します。 他のすべてのインジケーターと何が違うのか? ほとんどのトレーディングイ
Gann Made Easy   は、ミスター・ギャンの理論を使用した取引の最良の原則に基づいた、プロフェッショナルで使いやすい外国為替取引システムです。 W・D・ガン。このインジケーターは、ストップロスとテイクプロフィットレベルを含む正確な買いと売りのシグナルを提供します。 PUSH通知を利用して外出先でも取引可能です。 ご購入後、取引方法の説明と優れた追加インジケーターを無料で入手するには、私にご連絡ください! おそらく、ギャンの取引手法についてはすでに何度も聞いたことがあるでしょう。通常、ギャンの理論は初心者のトレーダーだけでなく、すでにある程度の取引経験がある人にとっても非常に複雑なものです。なぜなら、ギャンの取引手法は理論的にはそれほど簡単に適用できるものではないからです。私はその知識を磨き、最良の原則を私の外国為替インジケーターに組み込むために数年を費やしました。 このインジケーターは非常に簡単に適用できます。必要なのは、それをチャートに添付し、簡単な取引推奨事項に従うだけです。このインジケーターは常に市場分析の仕事を行い、取引の機会を探します。適切なエントリーポイントを検
ULTRAは、「オールインワン」方式で機能するテクニカル指標です。市場を独自に分析し、売買シグナルを生成し、ストップロス注文を設定するための水準を表示し、利益を確定したり損失を最小限に抑えたりするためにポジションを決済すべきタイミングを提案します。 つまり、市場の分析方法や、水準(ストップロスをどこに設定すべきか)の見極め方がわからなくても、あるいは資金管理に苦労していても問題ありません。ULTRAがすべて代行してくれます! 購入者限定特典 :「ULTRA」インジケーターをご購入後、私にプライベートメッセージをお送りいただければ、「ULTRA BOT」を無料プレゼントとしてお受け取りいただけます。これは、このインジケーターからのシグナルに基づいて、オープンしたトレードを管理するのに役立つ特別なツールです(各トレードにストップロスを設定し、最適な結果が得られるよう、戦略のルールに従って自動的にトレードを決済します)。  また、インジケーターを最大限に活用できるよう、さまざまな資産向けの既成の設定も購入者の皆様に提供しています。これらの「超お得な特典」を無料で入手するには、私へダイレクトメ
Boba Analysis Suite
Trade Ready Solutions LLC
5 (2)
Boba Analysis Suite Boba Analysis Suite は、MetaTrader 5 向けの分析インジケーターです。市場構造、重要な価格帯、相場全体の状況を、一つのチャート画面にまとめて表示します。 トレーダーおよびトレーディング指導者としての実務経験をもとに開発され、市場の方向性の評価、重要な価格水準の特定、複数の時間足を組み合わせた分析など、体系的な分析プロセスを支援します。 相場の背景を踏まえた分析 個々のシグナルの意味は、相場の状況によって変わります。Boba Analysis Suite は、現在のチャート状況をより大きな市場構造と関連付け、あらかじめ定めたルールに沿って取引アイデアを検討するための分析を支援します。 主な分析機能: トレンドと市場構造: 市場の方向性と、その背景にある構造を評価します。 重要な価格帯と価格水準: さらに分析すべき重要な領域を視覚的に表示します。 複数の時間足: 異なる時間足の情報を組み合わせ、相場全体の状況を評価します。 視覚的な分析プロセス: 分析情報をチャート上で直接確認できます。 自主的な取引判断を支援 Boba
次回アップデート — バージョン 2.52 近日公開!【新機能】 市場分析とトレードワークフローを強化する、4つの主要な新機能にご期待ください 皆様のトレードニーズに応える4つの新機能により、市場分析を次のレベルへと引き上げます。新機能をご紹介します: 1. TRADE OVERVIEW DASHBOARD 2. CONFLUENCE AT ZONE 3. STRONG & WEAK HIGH/LOW 4. OTE 1. TRADE OVERVIEW DASHBOARD 市場全体の状況をより簡単に把握できるダッシュボードです。トレード判断をサポートするガイダンスを提供し、市場分析とトレード計画を体系的に行えるよう支援します。すべてを1つの画面で確認できます。 マルチタイムフレーム市場概要(Multi-Timeframe Market Overview) 市場の方向性と価格構造をより明確に把握 市場状況をすばやく確認 体系的な市場分析とエントリー計画のためのガイダンス 2. CONFLUENCE AT ZONE 価格が重要なゾーンに入るとき…いくつのサポート要因が一致しているかを確認で
M1 SNIPER は使いやすいトレーディングインジケーターシステムです。M1時間足向けに設計された矢印インジケーターです。M1時間足でのスキャルピングのためのスタンドアロンシステムとして、また既存のトレーディングシステムの一部としても使用できます。このトレーディングシステムはM1時間足での取引に特化して設計されていますが、他の時間足でも使用できます。元々、この手法はXAUUSDとBTCUSDの取引用に設計しましたが、他の市場においても役立つと考えています。 インジケーターのシグナルは、トレンドの方向と逆方向に取引できます。インジケーターのシグナルを利用して両方向に取引するのに役立つ特別な取引テクニックをご紹介します。この手法は、特別な動的なサポートとレジスタンスの価格帯を利用することに基づいています。 ご購入後、M1 SNIPER矢印インジケーターをすぐにダウンロードできます。さらに、M1 SNIPERツールのすべてのユーザーに、以下のスクリーンショットに表示されているApollo Dynamic SRインジケーターを無料で提供しています。この2つのインジケーターを組み合わせることで
Gold Entry Sniper – ゴールドスキャルピング&スイングトレード用プロフェッショナル多時間足ATRダッシュボード Gold Entry Sniper は、XAUUSDや他の銘柄向けに正確な 売買シグナル を提供する、MetaTrader 5用の高度なインジケーターです。 ATRトレーリングストップロジック と 多時間足分析ダッシュボード を搭載し、スキャルピングからスイングトレードまで対応します。 主な特徴と利点 多時間足シグナル分析 – M1、M5、M15 のトレンドを同時表示。 ATRベースのトレーリングストップ – ボラティリティに応じて動的に調整。 プロ仕様のチャートダッシュボード – シグナル状況、ATRレベル、回帰線、売買方向を表示。 明確な売買マーカー – 自動矢印とテキストラベル。 エグジットアラートとトレード管理 – 利益確定のための自動検出。 完全カスタマイズ可能 – パネル位置、色、フォント、ATR/回帰設定を調整可能。 ゴールド(XAUUSD)に最適化 – M1〜M15のスキャルピングに最適、FXや指数、暗号資産にも対応。 Gold Entry
FiboSniper Pro – Multi-Filter Fibonacci System with Auto SL/TP and Control Panel FiboSniper Proは、動的なFibonacci Envelopesと複数の確認フィルターを組み合わせ、選別されたBuyおよびSellシグナルを生成するテクニカルインジケーターです。FibonacciレベルはMoving AverageとATRを基に計算され、その後ADX、EMA、RSI、ATR、Volume、Time、Candle構造によってフィルタリングされます。インジケーターは、ATRに基づく自動Stop LossおよびTake Profitレベルをチャート上に直接表示し、さらに迅速な調整が可能なインタラクティブControl Panelを提供します。 ご購入後、MQL5で私にメッセージを送っていただくと、Auto Trader Xを無料で受け取れるほか、このインジケーターの取引シグナルを自動化する方法についての説明もご利用いただけます。 User GuideとSet Files: [Click here] 完全
ARICoin is a powerful trading companion designed to generate high-probability entry signals with dynamic TP/SL/DP levels based on volatility. Built-in performance tracking shows win/loss stats, PP1/PP2 hits, and success rates all updated live. Key Features: Buy/Sell signals with adaptive volatility bands Real-time TP/SL/DP levels based on ATR Built-in MA Filter with optional ATR/StdDev volatility Performance stats panel (Success, Profit/Loss, PP1/PP2) Alerts via popup, sound, push, or email Cust
ScalpPoint is a powerful trading companion designed to generate high-probability entry signals with dynamic TP/SL/DP levels based on volatility. Built-in performance tracking shows win/loss stats, PP1/PP2 hits, and success rates — all updated live. Key Features: Buy/Sell signals with adaptive volatility bands Real-time TP/SL/DP levels based on ATR Built-in MA Filter with optional ATR/StdDev volatility Performance stats panel (Success, Profit/Loss, PP1/PP2) Alerts via popup, sound, push, or emai
Auto Optimized SpeedAngle は、継続的なウォークフォワード最適化(WFO:Walk-Forward Optimization)によりカーブフィッティング(過剰最適化)を排除した、機関投資家レベルのモメンタムベクトルシステムです。市場レジームの変化時に効果が低下する静的な入力に依存せず、アウトオブサンプル(OOS)検証を用いてパラメーターを動的に再キャリブレーションすることで、表示されるシグナルが単なる過去の偶然ではなく、確実な統計的優位性に基づいていることを保証します。 主な機関投資家向けフレームワーク ウォークフォワード最適化エンジン: ルックバック期間やしきい値の数千に及ぶ組み合わせを継続的にスキャンし、データをインサンプルとアウトオブサンプルに厳格に分離します。未検証のデータ環境において数学的優位性が証明された場合にのみ、新しいパラメーター設定を採用します。 定量的目的関数: 単なる純利益の追求ではなく、機関投資家レベルの安定性指標をターゲットとします。システム品質ナンバー(SQN)、期待値(1トレードあたりの平均Rマルチプル)、またはネットRの最適化を選
Adaptive Price Action Engine インジケーターを購入すると、EAが無料に マルチタイムフレーム対応・自己最適化トレンド&ローソク足パターン分析 市場環境は常に変化しており、すべてのPrice Actionパターンが、あらゆる市場環境で同じ価値を持つわけではありません。 Adaptive Price Action Engine は、変化する市場環境への適応を目的として、 トレンド構造、マルチタイムフレーム分析、ローソク足パターン、統計的最適化 を1つの分析フレームワークに統合しています。 2つのアダプティブモード Dual Alpha Trend Mode 低い時間足と高い時間足のAlpha Trendパラメータを自動的に探索し、直近の市場動向に合わせてトレンド判定を適応させます。 Candlestick + Alpha Mode Alpha Trendによる市場レジーム判定と、 22種類の強気・弱気ローソク足パターン を組み合わせます。すべてのパターンを同じように扱うのではなく、さまざまなパターンの組み合わせを統計的に評価し、選択された市場環境において過去
Crystal Heikin Ashi Signals—Professional Trend & Signal Detection Indicator Advanced Heikin Ashi Visualization with Intelligent Signal System for Manual & Automated Trading Final Price: $149 ---------> Price goes up $10 after every 10 sales . Limited slots available — act fast . Overview User Guide PDF Crystal Heikin Ashi Signals is a professional-grade MetaTrader 5 indicator that combines pure Heikin Ashi candle visualization with an advanced momentum-shift detection system. Designed for both m
「Scalper Vault」は、デイトレードで安定した成果を目指すトレーダーのために設計された、強力かつ充実した機能を備えたトレーディングシステムです。 この高精度なインジケーターは、それ単体で完結するトレーディングシステムとして機能し、FXやバイナリーオプションのトレーダーに、機関投資家レベルの分析を提供します。 ご購入後、ぜひご連絡ください。 トレードのヒントに加え、豪華なボーナスをプレゼントいたします! 「Scalper Vault」を活用すれば、勘に頼った判断や複雑な手動分析は不要です。使いやすいトレード手法に集中し、純粋に「エントリー・決済」という実行フェーズに専念できます。 高精度なトレンドフォロー・シグナル:中核となるアルゴリズムが市場構造を分析し、主要なトレンド方向に沿った高確率なシグナルを提示します。これにより、誤ったエントリーを大幅に削減できます。 精度の高い天井・底の検知:市場の勢いが尽きたポイントをスキャンし、反転の可能性が高いゾーンを特定します。 ギャン(Gann)理論に基づく売買ゾーン:数学的な「ギャン・レベル」を自動的にチャート上に描画します。機関投資
トレンドキャッチャーインジケーター トレンドキャッチャーインジケーターは、開発者独自の適応型トレンド分析指標を組み合わせることで、市場価格の動きを分析します。短期的なノイズを除去し、根底にあるモメンタムの強さ、ボラティリティの拡大、価格構造の挙動に焦点を当てることで、真の市場方向性を特定します。また、移動平均線、RSI、ボラティリティフィルターなどの平滑化およびトレンドフィルタリング機能を備えたカスタマイズ指標も使用します。 実際の運用状況のモニタリングやその他の製品については、こちらをご覧ください: https://www.mql5.com/en/users/mechanic/seller ご注意ください。私はTelegramでEAや設定を販売していません。詐欺です。すべての設定はブログで無料で公開しています。 重要!ご購入後すぐにご連絡ください。手順とボーナスをお送りします!
Tokyo Indicatorは、トレンドの方向性、潜在的な取引シグナル、および市場状況を視覚的に分かりやすく表示します。 色分けされた階段状のトレンドラインにより、強気局面(青色)と弱気局面(マゼンタ色)が明確に区別されます。トレンドの変化に合わせて表示される方向矢印は、売買の好機を強調します。 統合されたダッシュボードには、現在のシグナル、市場のバイアス(傾向)、モメンタム、ボラティリティ、シグナルの品質がひと目で分かるようにまとめられています。これにより、トレーダーはパネルを切り替えることなく、価格変動(プライスアクション)とインジケーターの数値を照らし合わせて分析を行うことができます。 すっきりとしたチャート表示と簡潔な市場概要により、Tokyo Indicatorはトレンド分析や取引判断における体系的なアプローチをサポートします。 あらゆる時間足や銘柄に対応しており、特に金(ゴールド)の取引に適しています。 トレンド スキャナーの強力なサポートを利用して、無料のインジケーターを入手し、プライバシーを守ります。あーみー!     設定 ShowHUD - チャート上のパネ
Atomic Analyst — MetaTrader 5 ご購入後、MQL5で私にメッセージをお送りいただくと、Smart Universal Expert Advisorを無料で受け取れるほか、オンライン講座、PDFマニュアル、非公開グループへのアクセスもご利用いただけます。 Atomic Analystは、プライスアクション、トレンドの方向、エントリー・決済シグナル、損切り水準、複数の利確水準をチャート上にまとめて表示します。 シグナルを確認し、取引の状況を理解する Atomic Analystは、分析結果をわかりやすい視覚情報として表示します。 • エントリーの候補を見つけるための買い・売りの矢印。 • 取引計画に役立つ損切り水準と複数の利確水準。 • 市場の方向性を評価するトレンド、強さ、モメンタムの指標。 • より広い市場背景を比較する複数時間足の分析。 • 変化する状況を追うための色分けされたローソク足とアラート。 シグナルと補助分析を併せて確認し、その取引機会がご自身のルールに合うかを判断してください。 短期の取引機会から、より大きな値動きまで Atomic A
Unix Scalper — MetaTrader 5 ご購入後、MQL5で私にメッセージをお送りいただくと、Smart Universal Expert Advisorを無料で受け取れるほか、オンライン講座、PDFマニュアル、非公開グループへのアクセスもご利用いただけます。 セットアップを見つけ、取引プランを確認し、取引方法を選ぶ。 UNIX Scalperは、市場分析、BUY/SELL/WAITの判断、Entry、Stop Loss、TP1、TP2の水準を、見やすいパネルにまとめています。 シグナルと取引プランを確認 • 明確な判断:BUY、SELL、WAIT。 • 明示された水準:Entry、Stop Loss、TP1、TP2。 • 複数時間足の一覧:パネル上で各時間足のシグナルを比較。 • 判断を支える分析:トレンド、モメンタム、出来高、ボラティリティ、サポートとレジスタンス、市場の質。 • 選べるレイアウト:Minimized、Compact、Standard、Full。 シグナルと各水準を確認し、そのセットアップがご自身の取引ルールに合うか判断してください。 ゴール
SIO Oscillator:自己最適化型セミバリアンス・インバランス・オシレーター インジケーターをご購入いただくと、それをベースにしたエキスパートアドバイザー(EA)を無料でお受け取りいただけます。 多くのオシレーターは、すべての価格変動を同じように扱います。SIOは上昇圧力と下降圧力を分けて捉え、その間のインバランス(不均衡)を測定することで、買い手と売り手のどちらが本当に相場を支配しているかを示します。インバランスが極値に達すると、SIOはエントリー、ストップロス(Stop Loss)、テイクプロフィット(Take Profit)の水準を伴う明確なシグナルを表示します。 SIOの大きな特長は、固定パラメーターに頼らないことです。内蔵の自己最適化機能が、現在の銘柄と時間足に適したパラメーターを継続的に探索し、使用する前に検証します。 2つのシグナルモード 平均回帰(Mean Reversion):インバランスの極値で取引し、均衡への回帰を狙います。 トレンドフォロー(Trend Following):持続的で優勢なインバランスの方向に取引します。 自動モード:最適化機能が直近のデ
Volatility Master for MetaTrader is a real-time dashboard tool that scans up to  50 symbols  to identify high-volatility , trending markets instantly. With bullish/bearish signals, customizable alerts, and a user-friendly interface, it helps you avoid range-bound conditions and focus on high-probability trades. Clarity leads to confidence. Trade confidently and protect your capital effectively with this powerful dashboard. We don't offer free or bonus indicators in exchange of reviews from you.
Smc Pro ToolKit
Talal N Z Aljarusha
5 (14)
SMC PRO TOOLKIT — SMART MONEY ANALYSIS & STRUCTURED TRADE PLANNING SMC Pro ToolKit is a professional Smart Money Concepts analysis workspace for MetaTrader 5. It combines market structure, multi-timeframe analysis, institutional price zones, setup evaluation, confirmation tools, volume context, alerts, and risk planning inside one organized chart environment. One workspace. Multiple layers of confirmation. One structured trading plan. OPEN COMPLETE USER GUIDE MULTI-CONDITION SETUP ENGINE At
作者のその他のプロダクト
Position and Deal Stats Board is a MetaTrader 5 panel indicator that builds two tables directly on the chart: per-symbol long/short lots and P/L for your open positions and for your closed deals, one row per symbol plus a totals row. TWO TABLES - Open Positions: walks the current positions and aggregates Buy Lots / Buy P/L / Sell Lots / Sell P/L per symbol (floating P/L; swap optional). - Closed Deals: the same four columns for closed deals; the period switches between Today / This week / This m
FREE
品种多空统计(Symbol Stats Board)是 MetaTrader 5 的纯图形面板指标:在图表上按【品种】分别统计「持仓订单」与「已关闭订单」的多空手数、多空盈亏,每个品种一行,末行汇总。 【两张表格】 · 持仓订单表:遍历当前持仓,按品种汇总 多单手数 / 多单盈亏 / 空单手数 / 空单盈亏(浮动盈亏,可选计入库存费)。 · 已关闭订单表:同样四列;统计区间可切换 今日 / 本周 / 本月 / 全部(按服务器时间计算,周以周一起始;盈亏默认含手续费与库存费,可分别关闭)。 · 汇总行:每张表末行为该表全部品种的合计;即使品种数超过显示上限,汇总仍统计全部品种。 · 多空归属:卖出平仓计入多单、买入平仓计入空单(与持仓方向相反),部分平仓按成交手数累加。 【交互】 · 底部按钮:今日 / 本周 / 本月 / 全部 切换统计区间;按品种 / 按盈亏 切换排序(A→Z 或盈亏从大到小);刷新 立即重算。 · 按住标题栏可拖动面板,拖动后不再自动跟随停靠角。 · 面板高度随品种数自动变化;超出图表高度时按缩放系数自动等比收缩,不会被裁切。 · 盈利绿色、亏损红色,便于快速区分。
FREE
Golden Surge Scalper is an Expert Advisor for MetaTrader 5 that trades XAUUSD (gold) on an intraday basis. It looks for momentum breakouts on the M5 timeframe and uses the H1 trend as a filter, so entries are only taken in the direction of the larger move. Positions are opened and closed automatically and the Expert Advisor holds one position at a time. LIVE: https://www.mql5.com/zh/signals/2394190?source=Site +Profile+Seller The Expert Advisor does not use a grid, does not use martingale and do
フィルタ:
レビューなし
レビューに返信