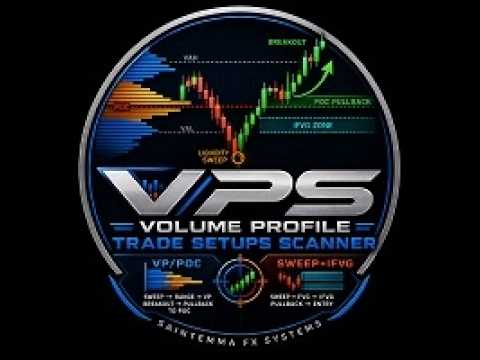
Volume Profile Trade Setups Scanner
- インディケータ
- バージョン: 1.0
- アクティベーション: 20

Professional overview
Volume Profile Trade Setups Scanner, designed to be both informative and highly persuasive for a trader looking for an edge.
---
The Volume Profile Trade Setups Scanner: Your Institutional Edge for Liquidity & Volatility
The Holy Grail of retail trading is not a strategy, but a framework for understanding where the "big money" is positioned.
The Volume Profile Trade Setups Scanner is not just another indicator; it is a proprietary, multi-strategy reconnaissance system designed to operate at the intersection of institutional order flow and retail psychology. By focusing on the two most critical market mechanics—Liquidity Sweeps and Volume Imbalances—this scanner filters out the market noise and delivers only the highest-conviction, "Ready-to-Trade" setups directly to your screen.
This system replicates the logic used by sophisticated prop firms and hedge funds. It scans the entire Market Watch in real-time, running two powerful strategy engines simultaneously. It does not predict the market; it identifies where the market is most likely to reverse, giving you a statistical advantage with clearly defined risk-to-reward parameters.
---
MODUS OPERANDI: How the Machine Thinks
The scanner's architecture is built on the premise that price moves from one liquidity pocket to another. To profit, you must identify where the smart money is hunting for stops and where they are building their positions.
Strategy Engine 1: The VP_POC (Volume Profile Point of Control)
This engine replicates a classic, highly profitable mean-reversion breakout strategy.
1. Liquidity Sweep (The Trap): The scanner first identifies a swing high or swing low that has been taken out (swept) by price. Crucially, it confirms that price closed back inside the previous range. This is the "stop hunt"—retail traders are stopped out, and the institutional traders are now positioned for a reversal.
2. Range / Consolidation (The Building Block): Immediately after the sweep, the scanner looks for a period of consolidation. It ensures the range is not too wide (filtered by ATR) and not too short, confirming that a base is being built before the next directional move.
3. Volume Profile (The Fair Value): It then renders a full Volume Profile over this consolidation period, calculating the Point of Control (POC) , Value Area High (VAH) , and Value Area Low (VAL) . This identifies the exact price level where the most volume has been transacted—the "fair value" of that range.
4. Breakout & Pullback (The Entry): When price breaks out of the consolidation range (in the direction of the sweep reversal), the scanner doesn't chase the move. It waits for the inevitable pullback to the POC. This is where the entry trigger fires, allowing you to enter at a "discount" in a breakout scenario.
5. Target & Stop (The Risk Management): The stop-loss is placed safely beyond the swept liquidity level. The take-profit is dynamically calculated as the next un-taken swing high or low, ensuring you are not capping your profits prematurely.
Strategy Engine 2: The SWEEP_IFVG (Sweep + Inverse Fair Value Gap)
This engine is a modern masterclass in "Smart Money" concepts, replicating the logic of the popular Algorithmic "Sweeps & IFVGs" but in an automated, scannable format.
1. Liquidity Sweep (The Catalyst): Identical to Engine 1, the strategy starts with a confirmed sweep of a recent swing point.
2. Fair Value Gap (FVG) Formation: The scanner identifies an FVG (a three-candle imbalance) that formed into the liquidity sweep. This implies that price moved aggressively in one direction, leaving a void on the chart.
3. Gap Invalidation (The Flip): As the market reverses from the sweep, it eventually closes back into the FVG. This "invalidates" the gap. The FVG is no longer an area of inefficiency to be respected; it flips and becomes an Inverse FVG (IFVG) .
4. Pullback to IFVG (The Entry): This Inverse FVG zone now acts as the new support (in a bullish reversal) or resistance (in a bearish reversal). The scanner triggers a signal when price retests this zone, confirming it holds as a pivot point. This is a high-probability entry at the exact point where supply and demand are flipping roles.
---
The Dashboard & User Experience: Simplicity Meets Power
You don't need to be a coder to use this system. The information is presented on a clean, organized dashboard.
· The Scan Button: A simple on/off toggle for the scanner. When active, it silently works in the background.
· The News Filter: This is a critical risk-management feature. It blocks all signals from being displayed if there is a high-impact economic news event for the base or quote currency within a user-defined window (default 240 minutes before and 30 minutes after). This prevents you from entering a trade just before a volatile data release that could invalidate your setup.
· The Ready Signal Dashboard: This is your command center. Rows are sorted to show the highest-quality setups first.
· It displays the Symbol, Strategy (VP/POC or IFVG) , Direction (BUY/SELL) , Entry Price, Stop Loss, Take Profit, and Risk-to-Reward Ratio.
· Click any row in the dashboard, and the scanner will automatically:
1. Open a new chart for that symbol with the selected timeframe.
2. Draw the Volume Profile (Engine 1) or the IFVG Zone (Engine 2).
3. Mark the Liquidity Sweep with a label.
4. Display Entry, Stop-Loss, and Take-Profit boxes directly on the chart.
5. Apply the recommended chart style for clarity.
It's a one-click execution workflow that takes you from scanning to a fully annotated chart in seconds.
---
DO'S & DON'TS: Maximize Your Success
DO'S
· Focus on the "READY" Signals: The scanner filters both "Waiting for Pullback" and "READY" setups. Only act on the "READY" signals, as these have confirmed the pullback entry condition.
· Trust the News Filter: High-impact news is a volatility black hole. It is better to miss a move than to be stopped out in a 50-point wick. Keep the news filter on.
· Combine with Price Action Context: The scanner gives you a mechanical entry, but use your judgment. Is there a major daily level near the take-profit? Consider taking partial profits. Is the overall trend supporting the direction? Use the scanner as a tool in a broader plan.
· Use the "Click-to-Chart" Feature: This is your workflow. Do not manually search for levels. The scanner instantly builds the entire analysis on a clean chart, saving you hours of manual drawing and verification.
DON'TS
· Don't Ignore the ATR Filtering: The scanner uses Average True Range to define range sizes. Do not use this on low-volatility symbols where the ATR is too small, or on highly volatile assets where the ATR is too large. Always respect the scan interval.
· Don't Move the Stop-Loss: The stop-loss is placed beyond the swept liquidity level. This is your key risk management principle. Moving it closer to the entry exposes you to a simple retest of the previous level. Respect the system's logic.
· Don't Force Trades: If a symbol only produces a "WAITING_PULLBACK" status and the pullback doesn't come, it is not a signal. Do not chase the price. The scanner is designed to protect you from FOMO.
· Don't Over-Leverage: While the scanner provides great entries with a defined SL and TP, no system is 100% accurate. Use responsible position sizing. A 1% risk per trade is a solid rule of thumb.
---
In Conclusion: A True "Set and Forget" Tool
The Volume Profile Trade Setups Scanner is a culmination of proven institutional concepts—Liquidity Sweeps, Volume Profiles, and Fair Value Gaps—encapsulated into a user-friendly interface. It removes the subjectivity from trading by providing hard, data-driven entry, stop, and target levels.
By automating the screening of both strategies across hundreds of symbols, it allows you to focus on execution rather than analysis. It is not a magic wand; it is a force multiplier. For the disciplined trader, this scanner is the only tool you will ever need to consistently identify where the "big money" is making its next move and ride the resulting momentum with confidence.
---
Disclaimer: Trading financial instruments involves a substantial risk of loss. Past performance is not indicative of future results. This indicator is a tool to assist in analysis and does not constitute financial advice. You should fully understand the risks involved and seek independent advice if necessary.