Quantum Dynamic Volatility Indicator
- インディケータ
- バージョン: 5.0
- アップデート済み: 6 1月 2025
- アクティベーション: 5

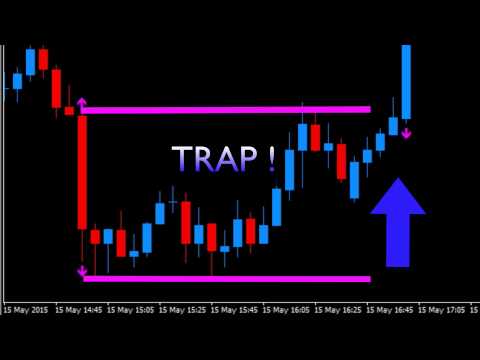
Have you ever wondered why so many Forex traders get trapped in weak positions on the wrong side of the market? One of the easiest ways the market makers do this, is by using volatility. A currency pair moves suddenly, often on a news release or economic data. Traders jump in, expecting some quick and easy profits, but the move suddenly moves in the opposite direction.
This happens in all timeframes, and in all currency pairs. The candle or bar closes, with a wide spread, but then reverses sharply, leaving traders trapped. But how do you know what’s extreme price action for the currency pair?
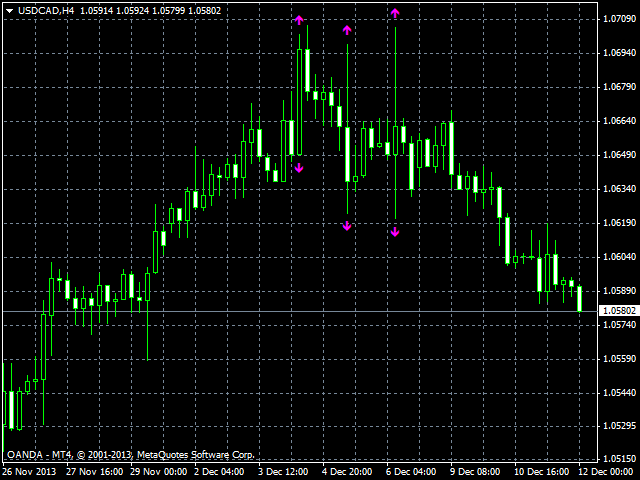
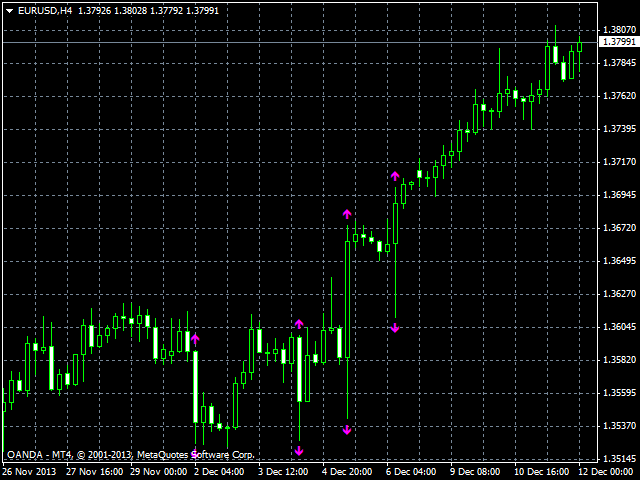
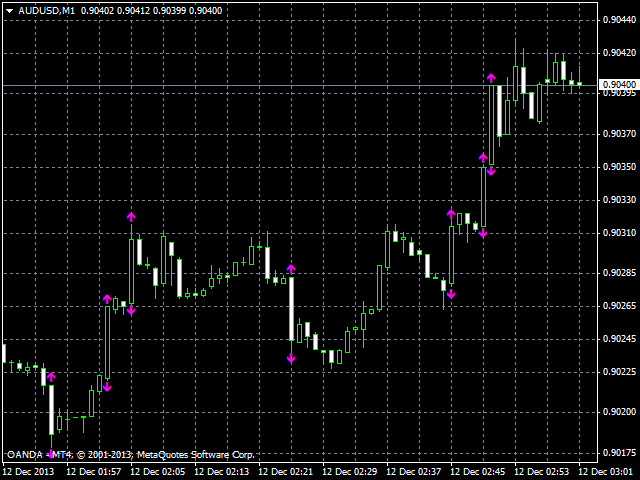
The Quantum Dynamic Volatility indicator signals this volatility, using average true range. The indicator is constantly scanning the price action for extremes, and when they arrive, are signalled on the chart with a purple arrow, above and below the candle.
This is a warning signal to stay out. If the signal is validated on the next or subsequent bars with a close well above, then it’s safe to consider a position.
The Quantum Dynamic Volatility indicator is sending a clear warning. It’s warning of high risk, and telling you to take care. Volatility can seriously damage your wealth! Invest in the Quantum Dynamic Volatility indicator now, and add this to your toolkit of safety first indicators.